


Bitcoin trades at $83,935 on the BTCUSDT pair on October 12, 2026, up 0.25% over the prior session. The most striking high remains the September 21 print at $87,385, followed by the capitulation low of October 8 at $80,345. Price sits 3.9% below the peak and is locked in a post-purge compression phase, sandwiched between residual demand at $82,900 and dense supply at $84,060.
The recent bearish episode occurred against a documented derivatives shock. Le Journal du Coin (October 12, 07:45) reports $1.19 billion of leveraged positions liquidated within 24 hours during the early-October selloff. Aggregate BTC Open Interest contracted by 6.34% over seven days to $7.87 billion, a flush that mechanically reduced cascade risk. US spot Bitcoin ETFs are negative by $386.3 million in October (Decrypt, October 11, 18:01), with a record outflow of $484.9 million on October 9 — the heaviest since June. October 10 brought $21.1 million of inflows, an insufficient rebound to reverse the flow. The one-year anniversary of the October 10, 2025 flash crash ($19 billion of liquidations, CoinDesk, October 10, 18:01) keeps market-making on edge.
On the macro side, recent releases confirm a cautious climate. FOMC minutes released October 7 (federalreserve.gov) delivered a balanced message without a dovish pivot. The preliminary UoM consumer sentiment reading came in at 46.3 (consensus 47.6, Decrypt, October 11, 18:01), a signal of weak US demand. In China, the PBOC has been buying gold for 23 consecutive months (CNBC, October 12, 02:51), a structural diversification away from the dollar weighing on the crypto narrative. The FSB has flagged stablecoin and AI risks to the G20 (Cointelegraph, October 12, 08:30). On the corporate side, Strategy (formerly MicroStrategy) acquired 334 BTC for $28.7 million between September 28 and October 4, lifting its treasury to 848,000 BTC (Cointelegraph, October 11, 19:03). Michael Saylor has again teased a new purchase, but the SEC filing is only expected Tuesday due to Columbus Day. Meanwhile, the Sam Altman-backed life insurer, raised $37.5 million (Decrypt, October 10, 18:01), a positive signal for long-term adoption.
This context neutralizes any bullish case and dictates caution as long as ETF flows fail to turn. The US CPI on October 14 is the only event capable of breaking the current range structure and arbitrating between bearish and bullish scenarios.
Multi-Timeframe Technical Analysis
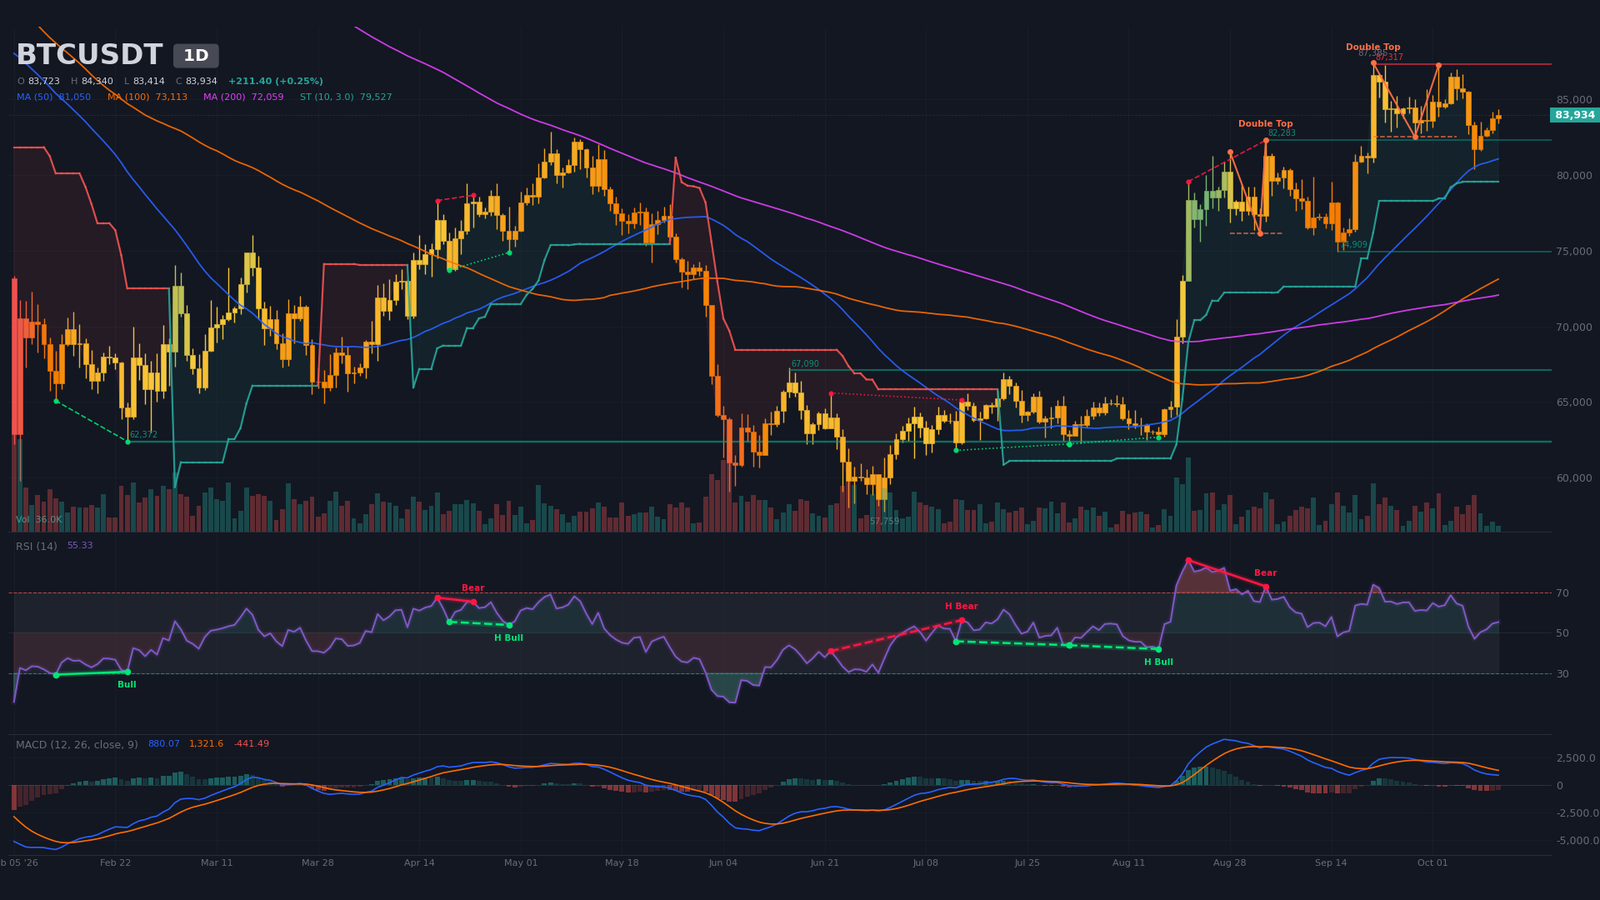
Daily Timeframe (1D): Post-double-top recovery
The Daily is dominated by a post-double-top bearish structure in a technical recovery phase. Chartimg.py confirms a double top with peak 1 on September 21 at $87,385 and peak 2 on October 2 at $87,250. The neckline sits at $82,500 and the algorithmic target at $77,683 — a figure still ahead of the tape. Bitcoin at $83,935 trades 0.2% below the SMA20 ($84,109), but 3.6% above the SMA50 ($81,050) and 16.5% above the SMA200 ($72,059). The bullish SMA50/SMA200 crossover (golden cross) dates back to September 8 (34 candles), validating the long-term primary uptrend.
The RSI14 (Relative Strength Index) at 55 is neutral, cooling from 69 on October 7, with no marked divergence on this timeframe. The daily MACD (Moving Average Convergence Divergence) shows a bearish crossover dated September 29 (13 candles): the line crossed back below signal, both still above zero; the negative histogram is contracting, a sign of slow return to equilibrium. Today’s volume (provisional candle) sits at 28% of the 20-period average — the recovery is plainly lacking conviction. The October 8 swing low at $80,345 holds for now as the first support, followed by the figure target at $77,683.
Intermediate Dynamics (4H): Triple top completed, rebound digesting
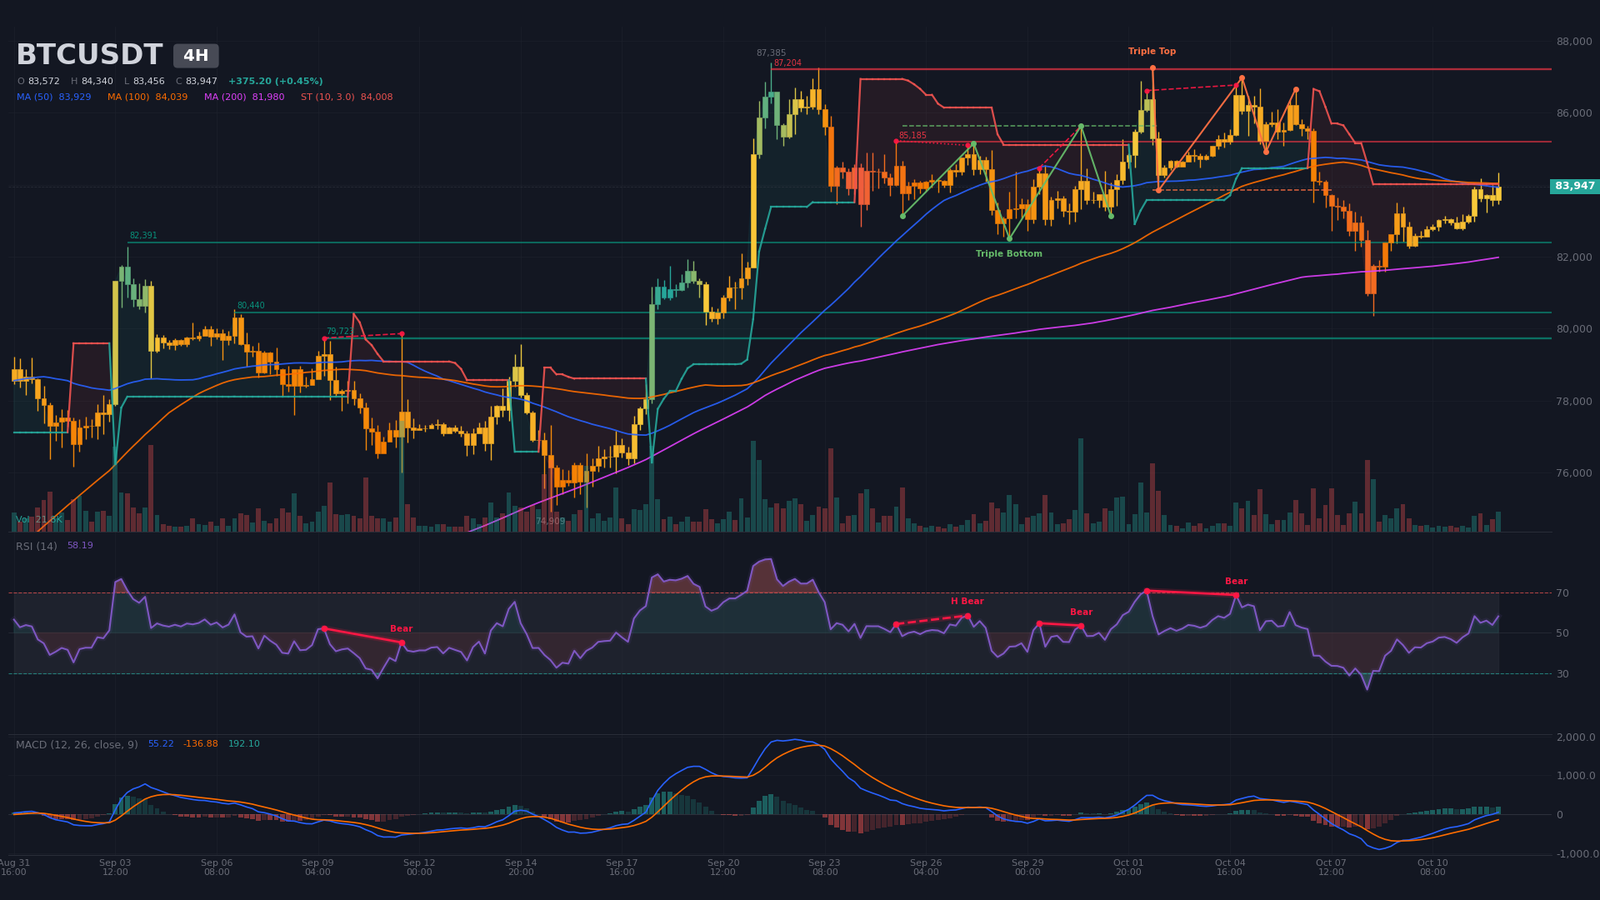
The H4 tells a more tactical story: digestion of a completed triple top. Chartimg.py identifies a triple top with a neckline at $83,842 and an algorithmic target at $80,720 — a level broadly hit, given the H4 low on October 8 at 16:00 printed $80,345. The bearish figure is therefore mechanically invalidated as long as price holds above $83,842. Conversely, a bullish triple bottom is forming with a neckline at $85,633 and a target at $88,343 — a figure not yet triggered that conditions any attack on the highs. The H4 MACD shows a bullish crossover dated October 9, 12:00 (16 candles), with an expanding positive histogram — short-term momentum remains positive. The H4 RSI14 at 58 is neutral but rising from 31 on October 8.
The price structure shows three close highs (86,976, 86,664, 86,617) tracing resistance, then three lows (82,706, 80,345, 82,242) that found support. Price at $83,947 trades above the SMA20 ($83,034), SMA50 ($83,929) and SMA200 ($81,980) — a tactically bullish configuration. The H4 SuperTrend, however, stays bearish at $84,008: price sits just below, the first dynamic resistance to reclaim to validate the recovery. A regular RSI divergence formed between October 2 and October 4 (price 86,616 → 86,770, RSI ~71 → ~69), a structural exhaustion signal weighing on bullish conviction.
Intraday Structure (15m): Wedge compression ahead of catalyst
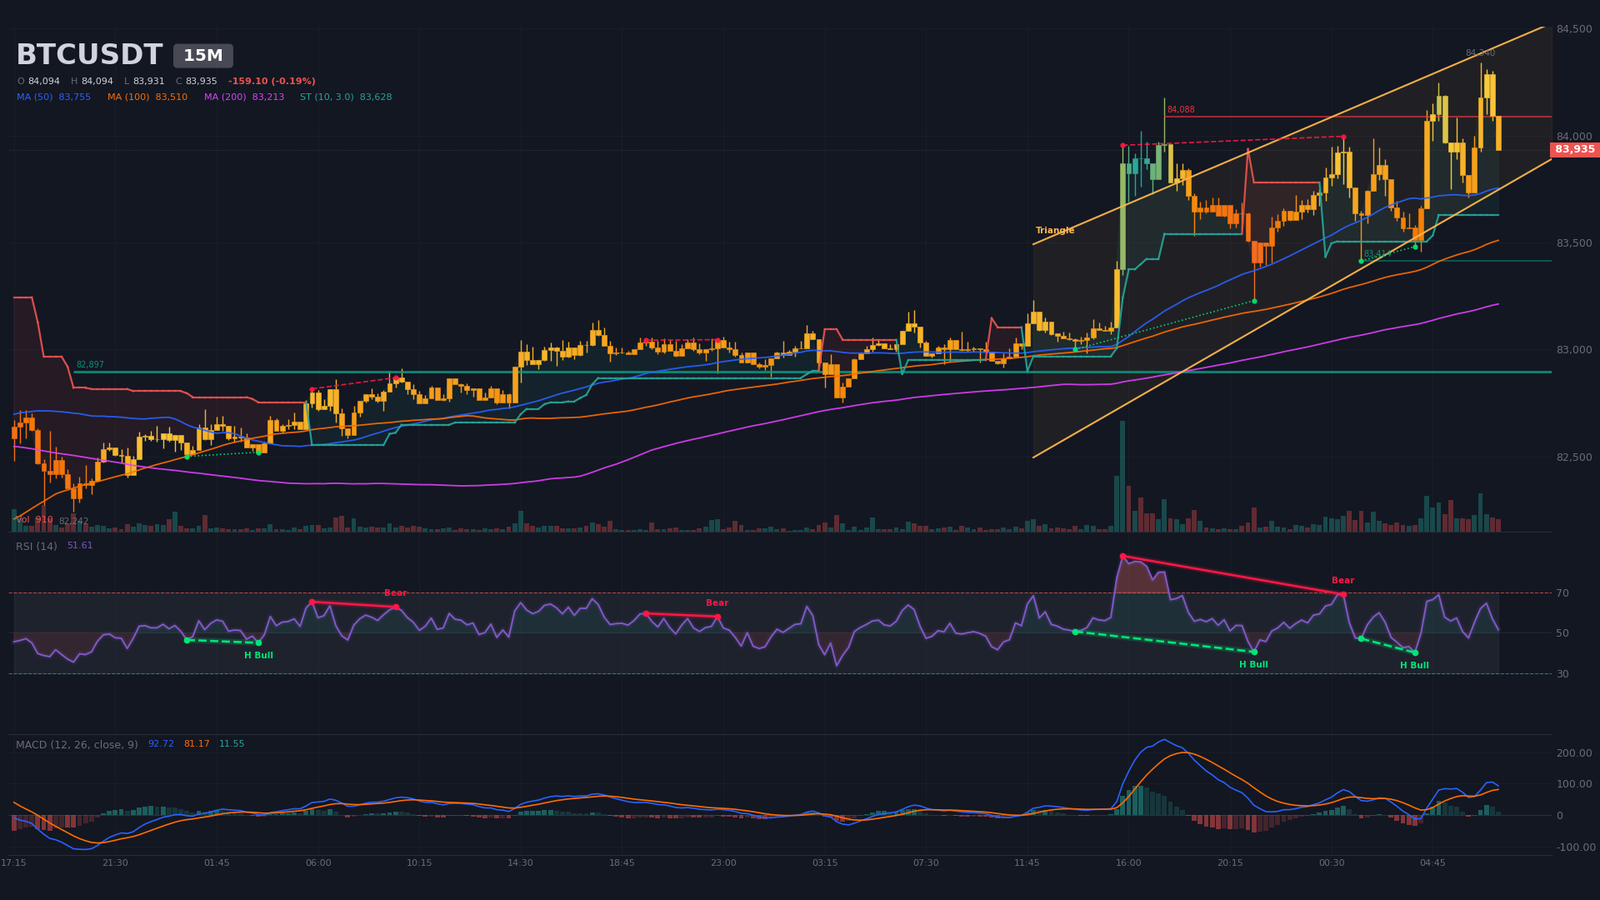
The M15 describes a wedge compression between $83,667 (low) and $84,360 (high), with the apex estimated at October 13, 23:57. This neutral continuation figure will resolve with a directional break. The major M15 support at $82,897 has been tested 16 times — an institutional level hard to break without a catalyst. The M15 resistance at $84,089 (2 touches) marks the current ceiling. The M15 RSI at 52 is neutral; the MACD just crossed bullishly (06:45 on October 12, 3 candles), positive histogram in mild expansion. The M15 SuperTrend is bullish at $83,629. The intraday picture remains neutral, locked in an exceptionally tight 24-hour range (low 82,242, high 84,340, provisional candle).
Multi-Timeframe Synthesis
| Timeframe | Dominant Trend | RSI (14) | MACD | Chart Pattern |
|---|---|---|---|---|
| Daily (1D) | Bearish (technical recovery) | ~55 (neutral) | Bearish crossover 13 days ago, contracting negative histogram | Confirmed double top (target 77,683) |
| 4 hours (4H) | Neutral-bullish (digestion) | ~58 (neutral) | Bullish crossover 16 candles ago, expanding positive histogram | Completed triple top + forming triple bottom |
| 15 minutes | Neutral (compression) | ~52 (neutral) | Bullish crossover 3 candles ago, positive histogram | Continuation wedge (apex ~10/13) |
Technical Levels and Pivot Map
The map combines classic daily pivots with swing highs and lows, daily double-top algorithmic extensions, order-book liquidity zones and estimated liquidation pockets. The short-term central pivot sits at the daily SMA20 ($84,109) — price oscillates $175 below, in a fragile equilibrium where each candle tilts the break.
| Level | Price (USD) | Category | Technical Basis |
|---|---|---|---|
| Major Resistance 3 (R3) | 87,200 – 87,800 | Major resistance | Estimated short liquidation pocket (peak $87,770, $97M) + highs $87,385 (09/21) and $87,250 (10/02) + H4 resistance $87,204 |
| Major Resistance 2 (R2) | 86,600 – 87,000 | Major resistance | Daily swing highs $86,976 (10/05), $86,664 (10/06), $86,617 (H4) |
| Immediate Resistance (R1) | 84,350 – 84,400 | Immediate resistance | Daily R1 pivot $84,352, ask walls $84,062 ($22.9M) and $84,016 ($21.1M), intraday high $84,340 |
| Central Pivot (P) | 83,650 – 84,000 | Central pivot | Current price zone, H4 SMA50 $83,929, daily P pivot $83,551, main bid wall $83,879 ($21.1M) |
| Immediate Support (S1) | 82,850 – 83,000 | Immediate support | M15 support at $82,897 (16 touches), daily S1 pivot $82,923, daily SMA50 $81,050 |
| Major Support 2 (S2) | 80,300 – 80,800 | Major support | Low $80,345 on 10/08/2026 (daily swing low), H4 triple-top target $80,720 |
| Major Support 3 (S3) | 79,500 – 79,700 | Major support | Estimated long liquidation pocket ($79,963–$80,055 for $26M + $79,506–$79,643 for $22.5M), H4 support at $79,723 (3 touches) |
Order Book and Liquidity Heatmap
The aggregated Binance order book (92% coverage) shows a -6% imbalance in favor of sellers within ±2% of the reference price: $65.7M of bids against $74.1M of asks. The main bid cluster sits at $83,879 ($21.1M), followed by $83,925 ($17.1M) and $83,833 ($15.9M) — a very dense floor less than 0.2% below price. On the ask side, the thickest walls cluster at $84,062 ($22.9M) and $84,016 ($21.1M) — the intraday ceiling is locked in the $84,060 – $84,200 zone.
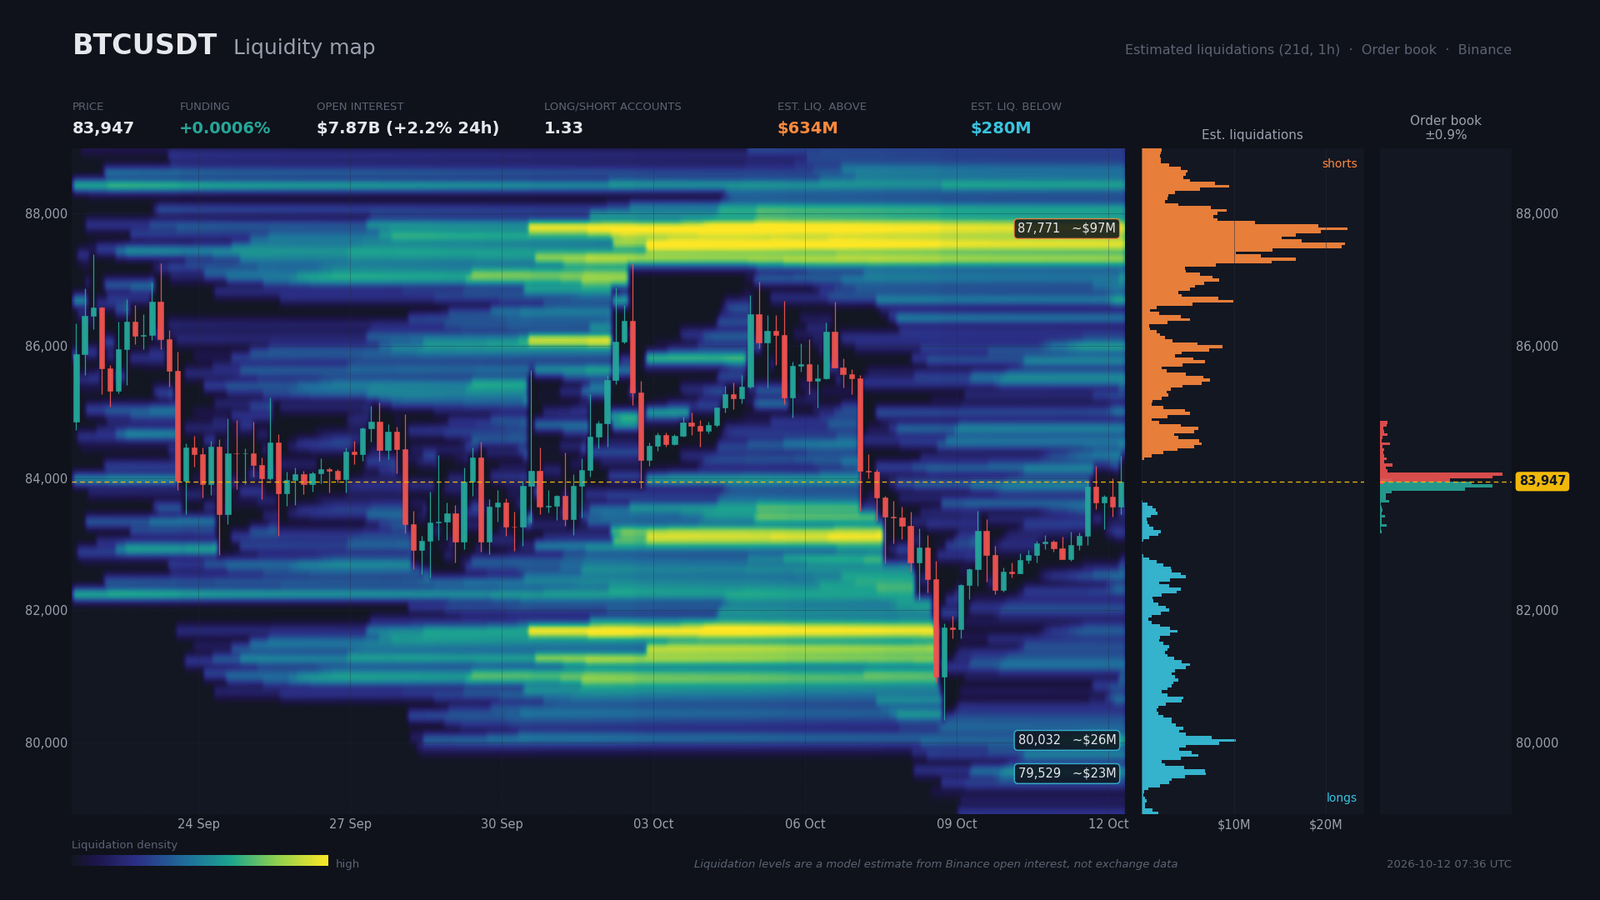
On derivatives, the perpetual funding rate sits at 0.0006% per 8h (0.6% annualized), an extremely low level reflecting the absence of directional speculation. Aggregate Open Interest is $7.87 billion, up 2.18% over 24 hours but down 6.34% over seven days — last week’s flush effectively cleaned leverage. Long/short ratios remain buyer-skewed: 1.33 across all accounts, 1.54 among top traders, 1.14 on taker buy/sell 24h.
Estimated liquidation pockets draw two strong magnets. Above (shorts to liquidate): $633 million cumulative, with main concentration between $87,656 and $87,885 ($97.2M) and two other clusters between $87,473 – $87,610 ($74.5M) and $87,244 – $87,336 ($41.1M). Below (longs to liquidate): $280 million, with two dense clusters between $79,964 – $80,055 ($26.0M) and $79,506 – $79,643 ($22.5M). Mechanically, a break below $82,900 would trigger a cascade toward $80,700 – $79,500, while a push above $84,400 would open the race toward $87,700 with a potentially violent short squeeze. The current risk is a moderate bearish sweep, the book being slightly short on bids.
Calendar: Catalysts to Watch
The macroeconomic calendar over the coming days centers on the US CPI on Wednesday, October 14 — the only event capable of breaking the current range structure and arbitrating between bearish and bullish cases. Vigilance remains warranted as long as spot ETF flows fail to turn durably.
- Tue. Oct. 13, 16:00 — US existing home sales. Consensus 3.96 million annualized, previous -2%.
- Wed. Oct. 14, 03:30 — China CPI m/m. Consensus 0.3%, previous 0.4%.
- Wed. Oct. 14, 04:10 and 10:30 — Christine Lagarde (ECB) speaks, EUR/USD impact.
- Wed. Oct. 14, 14:30 — US CPI m/m (consensus 336.67; previous 334.131, index level) and core CPI m/m (consensus 0.2%, previous 0.3%). Major catalyst of the week: a hawkish surprise would reignite selling pressure toward $80,000; a softer print would trigger an attack on $87,000.
- Thu. Oct. 15, 14:30 — US core PPI (consensus 0.5% vs 0.4%) and core retail sales (consensus 0.3% vs 1.4%).
Three Scenarios for the Coming Weeks
The 6.3% Open Interest flush over seven days has cleansed the leverage market, which supports sideways consolidation rather than a clear trend. Three scenarios emerge over the coming weeks, totaling 100% probability.
Scenario A — Range trading toward resistance (probability 50%)
Catalyst: sideways digestion, no macro surprise. Trigger: price holds between $82,900 and $84,400. Path: pullback toward $83,600 – $83,900, rebound, R1 test then push to $85,114. Target 1: 85,600 – 85,700 (H4 triple-bottom neckline). Target 2: 86,600 – 87,000 (R2, daily swing highs). The scenario dominates because the OI flush and negative ETF flows suggest consolidation rather than a clear trend. Execution zone: $83,600 – $83,900 on pullback buy. Stop: H4 close below $82,300 (-1×ATR14 H4 ≈ -$610). Invalidation: daily close below $82,500 (double-top neckline). R:R (risk/reward ratio) toward 86,600 ≈ 1.8.
Scenario B — Bearish sweep (probability 30%)
Catalyst: hotter than expected CPI on October 14 or prolonged ETF disengagement. Trigger: H4 break and close below $82,700. Path: $82,400 → $81,050 (daily SMA50) → $80,345 (October 8 low). Target 1: 80,700 – 80,400. Target 2: 79,500 – 79,700 (estimated long liquidation pocket, $48M cumulative). The scenario remains supported by the order-book profile (-6% sellers) and the H4 bearish divergence. Execution zone: H4 break below $82,700 then retest. Stop: return above $83,900 (H4 close, +2×ATR14). Invalidation: daily close below $81,050 (daily SMA50). R:R toward 79,700 ≈ 2.5.
Scenario C — Short squeeze (probability 20%)
Catalyst: softer than expected CPI on October 14, or Strategy filing Tuesday. Trigger: H4 break above $86,700 (R2 zone). Path: $86,700 → $87,200 → $87,700. Target 1: 87,000 – 87,300. Target 2: 87,700 – 88,000 (short liquidation clusters, $213M cumulative between 87,244 and 87,885). The scenario requires an external catalyst. Execution zone: retracement to $84,400 – $84,700 (R1) after confirmed break. Stop: below $82,900 (S1). Invalidation: daily close below $82,500 (double-top neckline). R:R toward 87,700 ≈ 2.2.
Synthesis and Conclusion
Bitcoin is going through a post-leverage-flush consolidation phase, sandwiched between residual demand around $82,900 (M15 support at 16 touches) and dense supply at $84,060 – $84,200 (ask walls). The daily structure remains fragile due to the confirmed double top at $77,683, but the 6.3% Open Interest contraction over seven days has cleaned the market: cascade risk is lower than before last week’s episode. The daily bearish MACD should be monitored as a thermometer — a bullish flip would validate a regime change.
The dominant strategy stays range trading with a bias toward resistance as long as $82,900 holds. ETF flows are the real-time signal to monitor: a durable return to positive flows would catalyze the break of $87,000 and the short liquidation magnet at $87,770. The critical levels to watch are $82,900 (M15 support at 16 touches), $80,345 (October 8 low), $84,400 (first obstacle to reignite a renewed attack), $86,600 – $87,000 (daily swing highs zone), and $87,700 (short liquidation magnet, $97M estimated).
Sources
- Saylor Again Teases Strategy Bitcoin Buying Ahead of Columbus Day — Cointelegraph, 10/11/2026
- Bitcoin, Ethereum and Solana ETFs All in the Red for October — Decrypt, 10/11/2026
- Bitcoin’s $19 billion wake-up call — CoinDesk, 10/10/2026
- Why China is importing a record amount of gold — CNBC, 10/12/2026
- Here are the 6 big things we’re watching in the stock market this week — CNBC, 10/11/2026
- Plenty is working against this market — CNBC, 10/11/2026
- XRP Hits $1.40 as Evernorth Lists on Nasdaq — Journal du Coin, 10/12/2026
- Crypto : Comment 3 dollars d’écart sur l’ETH ont rapporté 1,28 million à un trader — Journal du Coin, 10/12/2026
- Global watchdog flags stablecoin risks, AI threats ahead of G20 — Cointelegraph, 10/12/2026
- Sam Altman-Backed Life Insurer Runs Entirely on Bitcoin — Decrypt, 10/10/2026
- FOMC Meeting Calendars 2021-2027 — federalreserve.gov, 10/07/2026
- SEC Targets Crypto Custody Rules in Major Regulatory Shift — Investing.com, date not specified
- SEC.gov | Adviser and Regulated Fund Custody Rules — sec.gov, 10/01/2026
- Bullish bitcoin bets build as open interest jumps by $2.3 billion — CoinDesk, 10/02/2026
- Leverage Went to Futures, Not Options — BIT, 10/05/2026
- Crypto Weekly #350 — Journal du Coin, 10/12/2026
Disclaimer: This article is for educational and informational purposes only. It does not constitute investment advice, a recommendation to buy or sell, or an invitation to trade any financial asset. Cryptocurrency markets are extremely volatile; any investment decision should be based on your own research (DYOR) and, where appropriate, the advice of a licensed financial adviser.

