


Bitcoin is trading around $82,741 on the BTCUSDT pair this Friday, October 10, 2026, in a horizontal consolidation that masks an increasingly fragile equilibrium. The recent cycle peak remains at $87,385, set on September 21; it was followed by a 5.3% correction, then a second top at $87,250 on October 2 that drew a bearish double top now confirmed on the daily chart. The neckline at $82,500 acts as the pivot: five daily candles since the formation failed to close above it, which validates the pattern and exposes the price to an algorithmic target of $77,683.
The dominant driver of the week is unmistakably the wave of redemptions on US spot Bitcoin ETFs. According to CoinDesk, $487.1M flowed out net on Wednesday, October 8 — the largest outflow since June 25, or 2.1 standard deviations below the 90-day average — and $729M cumulatively over two days according to Bitcoin Magazine, hitting BlackRock, Fidelity, Morgan Stanley, and ARK 21Shares. The YTD spot ETF balance slips back to +$717M after touching -$5.76B in July, a sign that structural demand remains hesitant as Bitcoin lost the $83,000 floor on October 8. The parallel with the October 10, 2025 crash is documented by Yahoo Finance / CoinGlass: open interest climbed 4.0% in seven days to reach 650,480 BTC (3.2% of market cap, versus 3.7% before the crash), and $403.6M of long positions were liquidated in a single hour on Wednesday. Two notable differences mark the current phase: BTC annualized funding exceeded 8% in only one session out of 28 (7.1% this week versus 26.9% before 10-10-2025), and Ethena’s USDe supply has contracted 66% to $4.99B, removing the speculative fuel.
On the macro side, the minutes of the September 16-17 FOMC meeting, released on Wednesday, October 7, were read as hawkish: inflation remains « the greatest risk » according to the account cited by Reuters, which supported long-term yields. Jim Cramer, on CNBC, flagged a risk of the 10-year Treasury crossing 6%. French 10-year yields hit 4.99% in early October, their highest since July 2002, with an OAT-Bund spread above 150 basis points, fueling a flow back into US Treasuries whose 10-year now tops 5.2%. High-yield credit is « flashing yellow » per CNBC, with an average yield of 8.1% and CCC spreads sharply wider — a typical risk-off configuration. The US labor market remains solid (jobless claims at 197k on Thursday, October 8; Atlanta Fed GDPNow at 3.6%), while the preliminary UoM sentiment on October 9 came in at 46.3, below the 47.6 consensus and at a multi-month low. US-Iran tensions — Treasury Secretary Scott Bessent’s October 9 statement on an imminent seizure of $1B in crypto linked to Iran — fuel geopolitical risk and support oil, which had already pushed Bitcoin below $83,000 the previous week.
This combination — leverage purge largely complete, neutral funding, substantial liquidity supports lower, ETFs still in outflow, extreme macro volatility ahead of the October 14 CPI — neutralizes the bearish technical signal without reversing it. It is in this framework that the following multi-timeframe technical analysis should be read: a market lying on a neckline, awaiting the verdict of US inflation to choose its direction.
Multi-Timeframe Technical Analysis
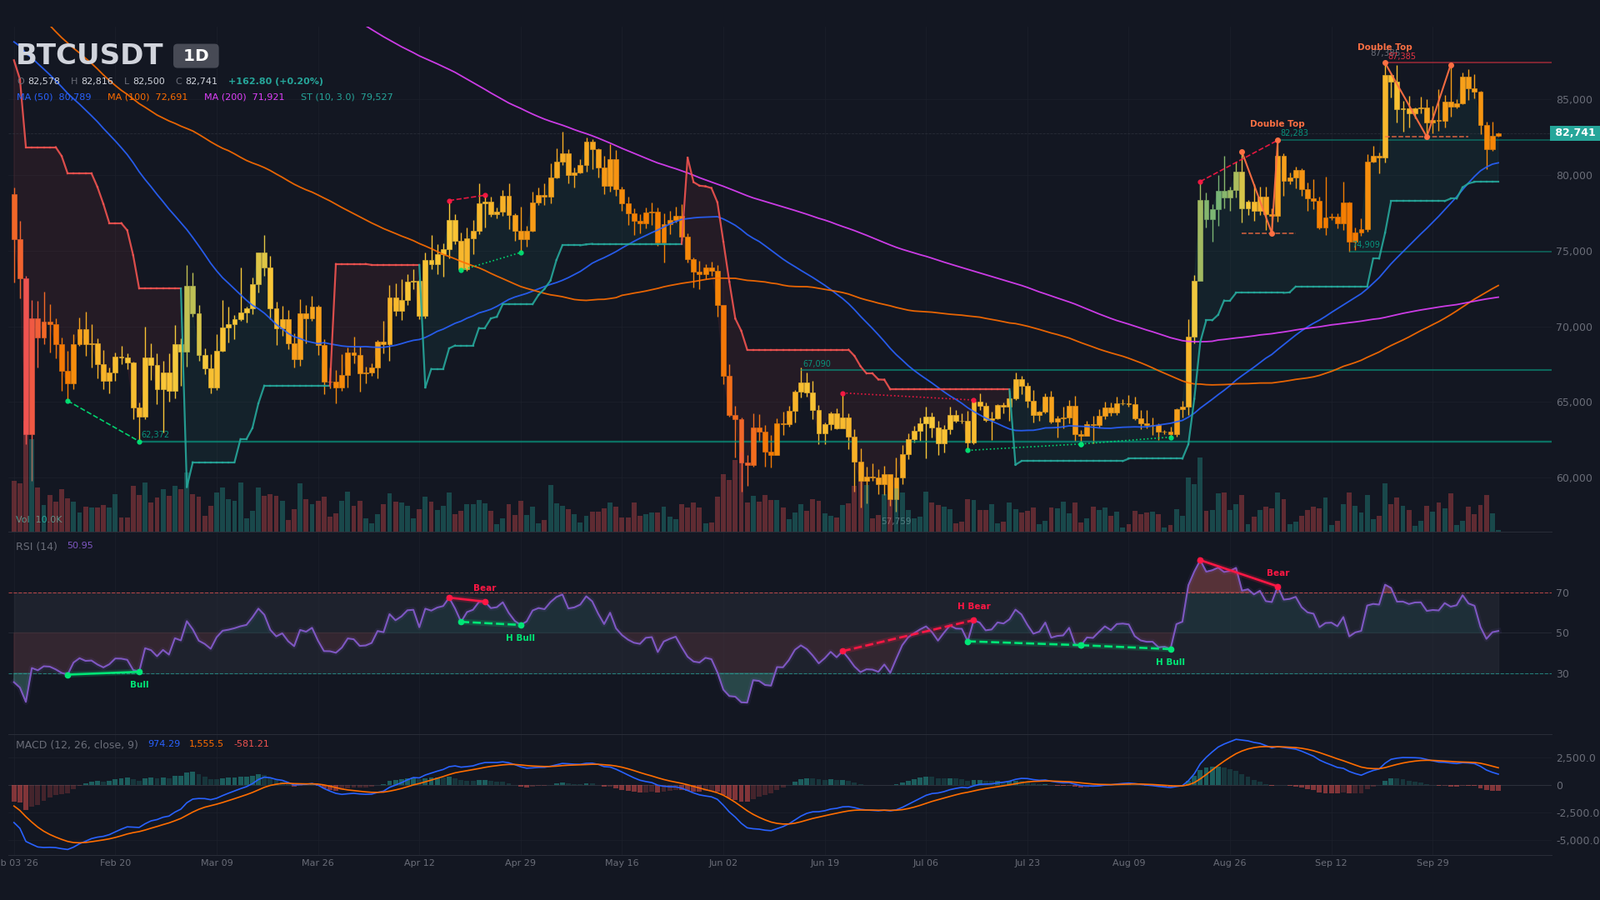
Daily Timeframe (1D): Double Top Confirmed, $77,683 Target
The daily chart preserves an intact secular uptrend: price remains above the SMA50 at $80,789 and the SMA200 at $71,921, with the bullish 50/200 cross dating to September 8, 32 candles ago. But short-term dynamics have flipped: Bitcoin slipped back below the SMA20 at $84,353 on October 8, signaling a distribution/consolidation phase after the rally (top at $87,385 on September 21, second top at $87,250 on October 2). The double-top pattern was confirmed by the chartimg detection tool, with a neckline at $82,500 and an algorithmic target of $77,683 — the five candles since the neckline failed to close above it, validating the pattern.
The daily MACD completed a bearish cross on September 29 (11 candles), the line (974) slipped below the signal (1,555), and the histogram is negative at -581: the bearish dynamic is in place. The RSI14 at 50.9 is turning against the weekly trend while remaining neutral; a regular bearish divergence (price 79,555→82,282, RSI 86→73) had been detected from August 21 to September 3, foreshadowing the September top. The SuperTrend remains bullish at $79,527 — the last structural rampart before the September 15 low at $74,909. Daily volume sits at only 7% of the 20-day average, typical of a pre-event waiting phase.
Intermediate Dynamics (4H): Triple Top, Momentum Turning
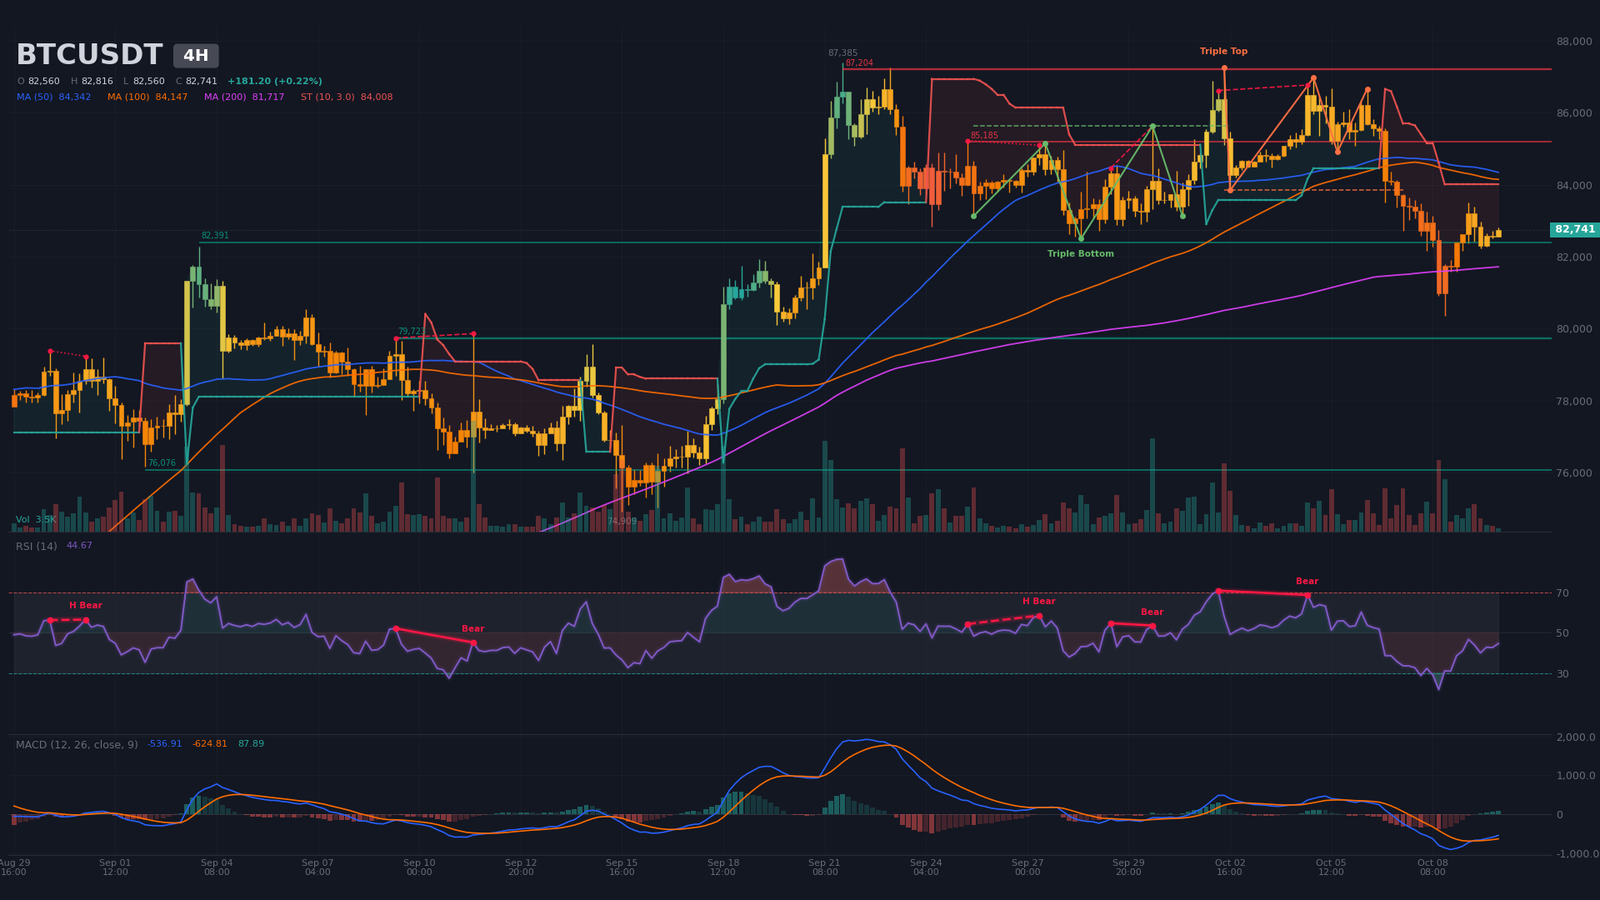
On the 4-hour, fragility is confirmed: a triple top (87,250 / 86,976 / 86,665) has been confirmed bearish by chartimg, with a neckline at $83,842 and a last pivot dated October 6 at 12:00. The algorithmic target is $80,720, barely $2,000 below the current price. Price has already broken below the SMA20 ($82,790), the SMA50 ($84,342), and the SuperTrend ($84,008), which is now bearish. The SMA200 at $81,717 is the last bullish horizon on this timeframe.
The 4H MACD remains below zero but has just crossed bullishly on October 9 at 12:00 (4 candles), with a positive histogram at +88 and expanding — the only technical rebound signal on this timeframe, to be set against a regular bearish divergence detected from October 2 to 4 (price 86,617→86,770, RSI 70.9→68.8) that confirmed the triple top. The structure is therefore bearish with a short-term technical rebound; the RSI14 at 44.7 is neutral-weak, neither oversold nor clearly rebounding. 4H volume at 14% of the 20-day average betrays no buying conviction.
Intraday Structure (15m): Triangle Compression Resolved to the Upside
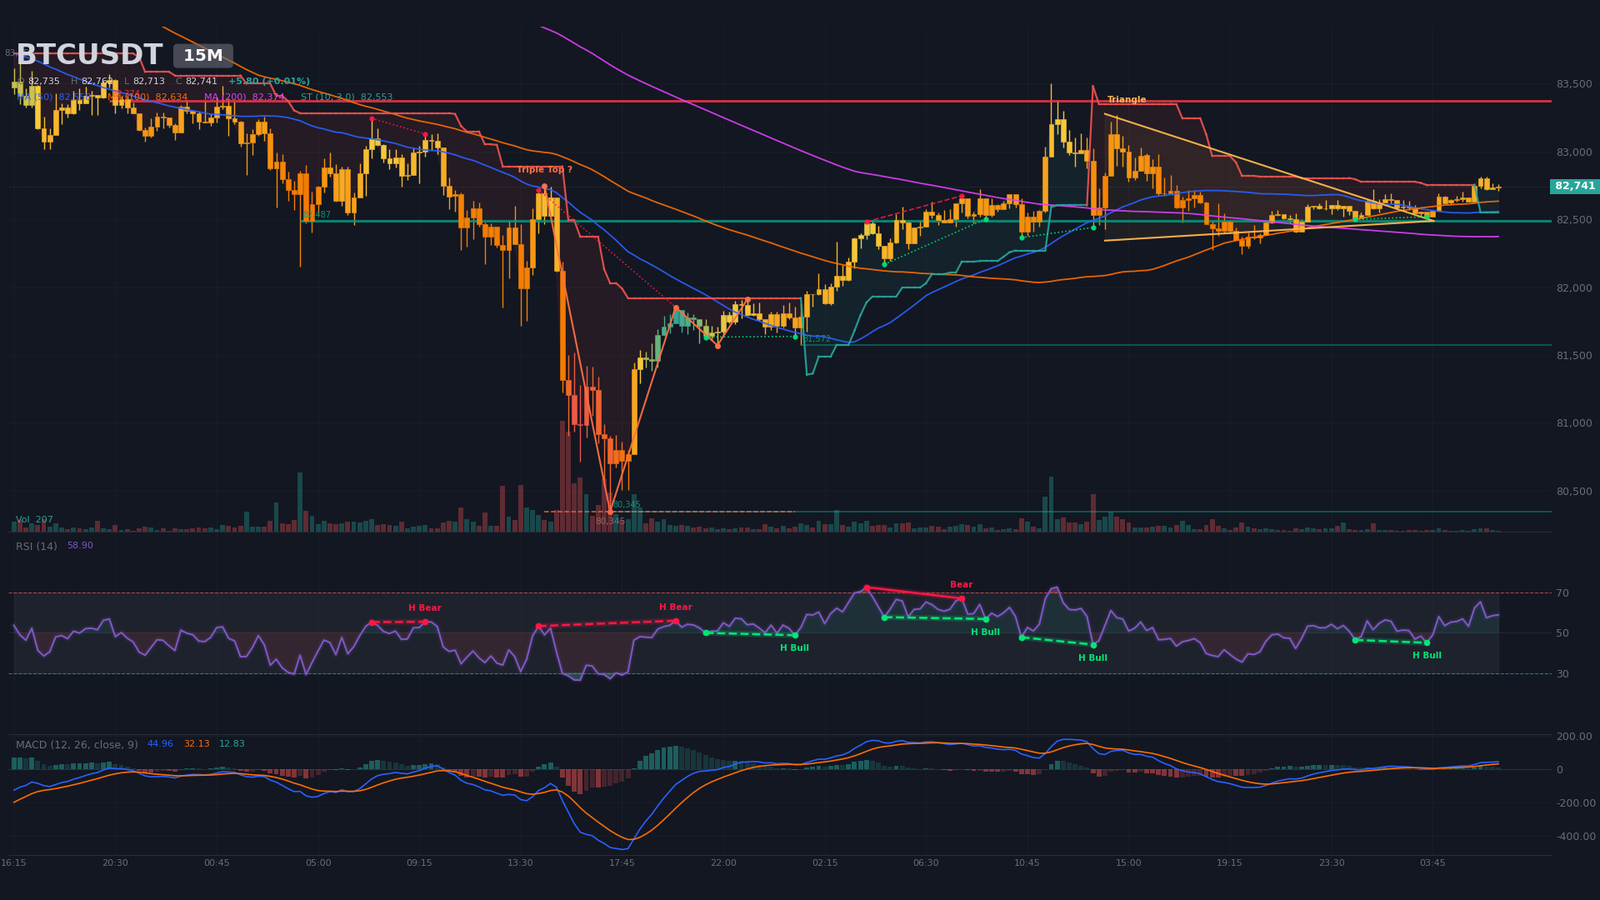
The 15-minute chart shows a short-term bullish structure, breaking out of a symmetrical triangle whose apex was estimated at 03:45 on October 10; the upper boundary was 82,505, the lower 82,486 — the breakout was to the upside, and the 15m SuperTrend flipped bullish at $82,553. Price trades above all three SMAs (20/50/200 at 82,643 / 82,558 / 82,374) and the RSI14 at 58.9 stays neutral with a buy tilt after a series of hidden bullish continuation divergences detected on October 9 and 10 (price 82,168→82,504 with RSI 57.8→56.9; price 82,500→82,520 with RSI 46.5→45.1). The immediate structure is a 82,487 – 82,765 range, with sell walls at 82,765 and 82,814 and buy walls at 82,717 and 82,668. The 15m ATR14 is $75 (0.09% of price), evidence of extreme compression typical of a pre-breakout setup.
Multi-Timeframe Synthesis
| Timeframe | Dominant Trend | RSI (14) | MACD | Chart Pattern |
|---|---|---|---|---|
| Daily (1D) | Bearish (post-top consolidation) | ~51 | Bearish cross, negative hist. | Double top confirmed, neckline 82,500 |
| 4 hours (4H) | Bearish | ~45 | Recent bullish cross, below zero | Triple top confirmed, target 80,720 |
| 15 minutes | Bullish (rebound) | ~59 | Bullish cross, positive hist. | Symmetrical triangle resolved to the upside |
Technical Levels and Pivot Map
The mapping combines classic daily pivots (base = October 9 candle), chartimg-detected swings across all three timeframes, liquidity concentrations (Binance order walls and estimated liquidation pockets), and extensions of the daily double top algorithmic target — the 87,385 → 82,500 = 4,885 amplitude projected below the neckline, i.e. 77,615 – 77,683. The central short-term pivot is $82,550 (Daily P), an indecision zone shared with the H4 P ($82,594) and the M15 P ($82,741).
| Level | Price (USD) | Category | Technical Basis |
|---|---|---|---|
| R3 | 86,800 – 87,400 | Major resistance | Sept 21 swing high (87,385) + chartimg resistance 87,204 (3 H4 contacts) + estimated short liquidation peak 87,256 – 87,838 ($123M) |
| R2 | 85,150 – 85,250 | Intermediate resistance | chartimg H4 resistance (85,185, 2 contacts) — former H4 triple bottom |
| R1 | 83,800 – 84,000 | Immediate resistance | 4H bearish SuperTrend (84,008) / Daily SMA50 (84,353), Daily R1 pivot |
| P | 82,500 – 82,750 | Central pivot | Daily double top neckline (82,500) + Daily/H4 P + Binance buy/sell walls in 82,717 – 82,765 zone |
| S1 | 80,700 – 81,000 | Immediate support | Daily SMA50 (80,789) + 4H triple top target (80,720) + long liquidation pocket 79,488 – 79,634 ($24M) |
| S2 | 79,400 – 79,700 | Major support | chartimg H4 support (79,723, 3 contacts) + implied daily cup-and-handle target at 50d MA (80,550) |
| S3 | 77,500 – 78,100 | Major support 3 | Daily double top algorithmic target (77,683) + long liquidation pocket 77,838 – 78,080 ($21M) + Sept 15 low (74,909) above |
Order Book and Liquidity Heatmap
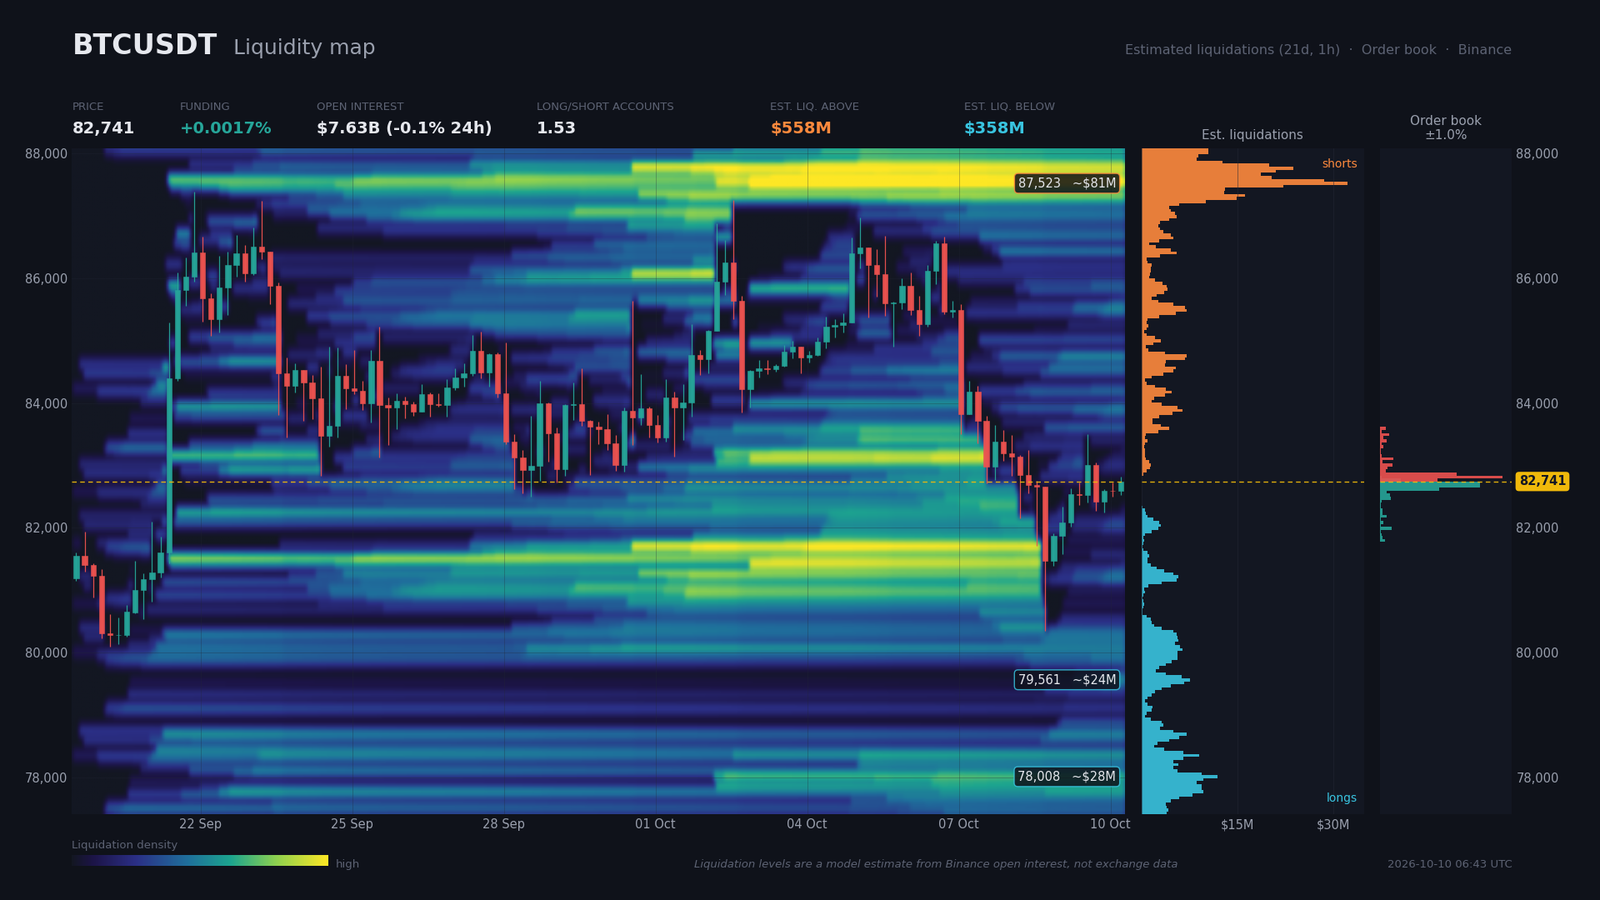
Binance order book coverage is only 1.04% around the mid: only the 82,619 – 82,863 bounds are actually visible, beyond which one must rely on estimated liquidation pockets. Buy walls cluster at $82,717 ($19.1M) and $82,668 ($19.2M), sell walls at $82,814 ($23.5M) and $82,862 ($14.7M) — a narrow 0.2% corridor, typical of a « price magnet » that traps spot before a breakout. Aggregate imbalance remains neutral (+2.2% in favor of bids).
On the derivatives side, funding at 0.0017% (annualized 1.8%) is abnormally low: there is neither a long nor a short queue, the market is short-term neutral. Open interest at $7.63B is down 0.08% over 24h and 7.45% over 7 days — last week’s leverage purge is largely complete, which reduces the risk of a bearish cascade of the October 10, 2025 type. Long/short ratios remain structurally buyer-biased: global 1.534, top traders 1.619, taker buy/sell 1.042 — spot accounts lean buyer but takers are at equilibrium, a cautious read.
Estimated liquidation pockets above total $557M, including a dense cluster between $87,256 and $87,838 ($140M across three bands, peak at $87,766). Below, $358M with the closest pockets at $79,488 – 79,634 ($24.1M) and $77,837 – 78,080 ($21.5M). Consequence: the risk of a liquidity sweep is more likely to the downside than the upside — the short liquidity magnet sits at $87,400 (distant), the long liquidity magnet is dense at $79,500 – 78,000 (close); a short squeeze first, then a stop sweep below $80,700 is the microstructure scenario consistent with the H4 patterns.
Calendar: Catalysts to Watch
Four macroeconomic events structure the week ahead. The pivot of the week is unquestionably the US CPI on Wednesday, October 14 — a core month-over-month print in line with consensus (0.2%) would maintain the current compression, while a core ≥ 0.3% would revive the stagflation scenario and amplify the $79,500 – $80,700 target.
- Wednesday, October 14, 03:30 (Zurich) — China CPI YoY: consensus 1.1% (previous 0.8%). A hawkish surprise would weigh on global risk-on.
- Wednesday, October 14, 10:30 (Zurich) — ECB Christine Lagarde speech: dovish tone expected, indirect BTC support via euro weakness.
- Wednesday, October 14, 14:30 (Zurich) — US Core CPI m/m: consensus 0.2% (previous 0.3%). Major catalyst for BTC.
- Wednesday, October 14, 14:30 (Zurich) — US CPI m/m: same window, same stakes.
- Thursday, October 15, 14:30 (Zurich) — US PPI m/m: consensus 0.5% (previous 0.4%), and core group retail sales m/m: consensus 0.5% (previous 1.4%). If sales confirm a consumer cooldown, the Fed pivot comes closer — potential BTC support.
Three Scenarios for the Coming Weeks
The technical configuration leaves room for three distinct trajectories, whose probabilities adjust to the October 14 CPI verdict and ETF flow evolution. The median scenario is bearish, consistent with the daily and 4H structure.
Scenario A — Bearish Rejection from the Neckline (probability 50%)
Selling pressure at 83,800 – 84,000 (4H SuperTrend, Daily SMA20) rejects price; a 4H close break below $82,200 triggers acceleration toward $80,700 – $81,000 (4H triple top target and Daily SMA50), then toward $79,400 – $79,700 ($24M long liquidation pocket). Catalyst: a core CPI ≥ 0.3% on October 14. Execution zone: 82,300 – 82,700. Invalidation: daily close above $84,400 (SMA20). Ideal stop at $83,900 (≈ 1.5×ATR14 daily = $3,180) — R:R ≈ 2.0 toward the $79,500 target.
Scenario B — Liquidation Range $79,500 – $83,800 (probability 30%)
Without a strong macro catalyst, price remains trapped in the band: post-CPI compression, hesitation between the daily neckline ($82,500) and the 4H target ($80,720), with a magnet toward the central pivot $82,750 at the middle of the range. Execution zone: 82,500 – 82,800 (mid-range). Invalidation: confirmed break via consecutive 4H closes outside [80,700; 83,800]. Stop at 1×ATR14 4H = $750 on each side — neutral R:R (range strategy).
Scenario C — Short Squeeze Toward $85,200 – $87,400 (probability 20%)
A core CPI ≤ 0.1% opens a Fed pivot, funding flips heavily positive, short squeeze toward the estimated shorts at $87,400 ($557M total). Recovery of the daily SMA20 ($84,350), 4H resistance $85,185, daily R3 86,800 – 87,400. Catalyst: lower-than-expected CPI on October 14. Execution zone: breakout above $84,100 with volume. Invalidation: return below $82,500 daily with close. Stop at $81,600 (Daily S1, ≈ 2.5×ATR14 daily) — R:R ≈ 1.8 toward $85,200.
Summary and Conclusion
Bitcoin has entered a decision phase at the intersection of two bearish daily and 4H chart patterns, in a macro environment pinched by Iran/oil risk and persistent ETF outflows. Derivatives flows (OI falling, flat funding) suggest the market is not oversold but rather « lying on the neckline »: price is in unstable equilibrium. The liquidation map tilts clearly toward a downside sweep: the short magnet sits at $87,400 ($557M, distant), the long magnet at $79,500 – 78,000 (close, dense).
The dominant strategy remains bearish as long as $84,000 (4H SuperTrend) is not reclaimed on a 4H close, with a primary target of $79,500 – $80,700 that intersects both the triple top algorithmic target, the Daily SMA50, and the closest long liquidation pocket — a level that would converge institutional flows (ETF buyers) and liquidation tourism. The four-day catalyst is the US CPI on Wednesday, October 14 at 14:30: a core ≤ 0.2% would maintain compression, a core ≥ 0.3% would activate Scenario A with a $79,500 target by week’s close.
Sources
- Bitcoin ETFs Bleed Nearly $500 Million in One Day: Crypto Daily — CoinDesk, October 8, 2026
- Bitcoin ETFs Shed $729M in Two Days as Investors Reverse Course — Bitcoin Magazine, October 9, 2026
- Will the Crypto Market Repeat 10-10? Here’s What the Data Says — Yahoo Finance, October 7, 2026
- French yields are near levels not seen since 2002. Why that could give U.S. Treasurys a boost — CNBC, October 9, 2026
- Cramer’s week ahead: Earnings kick off as banks and chipmakers face big tests — CNBC, October 9, 2026
- Junk bonds are ‘flashing yellow.’ Watch these warning signs — CNBC, October 9, 2026
- US plans to seize $1B in crypto linked to Iran this week: Scott Bessent — Cointelegraph, October 9, 2026
- ‘We Know Where It Is’: Treasury Secretary Threatens To Freeze $1B of Iran’s Crypto — Bitcoin Magazine, October 9, 2026
- Bitcoin Rebounds After Rough Week, But Traders Are Pricing In More Downside — Decrypt, October 9, 2026
- Bitcoin consolidates near $82.5K as crypto weathers Ledger theft reports — Cointelegraph, October 9, 2026
- Bitcoin Life Insurer Meanwhile Raises $37.5M as Wealthy Families Look to Pass On Their BTC — Bitcoin Magazine, October 10, 2026
- Tokenization could unleash tens of billions of dollars in trapped capital, Nasdaq CEO says — CNBC, October 9, 2026
- SEC Targets Crypto Custody Rules in Major Regulatory Shift — Investing.com, October 2, 2026
- Ava Labs explores backup cryptography as Sirer flags AI security risks — Crypto Briefing, October 9, 2026
- FOMC meeting calendars and minutes — Federal Reserve Board, October 7, 2026
Disclaimer: This article is for educational and informational purposes only. It does not constitute investment advice, a recommendation to buy or sell, or an invitation to trade any financial asset. Cryptocurrency markets are extremely volatile; any investment decision should be based on your own research (DYOR) and, where appropriate, the advice of a licensed financial adviser.

