


Ethereum trades at $2,680.8 on October 3, 2026, up 0.5% on the current daily candle but down 4.5% from the 20-day high of $2,806.8 set on September 21. Since the September 28 low at $2,634, price has rebounded 1.8% inside a tightening compression structure, with the market waiting for a directional catalyst. The prevailing phase is consolidation below major resistance, where the structural daily trend remains bullish but the intermediate momentum has clearly rolled over.
The dominant event in the tape is the crypto market’s reaction to the prior session’s Bitcoin rally. BTC tagged $87,000 on October 2 before reversing sharply below $84,000, triggering close to $600M in liquidations, including roughly $210M across the broader crypto complex according to CryptoPotato and Cointelegraph (October 3). That intraday risk-off impulse, layered with a 24h taker buy/sell ratio of 0.857 on Ethereum, signals net sell pressure on spot books. ETH open interest fell 4.3% over 24 hours to $6.24B while still rising 2.45% on a seven-day basis, a textbook deleveraging pattern within a still-positive underlying trend. The funding rate at 0.0025% remains neutral and does not skew the market.
On the macro side, the October 2 NFP report landed like a bomb: only 29,000 non-farm payrolls versus 90,000 consensus and 133,000 previously, with the unemployment rate ticking up to 4.2% from 4.1% expected (MarketWatch, October 3). The sharp miss rekindles Fed pause bets, but Treasury yields remain pinned near generational highs, a reminder that inflation and debt service pressures are still in play. The September 30 core PCE m/m print came in at 0.3% versus 0.4% expected, marginally cooler, while the October 2 Eurozone flash inflation surprised to the upside at 3.8% versus 3.6%, complicating the read for the ECB. On the asset, two headlines polarize: the launch of zkAPI on the Ethereum mainnet (October 1, Decrypt, The Block) reinforces the « Ethereum as the settlement layer for AI » narrative, while the shutdown of Layer-2 Blast (October 2, The Block, Decrypt) — TVL collapsing from $2.3B to near zero — and the withdrawal of EIP-8363 weigh on the technical leg of the story.
This sets up an ambiguous technical backdrop: the daily structure remains supportive but the H4 momentum has flipped, and the microstructure is pulling price toward the lower liquidation pockets. Before arbitrating between the three scenarios that close this Ethereum technical analysis, each timeframe deserves to be unpacked.
Multi-Timeframe Technical Analysis
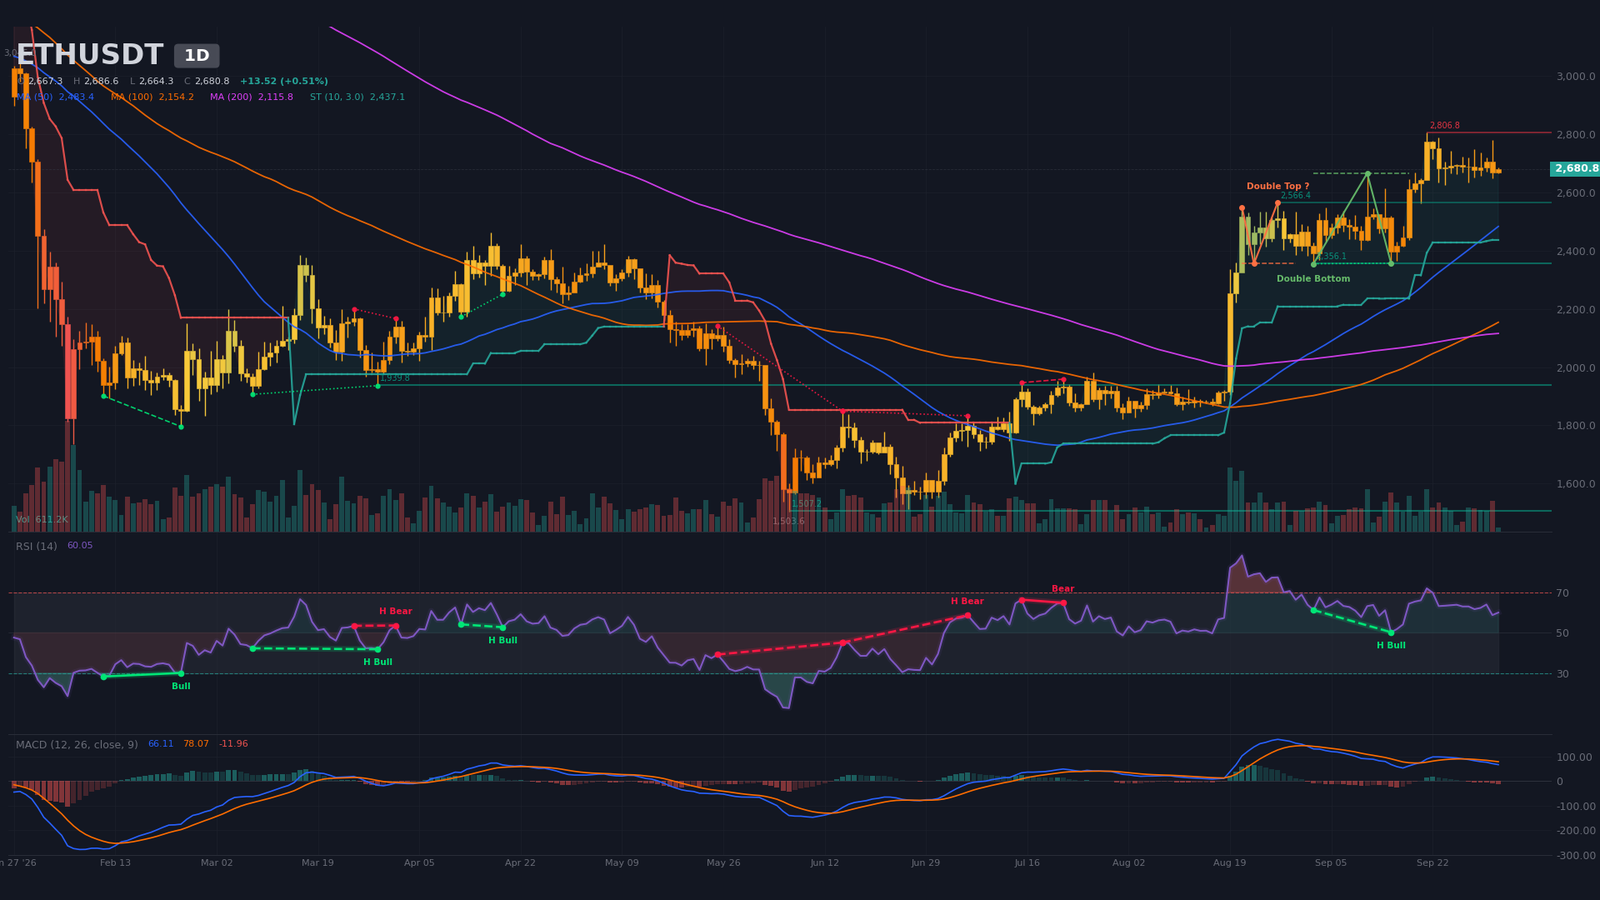
Daily Timeframe (1D): post-double-bottom recovery confirmed, consolidation below $2,807
The daily trend stays bullish in a consolidation phase. Price at $2,680.8 holds above all three SMAs — SMA 20 at $2,636.7, SMA 50 at $2,483.4, SMA 200 at $2,115.8 — and the daily SuperTrend remains in buy mode at $2,437.1. The August 31, 2026 bullish 50/200 SMA crossover validates a favorable structural regime: the long-term averages flipped 33 candles ago and the underlying trend has not been threatened since. The pattern-detection algorithm confirmed a bullish double bottom between $2,355.1 (September 2) and $2,357 (September 15), neckline at $2,666, and algorithmic target at $2,975.9 — a level sitting 11% above current price.
RSI 14 around 60 stays neutral, with no fresh divergence; the prior eight readings between 58.8 and 64.0 describe a plateau without excess, the fingerprint of digestion after the bullish impulse. MACD sits above zero (line 66.1; signal 78.1) but printed a bearish crossover on September 28 — the negative histogram at -12.0 flags impulse exhaustion. Volume tells the same story: 611,184, or 16.7% of the 20-period average (3,653,332), argues against an imminent impulse. The September 21 swing high at $2,806.8 remains the reference resistance, with a single-touch algorithmic detector. The daily structure argues for neutral-to-mildly-bullish consolidation below $2,807.
Intermediate Dynamics (4H): confirmed double top and bearish momentum
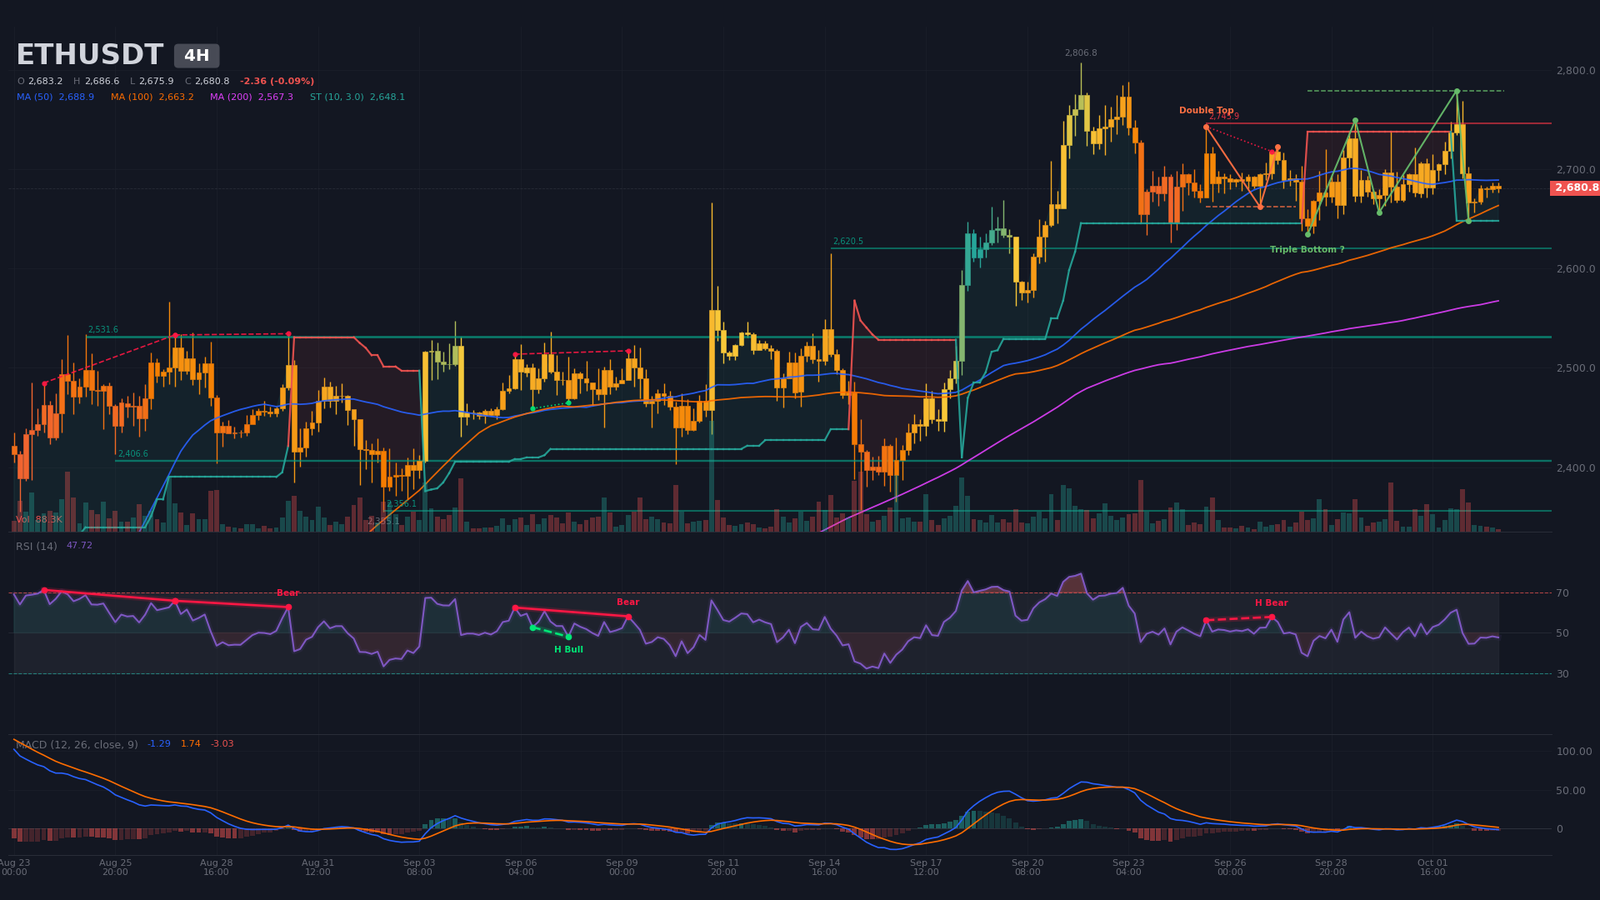
On the 4-hour chart the bias flips decisively. The algorithm detected a confirmed bearish double top between $2,749.2 (September 29) and $2,779 (October 2), neckline at $2,662, and algorithmic target at $2,591.5 — 3.3% below current price. Price trades below the SMA 20 ($2,692.5) and SMA 50 ($2,688.9), a confirmed bearish cross, while holding above the SMA 200 ($2,567.3). MACD dropped below zero with a bearish crossover on October 2 at 16:00, five candles ago, and the histogram at -3.03 is expanding. RSI 14 around 48 is neutral and rolling over from 61.4 on October 2; a hidden bearish divergence (September 25-27, price $2,742.7 → $2,717.6, RSI 56.3 → 57.9) confirms the loss of momentum.
The 4H SuperTrend stays bullish at $2,648.1, the last line of defense before a bearish invalidation. The 4H resistance at $2,745.9 (two touches) coincides with the September 29 swing high; the 4H support at $2,620.5 (two touches) precedes the major support at $2,531.6 (four touches). 4H volume is also anemic: 88,284, or 15.6% of the average. The 4H structure is incompatible with an immediate bullish impulse: any rebound will stall in the $2,745-$2,779 zone.
Intraday Structure (15m): symmetrical wedge and compression around the pivot
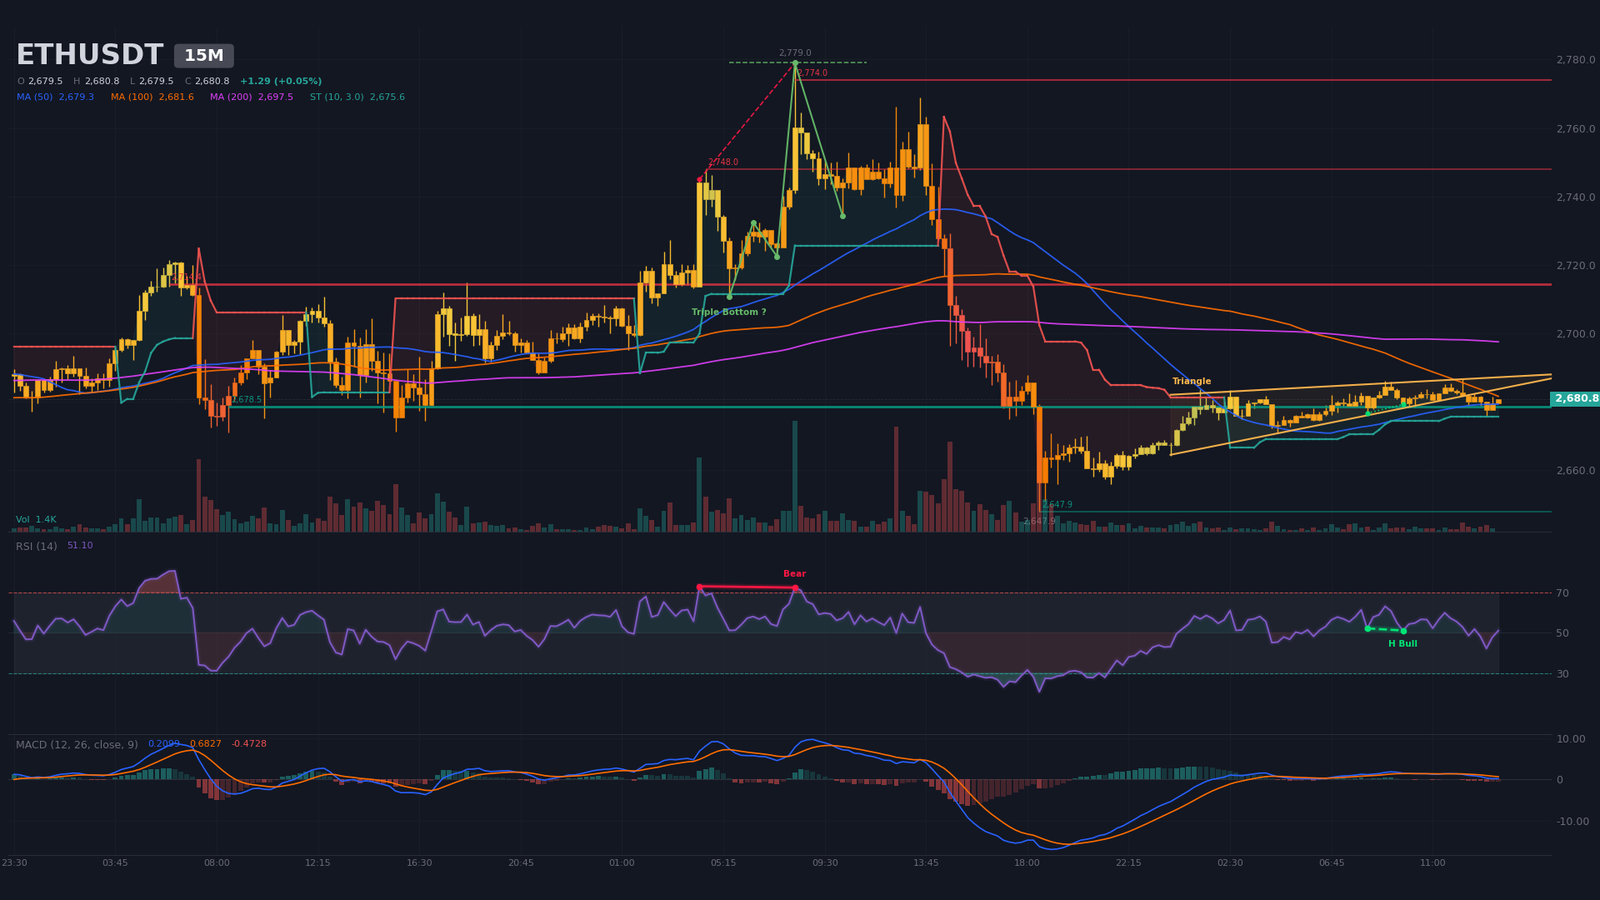
On the 15-minute chart, the structure is neutral in compression. The algorithm detected a symmetrical wedge between $2,681.6 (lower bound) and $2,686.6 (upper bound), starting October 3 at 00:00, last pivot at 12:15, with the apex estimated at 17:07 today — a directional breakout is therefore imminent. RSI 14 around 51 is neutral; the intraday swings (high at $2,686.6 at 12:15; low at $2,671 at 04:30) carve out a 15-dollar range. The 15m MACD printed a bearish crossover at 12:00, seven candles ago, with a negative histogram at -0.47 still above zero.
The 15m support at $2,678.5, tested six times since October 1, is the lower-bound key; resistance at $2,714.4 (four touches) is the first target on a break. The 15m SuperTrend bullish at $2,675.6 protects the buyer scenario as long as it holds. The execution window is contained in $2,671-$2,686: a break above $2,686.6 would invalidate the wedge and open $2,714; a break below $2,671.5 would re-expose $2,647.9.
Multi-Timeframe Synthesis
Reading the three timeframes together reveals a clean directional conflict: the daily structure keeps its buyer bias, the 4H has rolled over to the downside, and the 15m is in compression. The short-term central pivot sits in the $2,680-$2,698 zone.
| Timeframe | Dominant trend | RSI (14) | MACD | Chart pattern |
|---|---|---|---|---|
| Daily (1D) | Bullish (consolidation) | ~60 | Bearish cross on 09/28, histogram contracting | Confirmed bullish double bottom, target $2,975.9 |
| 4 hours (4H) | Bearish (rejection) | ~48 | Bearish cross on 10/02, below zero | Confirmed bearish double top, target $2,591.5 |
| 15 minutes | Neutral (compression) | ~51 | Bearish cross on 10/03 12:00, contracting | Symmetrical wedge, apex 17:07 |
Mapping of Technical Levels and Pivots
The methodology combines classic daily pivots, algorithmically detected supports and resistances, pattern-target extensions and confluences with the estimated liquidation pockets. The short-term central pivot sits at $2,680-$2,698 (current price $2,680.8 paired with the daily R1 pivot at $2,698.1). R1 resistance at $2,745-$2,750 stacks three confluences: the 4H resistance at $2,745.9 (two touches), the daily swing high at $2,749.2 from September 29 and the daily R1 pivot at $2,748.2. On the downside, S1 at $2,660-$2,678 aligns the 4H double-top neckline ($2,662), the 15m support ($2,678.5) and the 15m SuperTrend ($2,675.6). S2 at $2,600-$2,620 layers the 4H support ($2,620.5), the estimated long-liquidation pocket $2,603-$2,630 (~$199M) and the daily S1 pivot ($2,617.1).
| Level | Price (USD) | Category | Technical basis |
|---|---|---|---|
| R3 | $2,940 – $2,952 | Major resistance 3 | Estimated short-liquidation pocket $2,934.7-$2,951.7, peak $2,950, ~$97M |
| R2 | $2,805 – $2,829 | Major resistance 2 | Daily swing high $2,806.8 (09/21) + daily R2 pivot $2,829.2 + liquidation pocket $2,812-$2,823 (~$80M) |
| R1 | $2,745 – $2,750 | Immediate resistance | 4H resistance $2,745.9 (2 touches) + daily swing high $2,749.2 (09/29) + daily R1 pivot $2,748.2 + sell wall $2,750.2 ($2.85M) |
| P | $2,680 – $2,698 | Central pivot | Current price $2,680.8 + daily pivot $2,698.1 + daily SMA20 $2,636.7 + 15m pivot $2,679.5 |
| S1 | $2,660 – $2,678 | Immediate support | 4H double-top neckline $2,662 + 15m support $2,678.5 (6 touches) + 15m SuperTrend $2,675.6 |
| S2 | $2,600 – $2,620 | Major support 2 | 4H support $2,620.5 (2 touches) + long-liquidation pocket $2,603-$2,630, peak $2,621.6, ~$199M + daily S1 pivot $2,617.1 |
| S3 | $2,530 – $2,567 | Major support 3 | 4H support $2,531.6 (4 touches) + daily S2 pivot $2,567 + extended liquidation pocket $2,420-$2,464 (~$254M) |
Order Book and Liquidity Heatmap
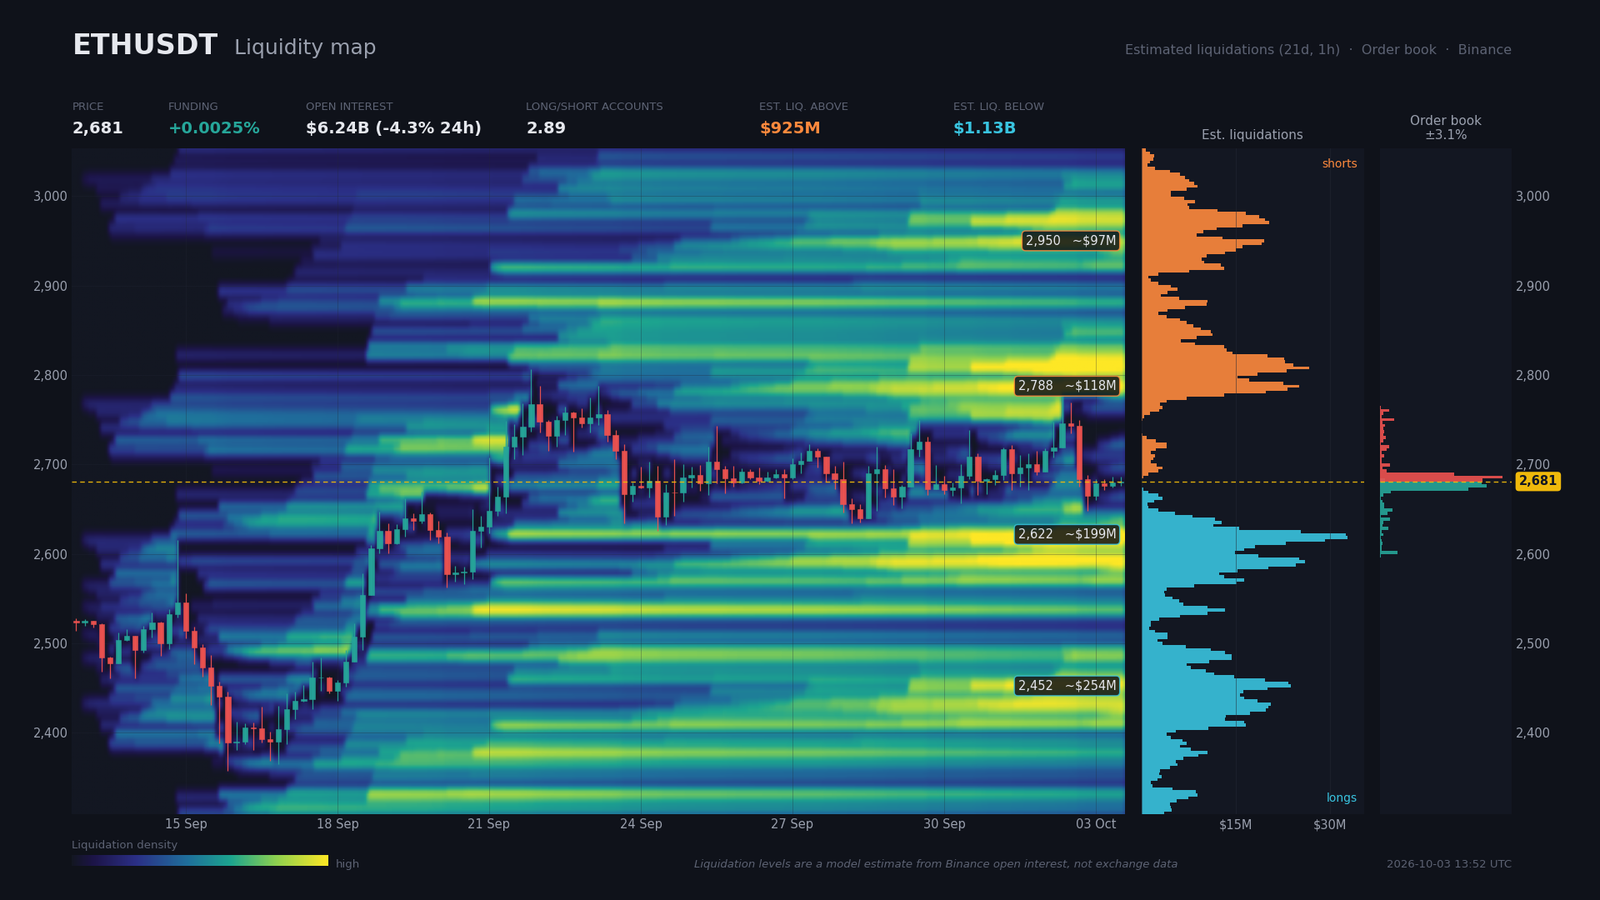
The Binance order book (3.06% coverage) is balanced with a mild buyer edge: $75.9M of bids within ±2% versus $72.4M of asks, a +2.4% bid-side imbalance. Buy walls cluster at $2,679.1 ($20.9M, -0.06%), $2,675.7 ($22.0M, -0.19%) and $2,672.4 ($18.1M, -0.32%) — a dense rampart under price. Sell walls sit at $2,682.5 ($21.1M, +0.06%), $2,685.9 ($25.1M, +0.19%) and $2,689.3 ($15.3M, +0.32%) — a tight immediate resistance that is capping the upside of the 15m wedge.
Beyond the spot book, the estimated liquidation pockets draw a marked asymmetry: $925M above (shorts) versus $1,133M below (longs). On the short side, the three pockets are $2,779-$2,796 ($118M, +3.98%), $2,813-$2,823 ($80M, +5.24%) and $2,935-$2,952 ($97M, +10.04%). On the long side, $2,603-$2,630 ($199M, -2.21%), $2,579-$2,600 ($134M, -3.22%) and $2,420-$2,464 ($254M, -8.52%). The global long/short ratio of 2.894 (retail massively long) contrasts with the top traders ratio of 1.577 and a 24h taker buy/sell of 0.857 (net sell pressure). Consequence: the liquidity asymmetry mechanically pulls price lower in a first phase, with a likely liquidity sweep toward $2,620-$2,600, before a potential squeeze materializes if smart money absorbs the selling flow. The downside liquidity-grab risk is the microstructure’s favored short-term scenario.
Calendar: Catalysts to Watch
Three macro events over the next ten days can pull Ethereum out of its compression. The October 7 FOMC Minutes is by far the principal catalyst: a dovish tone would validate the upside range break, a hawkish tone despite the NFP miss would reopen the downside liquidity-grab scenario.
- Monday October 5, 16:00 (Zurich) — ISM Services PMI (consensus 55.7; previous 55.4): a soft print would confirm the slowdown initiated by the October 2 NFP.
- Wednesday October 7, 20:00 (Zurich) — FOMC Minutes: crucial guidance after the NFP miss, volatility expected.
- Friday October 9, 16:00 (Zurich) — Michigan Sentiment Prel (consensus 48.1; previous 48.1): a leading household-confidence gauge, in pessimism territory.
Three Scenarios for the Coming Weeks
The probabilities below integrate the current technical structure, derivatives microstructure and the macro calendar. The daily R1 pivot at $2,698 and the 4H double-top neckline at $2,662 are the two thresholds that sort the scenarios.
Scenario A — Upside break toward $2,745-$2,807 (probability 40%)
Catalyst: dovish FOMC Minutes on October 7 after the October 2 NFP miss. Trigger: 15m break above $2,686.6 with volume, then 4h break above $2,745.9. Path: $2,687 → $2,714 (15m resistance) → $2,745 (R1) → $2,780 (R2, prior 4H top) → $2,807 (daily R2 target). The daily double-bottom algorithmic target at $2,975.9 stays in play over a 4-6 week horizon. Execution zone: $2,682-$2,690 (buy on retest of the break). Invalidation: close back below $2,678.5 on the 15m. Stop: $2,660 (below S1), roughly $22 of risk, equal to 0.7× the 4H ATR ($31.8), for a R:R of about 3.2 toward the $2,780 target.
Scenario B — Liquidity sweep then rebound (probability 35%)
Catalyst: absence of a positive catalyst, taker-sell flow at 0.857, liquidity asymmetry $1.13B below vs $925M above. Trigger: 4h break below $2,662 (double-top neckline). Path: $2,670 → $2,620 (S2, ~$199M liquidation pocket) → test of the $2,600-$2,620 zone → rebound toward $2,680-$2,700. Execution zone: $2,605-$2,620 (buy on absorption). Invalidation: daily close below $2,567 (daily S2 pivot). Stop: $2,540 (below the $2,531.6 pocket), roughly $65 of risk, equal to 0.7× the daily ATR ($88.6), for a R:R of about 1.6 toward $2,700.
Scenario C — Validated bearish break (probability 25%)
Catalyst: soft ISM Services PMI on October 5 paired with a hawkish FOMC Minutes. Trigger: daily close below $2,634 (September 28 low) then below $2,620.5. Path: $2,670 → $2,600 → $2,567 (daily S2) → $2,531 (S3, 4H support with four touches) → $2,591.5 algorithmic target of the 4H double top. Execution zone: sell below $2,620 on a 4h close. Invalidation: return above $2,662 on a 4h close. Stop: $2,700 (~$80 of risk) for a R:R of about 1.7 toward $2,540.
Synthesis and Conclusion
Ethereum sits in a post-impulse consolidation phase. The daily structural trend remains bullish, supported by the confirmed double bottom (target $2,975.9) and the bullish 50/200 SMA crossover of August 31, but the 4H momentum has flipped with a confirmed double top, a MACD that crossed below zero and anemic volume on both sides. The microstructure — neutral funding, OI down 4.3% over 24 hours, taker buy/sell at 0.857, liquidity asymmetry $1.13B below versus $925M above — argues for a prior sweep of the long-side pockets before any directional resolution. The intraday compression (15m wedge, apex 17:07) and the proximity of the October 7 FOMC Minutes create a window of concentrated volatility over the next 24 to 48 hours.
The dominant technical playbook is to avoid chasing the 15m wedge breakout, to lean into rejections from the $2,745-$2,779 seller zones, and to position for a rebound off the $2,600-$2,620 pocket once absorption prints. Daily protection level: $2,567 close, the daily S2 pivot aligned with the 4H SMA 50. As long as that floor holds, the daily range structure remains valid; a clean break would reopen the count of downside objectives toward $2,530 and then $2,420.
Sources
- Ethereum Now Lets You Pay for AI Without Revealing Who You Are — Decrypt, October 2, 2026
- Once a $2.3 Billion Network, Ethereum Layer-2 Blast Is Shutting Down — Decrypt, October 2, 2026
- Paradigm-backed Layer 2 Blast to wind down network as costs exceed revenue — The Block, October 2, 2026
- Ethereum Foundation launches zkAPI to let users pay for AI models without revealing identity — The Block, October 2, 2026
- Ethereum staking reward burn proposal EIP-8363 pulled from Hegota upgrade — The Block, October 1, 2026
- The U.S. jobs market just took a turn for the worse. Or did it? — MarketWatch, October 3, 2026
- As Treasury yields touch generational highs, investors brace for the market fallout — MarketWatch, October 3, 2026
- Dollar gets lift from higher yields — Reuters, October 1, 2026
- Bitcoin’s $87K Rally Was a Trap: Could $82.5K Be the Real Buying Opportunity? — CryptoPotato, October 3, 2026
- Leveraged funds’ Bitcoin futures shorts fall by 5,300 BTC-equivalent as longs shrink — CryptoSlate, October 3, 2026
- SEC Targets Crypto Custody Rules in Major Regulatory Shift — Investing.com, October 2, 2026
- Absa Becomes First African Bank To Custody Bitcoin — Bitcoin Magazine, October 2, 2026
Disclaimer: This article is for educational and informational purposes only. It does not constitute investment advice, a recommendation to buy or sell, or an invitation to trade any financial asset. Cryptocurrency markets are extremely volatile; any investment decision should be based on your own research (DYOR) and, where appropriate, the advice of a licensed financial adviser.

