


Bitcoin is trading at $84,575 on the BTCUSDT pair on October 3, 2026, consolidating after the spike to $87,249 hit intraday on October 2. The -3.2% pullback from that recent high stays contained, and the underlying structure remains tilted to the upside: +1.3% over 5 days, +10.1% over 20 days and +12.9% above the September 15 low at $74,909. The market is digesting its post-NFP surge inside several overlapping compressive chart patterns that intersect on the calendar, between a daily wedge and an intraday compression.
The engine of the move is the October 2 NFP report. Just 29,000 jobs created versus 90,000 consensus and 133,000 prior, with the unemployment rate at 4.2% (consensus 4.1%) and average hourly earnings m/m at 0.3% (consensus 0.32%). Market consensus immediately repriced a Fed pause: the implied probability of a 25 bp hike in October, measured by CME FedWatch, collapsed from 70% to 14%, according to Cointelegraph and Decrypt (October 2). August core PCE m/m at 0.3% versus 0.4% consensus, published the prior day per Decrypt, confirms the disinflationary trajectory. The reaction was symmetric: US yields pulled back, BTC briefly tagged $87,385, then consolidated.
On the institutional side, the golden cross between the SMA30 and the SMA365 triggered for only the sixth time in Bitcoin’s history, per CNBC (October 2). US spot ETF flows stayed positive at +$102M in the October 2 session (Decrypt). On-chain confirms an accumulation phase: wallets holding 100 to 1,000 BTC added 113,950 BTC over 10 weeks (Bitcoin Foundation, September 28). On October 1, 18,894 BTC left exchanges against 13,689 BTC flowing in, a net outflow of 5,204 BTC, +25% above the 7-day average (Swiss Whale Intelligence, October 1). Binance futures open interest slipped -3.57% over 24 hours while still climbing +3.52% over 7 days. Funding is nearly neutral (0.0008%, annualized 0.9%); the global long/short ratio is 1.21 and the top-trader ratio is 2.02. The macro, on-chain and ETF flow backdrop supports the bullish technical signal, but the OI pullback, the taker buy/sell at 0.969 (mild seller dominance) and the proliferation of bearish RSI divergences call for a cautious read.
This research note dissects the technical structure across three complementary timeframes, maps the key levels, reads the order book and proposes three probabilistic scenarios for the weeks ahead.
Multi-Timeframe Technical Analysis
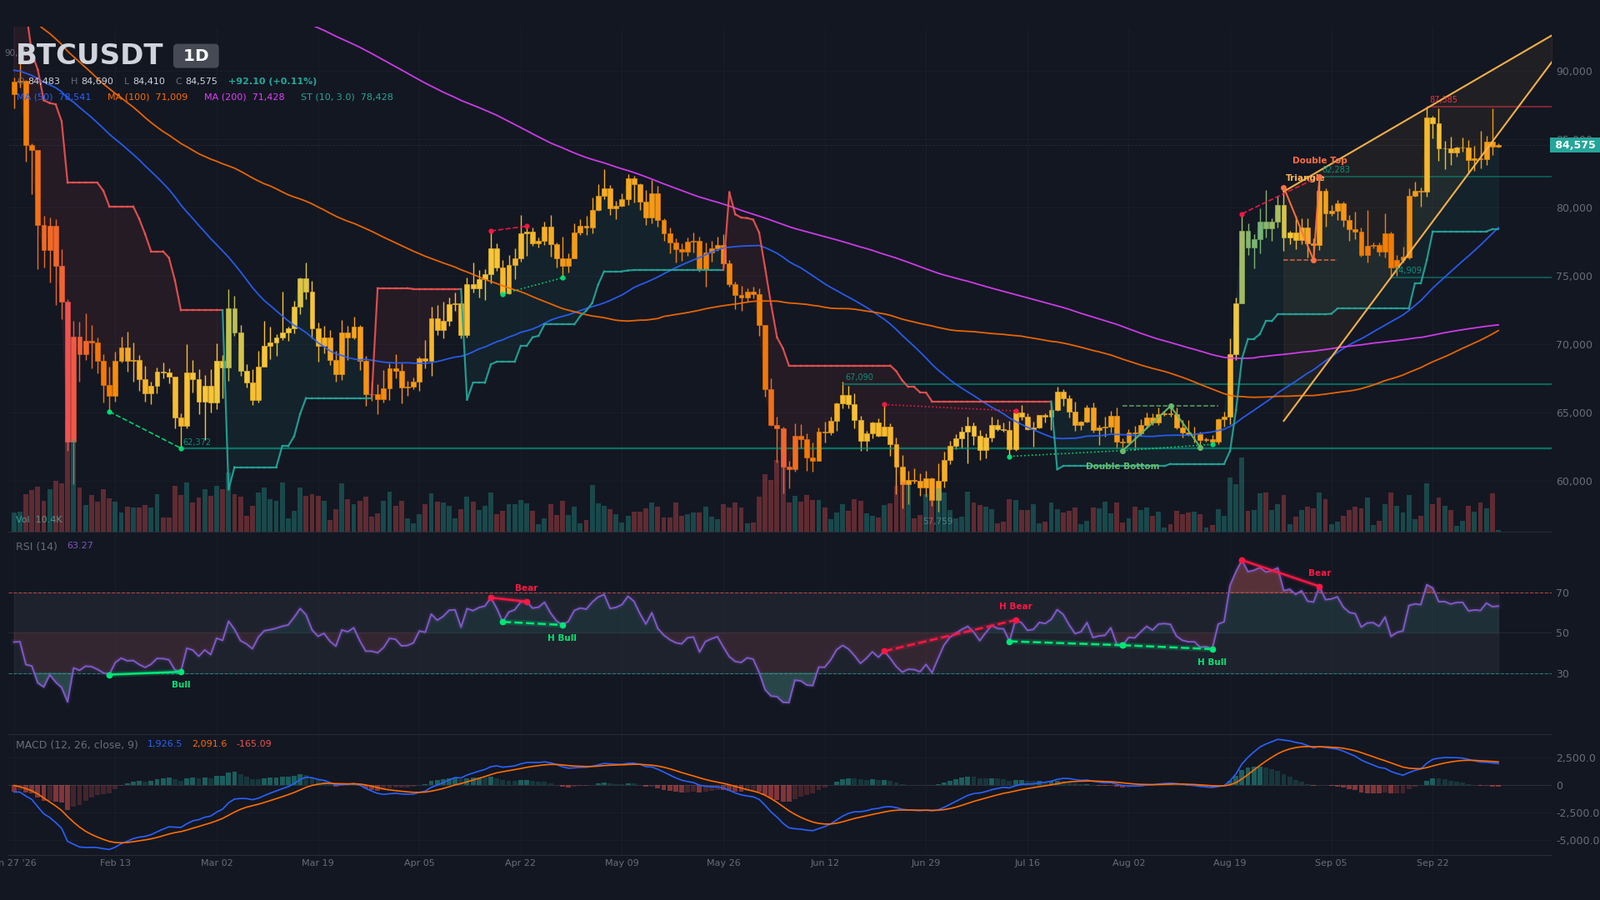
Daily Timeframe (1D): Long-Term Rising Wedge
The dominant structure on the daily chart is a rising wedge, algorithmically detected between August 28 and September 28, bounded by an upper edge at $89,057 and a lower edge at $82,500, with an estimated apex on October 17, 2026 at 21:05. This compression, after an +18.5% impulse from the September 15 low at $74,909, marks a digestion phase under resistance. The price at $84,575 sits above all its moving averages: SMA20 at $82,423, SMA50 at $78,541 and SMA200 at $71,428. The bullish SMA50/SMA200 crossover (daily golden cross) dates from September 8, 2026, a major structural signal now 25 candles old. The RSI(14) around 63 stays neutral-to-bullish, well clear of overbought territory. A bearish double top was also algorithmically confirmed, with a neckline at $76,152 and a target at $70,412 — a level never reached, the structure invalidated de facto by the subsequent rebound. The daily MACD remains above zero, but a bearish crossover printed on September 29 (4 candles), flagging momentum exhaustion. Volume on the current candle (10,373) represents only 6.8% of the 20-period average. As long as the lower edge of the wedge at $82,500 holds, buying pressure stays favored; a clean break would reintroduce downside risk toward $81,000 and then $79,500.
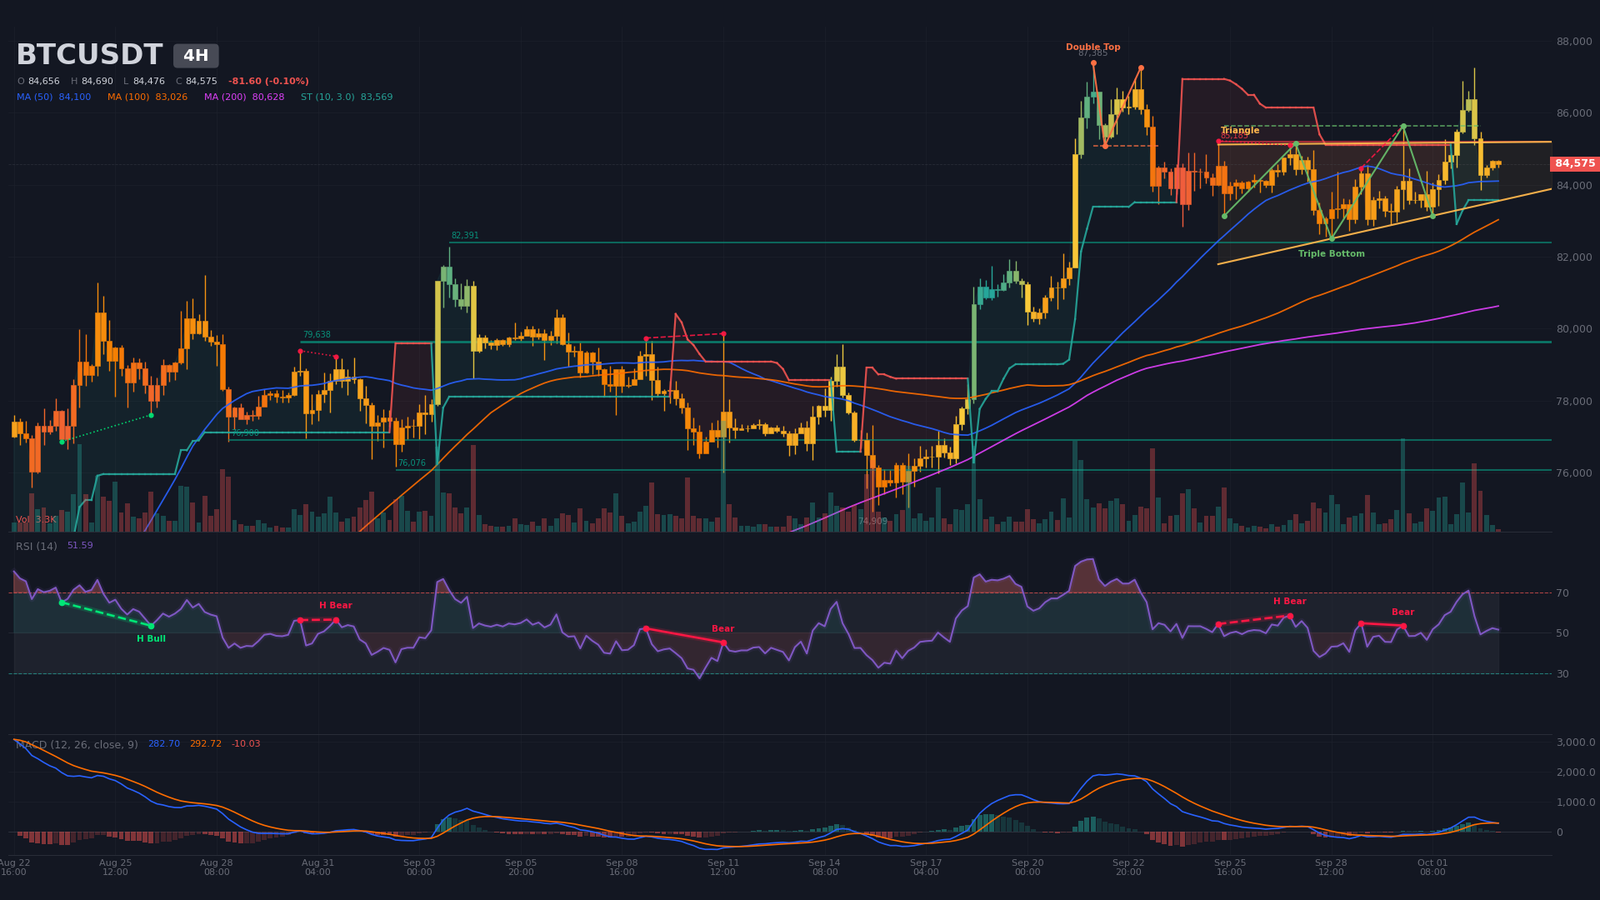
Intermediate Dynamics (4H): Validated Triple Bottom Under Resistance
On the 4-hour chart, the price prints a confirmed bullish triple bottom, with a neckline at $85,633 and a last pivot traced on October 1, delivering a technical objective at $88,343. The pattern unfolds across the $83,136 – $85,633 zone and coexists with a confirmed bearish double top (neckline $85,080, target $82,844), which was partially played out by the September 28 low at $82,500 before being invalidated. The price at $84,575 sits between the two necklines, inside the indecision zone that will dictate the week’s bias. The 4H RSI(14) at 51.6 is neutral after a 60 → 70 → 49 sequence typical of an exhausted rebound. The 4H MACD just printed a bearish crossover on October 3 at 04:00 (current candle), an alert signal. A regular bearish divergence was detected between September 29 and September 30 (price 84,465 → 85,633, RSI 54.77 → 53.64), a negative signal to monitor. The 4H SuperTrend remains bullish at $83,569, the last rampart before a regime flip. As long as that level holds and the $85,633 neckline is not reclaimed on a closing basis, the triple bottom remains the primary working pattern; its invalidation would pull attention back to the $83,100 – $82,500 zone.
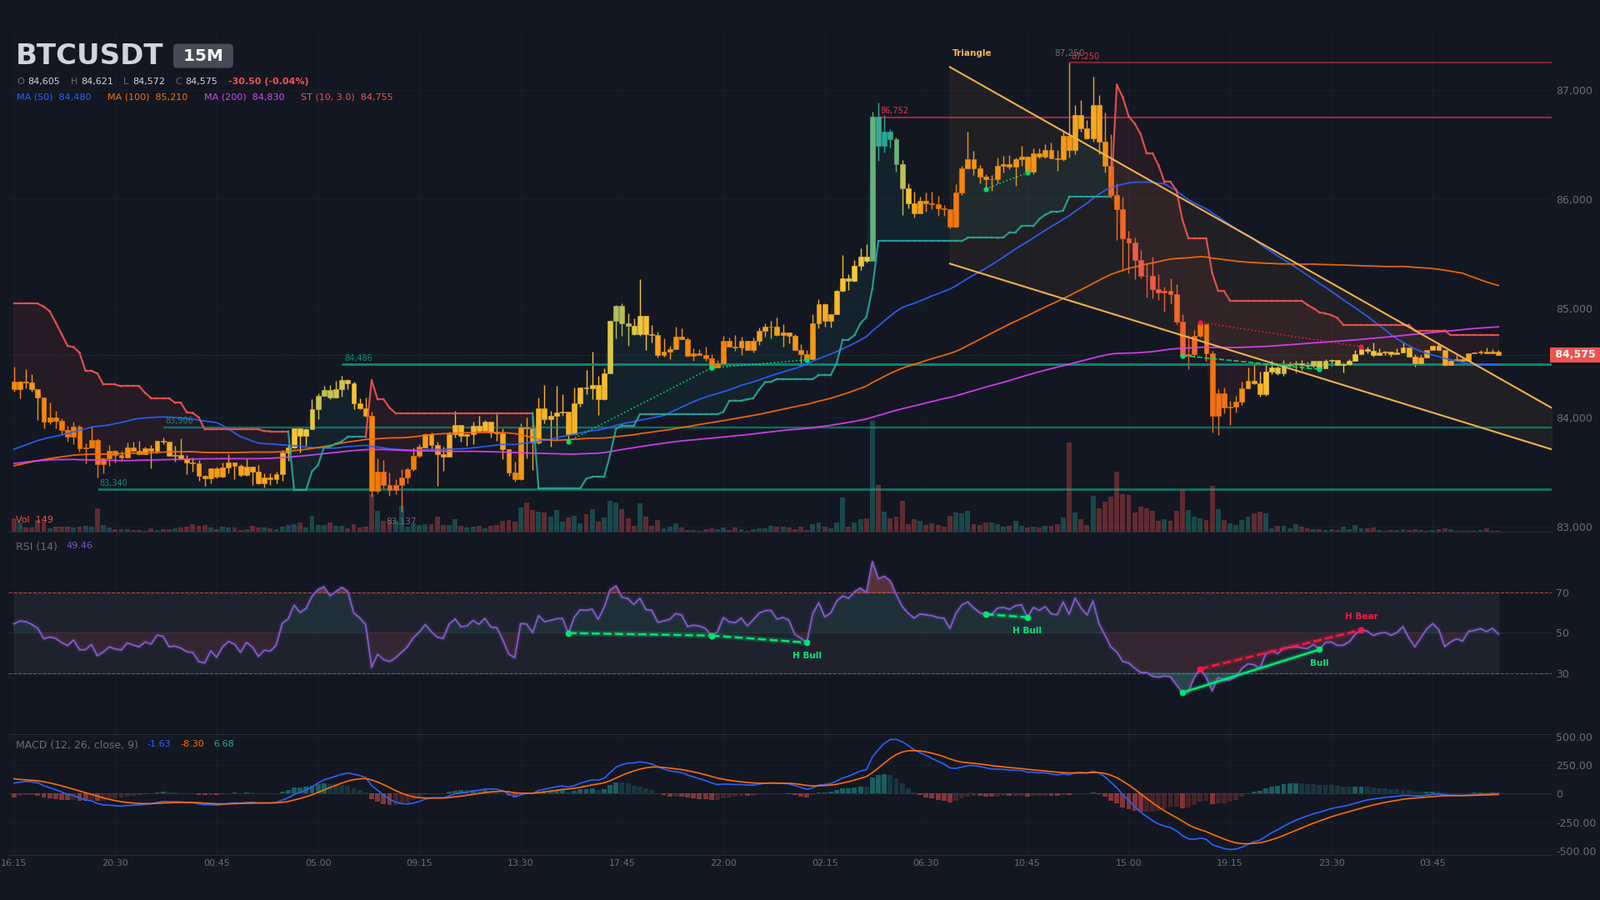
Intraday Structure (15m): Compression Wedge at Apex
The 15-minute structure is a very short-term symmetrical wedge, bounded by $84,674.3 on the upside and $84,027.2 on the downside, with an estimated apex today at 15:29, a few hours after the analysis timestamp. This extreme compression, roughly 0.8% wide, is entering its resolution phase. The RSI(14) at 49.5 is neutral; the last detected divergence is a regular bullish one (September 17, 17:15 → 23:00, price 84,568 → 84,441, RSI 20.4 → 41.8) that has already delivered its rebound effect. The 15m SuperTrend, by contrast, is bearish at $84,754.5, an intraday alert signal that weighs against an upside breakout without a fresh catalyst. The 15m MACD has crossed back bullish (crossover on October 2 at 20:15, 41 candles), but the histogram remains fragile (+6.7). The major 15m support at $84,486.2 has been tested 6 times, making it the immediate tactical pivot: a break would open the door to a quick sweep toward $84,000 and then $83,400. The break of the wedge — up or down — over the next few hours will dictate the session and provide the directional signal that the higher timeframes are waiting for.
Multi-Timeframe Synthesis
The combined read of the three timeframes reveals a bullish underlying structure but a short-term momentum that is fading. The daily chart carries the trend, the 4H confirms the reversal pattern, and the 15m dictates the timing of the next impulse.
| Timeframe | Dominant trend | RSI (14) | MACD | Chart pattern |
|---|---|---|---|---|
| Daily (1D) | Bullish (wedge consolidation) | ~63 | Recent bearish crossover, >0 | Rising wedge (apex 17/10) |
| 4 hours (4H) | Bullish (pullback) | ~52 | Emerging bearish crossover, >0 | Confirmed triple bottom (target $88,343) |
| 15 minutes | Neutral (compression) | ~49 | Fragile bullish crossover, <0 | Symmetrical wedge (apex 15:29) |
Mapping of Technical Levels and Pivots
The method combines multi-timeframe classical pivots, algorithmic swing highs and lows, liquidity concentrations (estimated liquidations and order-book walls) and chart-pattern objectives. The short-term central pivot sits at $84,580, a convergence level between the daily pivot ($85,191 from above), the 4H pivot ($84,585) and the 15m pivot ($84,606). As long as this pivot holds on a 4H closing basis, the consolidation structure stays favored; its loss reintroduces the risk of a test of the daily wedge lower edge at $82,500.
| Level | Price (USD) | Category | Technical basis |
|---|---|---|---|
| R3 | 87,200 – 87,600 | Major resistance | 10/02 high (87,249) + short-liquidation pocket (peak 87,556) + daily resistance 87,385 |
| R2 | 88,300 – 88,600 | Major resistance | 4H triple bottom target (88,343) + short liquidations (89,121 – 89,425) |
| R1 | 85,500 – 85,650 | Immediate resistance | Daily pivot (85,191) + 4H resistance (85,185) + triple-bottom neckline (85,633) |
| P | 84,550 – 84,650 | Central pivot | 4H/15m pivots + daily SMA20 (82,423 from below, resistance) |
| S1 | 83,100 – 83,400 | Immediate support | 10/03 4H low (83,137) + 15m support, 6 touches (83,340) + daily wedge lower edge (82,500) |
| S2 | 81,600 – 82,000 | Major support | 4H support (82,391) + long-liquidation pocket (peak 81,695) + daily SMA50 (78,541 by extension) |
| S3 | 79,500 – 80,000 | Major support | 4H support (79,638, 4 touches) + long liquidations (75,784 – 76,693) |
Order Book and Liquidity Heatmap
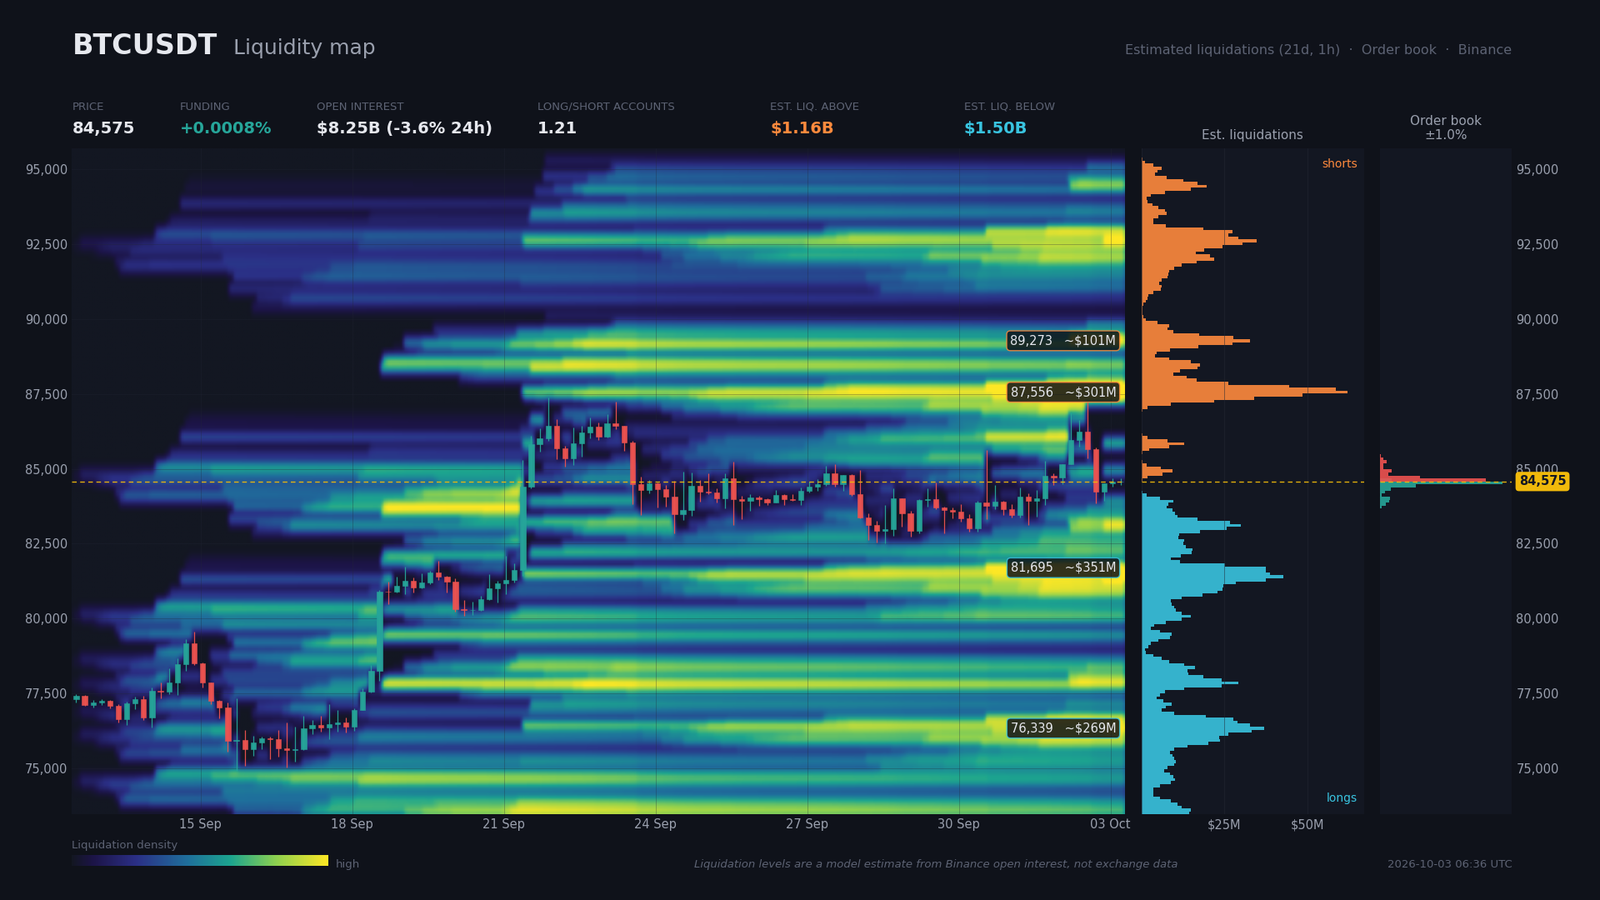
Binance’s visible order book coverage is only 1.04% of price — a strong signal: beyond this narrow band, only model-based estimated liquidations can inform the available liquidity. Inside the visible zone, the buyer imbalance stands at +8.1% (bids $72.4M vs asks $61.6M at ±2%). On the sell side, a wall at $84,625 ($36.3M) followed by $84,726 ($13.5M) blocks the intraday upside; on the buy side, a massive wall at $84,524 ($41.8M) acts as a bearish magnet. The reference price of $84,575 sits +0.06% from the sell wall and -0.06% from the buy wall — a directional squeeze is mechanically probable in the hours ahead.
Model-based estimated liquidations (to be presented as an estimate, not as measured data) total $1.16B above price (shorts) and $1.50B below (longs). The first bearish-magnet pocket is dense between $80,735 and $81,846 (peak $81,695, $351M), followed by $82,857 – $83,261 ($114M). On the upside, the first short cluster is at $87,202 – $87,808 (peak $87,556, $301M). The annualized funding rate at 0.9% points to a non-overheated market; the taker buy/sell at 0.969 reflects a mild seller dominance, consistent with the post-$87,249 pullback. The long/short ratios (global 1.21, top traders 2.02) confirm a long positioning that is not extreme. The dominant risk is a buy-side liquidity sweep toward $82,500 – $82,000 before a rebound, or a short squeeze if $87,250 gives way.
Calendar: Catalysts to Watch
Three high-impact macro events are likely to push Bitcoin out of its wedge structure over the next ten days. The major inflection point remains the FOMC Minutes on October 7, which will deliver the read on the Fed’s internal debate after the NFP shock.
- Monday October 5, 16:00 (Zurich) — ISM Services PMI (consensus 55.7; prior 55.4): a soft print would reinforce the dovish scenario and buying pressure on BTC.
- Wednesday October 7, 20:00 (Zurich) — FOMC Minutes: major inflection point, the read on the Fed’s internal debate post-NFP. An explicitly dovish tone would re-ignite the breakout scenario toward $87,600 and then $88,300.
- Friday October 9, 16:00 (Zurich) — Michigan Sentiment Prel (consensus 48.1; prior 48.1): confirmation or otherwise of the erosion in US household sentiment.
Three Scenarios for the Coming Weeks
The horizon is the next two to three weeks, anchored to the daily wedge apex on October 17 and the FOMC Minutes window on October 7. The probabilities below reflect the current read of the technical structure, momentum and derivatives positioning.
Scenario A — Wedge Bounce (probability 45%)
Trigger: price holds above $84,486 (15m support, 6 touches) and prints a 4H close above $84,580, ideally confirmed by an upside break of the 15m wedge. The expected path brings price to $85,600 (R1, triple-bottom neckline) and, on a follow-through break, to the short-liquidation pocket at $87,200 – $87,600 (R3). The October 7 FOMC catalyst, if it confirms the post-NFP dovish tone, would act as an accelerant. Execution zone: $84,500 – $84,700 on a break of the 15m wedge upper edge. Invalidation: 4H close below $84,000 (break of 15m support at $83,906 and, by extension, of the daily SMA50 at $78,540). Reference stop: $83,350, roughly 1.3 × ATR on the 4H. Estimated R:R of about 2.0 on the R3 target.
Scenario B — Bearish Liquidity Sweep (probability 30%)
Trigger: failure below $84,486 (15m support, 6 touches) and then below $83,906, in a context of bearish 15m SuperTrend, a 4H MACD that has just flipped, and a taker buy/sell below 1. The expected path drives price to $83,100 – $83,400 (S1) and then to the dense long-liquidation pocket at $81,600 – $82,000 (S2, peak at $81,695, $351M), where a buyer rebound is anticipated. Execution zone: $82,500 – $82,800 on a rebound from S2, confirmed by a bullish divergence. Invalidation: break of $80,735 (low end of the long-liquidation pocket). Reference stop: $80,500, roughly 1.5 × ATR on the daily. Estimated R:R of about 1.8 on a rebound toward $84,500.
Scenario C — Bullish Breakout (probability 25%)
Trigger: a daily close above $87,250 combined with FOMC Minutes on October 7 confirming the dovish tone, simultaneously activating the daily wedge break, the 4H triple-bottom target and the short-liquidation cluster. The projected path runs to $88,300 – $88,600 (R2, triple-bottom target) and then $89,100 – $89,400 (short pocket at $89,273). Execution zone: $87,300 – $87,500 on a post-breakout pullback. Invalidation: a return below $85,080 (4H double-top neckline, which would mechanically re-invalidate the triple bottom). Reference stop: $84,750, roughly 1.0 × ATR on the 4H. Estimated R:R of about 2.2 on the $88,400 target.
Synthesis and Conclusion
Bitcoin remains in a post-NFP digestion phase inside a daily rising wedge (apex October 17) and a 15m wedge (apex 15:29 on October 3). The underlying structure stays bullish: golden cross SMA50/SMA200 active since September 8, confirmed 4H triple bottom, whale accumulation of 113,950 BTC over 10 weeks, ETF flows positive at +$102M on October 2, net exchange outflow of 5,204 BTC. But short-term momentum is fading: daily and 4H MACD in bearish crossover, bearish RSI divergences on the 4H, bearish 15m SuperTrend, taker buy/sell at 0.969. The near-term asymmetry leans toward a compression that resolves in a buy-side liquidity sweep between $82,500 and $82,000 before a fresh attempt on $87,200 – $88,400.
The dominant technical strategy is therefore to buy weakness in the $82,500 – $83,400 zone, with a protective stop below $80,735 and an intermediate target at $85,600 then $87,200 – $88,400. As long as $84,580 holds on a 4H closing basis, consolidation stays the primary path; a daily close above $87,250 would reopen the bullish breakout scenario. The central protective level remains $82,500 (daily wedge lower edge) — its loss would invalidate the medium-term bullish framework and force a defensive read.
Sources
- Bitcoin briefly hits $87K as weak US jobs data sends bond yields lower — Cointelegraph, 02/10/2026
- Bitcoin Heads Higher on Macro Moves: Where Does BTC Go Next? — Decrypt, 02/10/2026
- Bitcoin just formed a ‘golden cross’ pattern — CNBC, 02/10/2026
- IMF Praises El Salvador — But Still Tries To Scale Back Its Bitcoin Project — Bitcoin Magazine, 03/10/2026
- South Africa’s Absa Becomes First Bank on the Continent to Custody Bitcoin — Bitcoin Magazine, 02/10/2026
- SEC Crypto Custody Rules Clarify Institutional Digital Asset Holders — The Cryptonomist, 02/10/2026
- BTC Above $84.6K as Whales Rotate 18.9K BTC Off Exchanges — Swiss Whale Intelligence, 01/10/2026
- Bitcoin Whales Are Buying Again: 113,950 BTC Added in 10 Weeks — Bitcoin Foundation, 28/09/2026
- DOJ says it will not reopen criminal probe into former Fed Chair Powell — CNBC, 02/10/2026
- Stocks remain under the thrall of higher yields and higher oil — CNBC, 02/10/2026
- Falling wages, soaring energy prices and inflation — MarketWatch, 02/10/2026
- Blast shuts down $20M layer-2 network — CryptoSlate, 03/10/2026
Disclaimer: This article is for educational and informational purposes only. It does not constitute investment advice, a recommendation to buy or sell, or an invitation to trade any financial asset. Cryptocurrency markets are extremely volatile; any investment decision should be based on your own research (DYOR) and, where appropriate, the advice of a licensed financial adviser.

