


Bitcoin trades at $84,004 on Binance as of the September 29 session, up 0.65% over the previous day but down 3.6% from the local top of $87,385 set on September 21. Over the past seven sessions, price action has printed a sequence of lower highs, characteristic of a digestion phase after the major impulse that originated from the August 14 trough at $62,484. The current consolidation sits inside a contradictory technical environment: the daily structure remains structurally bullish, anchored by a 50/200 golden cross confirmed on September 8, while momentum on the 4-hour chart has rolled over. The drop in open interest (-17.1% over seven days to $7.80B) signals a leverage flush that mechanically lowers the risk of a forced liquidation cascade.
Derivatives positioning remains the dominant driver of the session. The Deribit quarterly expiry on September 25, which settled a meaningful notional of Bitcoin and Ethereum options, was digested without incident but contributed to the leverage purge observed since. Spot funding stands at a moderately positive 0.0068%, equivalent to 7.5% annualized — a non-aggressive bullish bias. The long/short account ratio sits at 1.332 and reaches 1.886 among top traders, a divergence worth interrogating against the recent price weakness. Outside of Bitcoin, institutional flows are tilting toward Solana: Bitwise’s BSOL ETF captures roughly 80% of US SOL spot flows with $948M cumulative, per Crypto Briefing (September 29).
On the macro side, the session is dominated by a risk-off impulse triggered by President Trump’s rejection of Iran’s seven-point plan to reopen the Strait of Hormuz. Brent has pushed back above $100 and US Treasury yields have continued their march higher, costing the Dow Jones more than 300 points and the S&P 500 -0.8% at the close, per CNBC (September 29). This long-end pressure structurally penalizes high-beta assets, Bitcoin included. Counterbalancing this, corporate demand remains robust: Strategy disclosed the purchase of 1,665 BTC for $142.7M and Strive 1,107 BTC for $94.5M at an average price of $85,396, per Bitcoin Magazine and The Block (September 28), absorbing 2,773 BTC for $232.5M in a single week. Regulation is also advancing: Citi and Coinbase launched stablecoin payment rails for institutional clients (Decrypt, September 28), Tether announced it has frozen $550M of Iran-linked USDT this year (Cointelegraph, September 29), and the SEC published its Regulation Crypto Assets proposal in August (SEC.gov, August 18, 2026). The US macro calendar over the next five sessions — JOLTS, Core PCE, GDP, ISM, and NFP — will dictate the range breakout. It is against this precise technical and macro backdrop that the bitcoin technical analysis multiscale read that follows is constructed.
Multi-Timeframe Technical Analysis
Daily Timeframe (1D): Bullish Structure Preserved as Momentum Fades
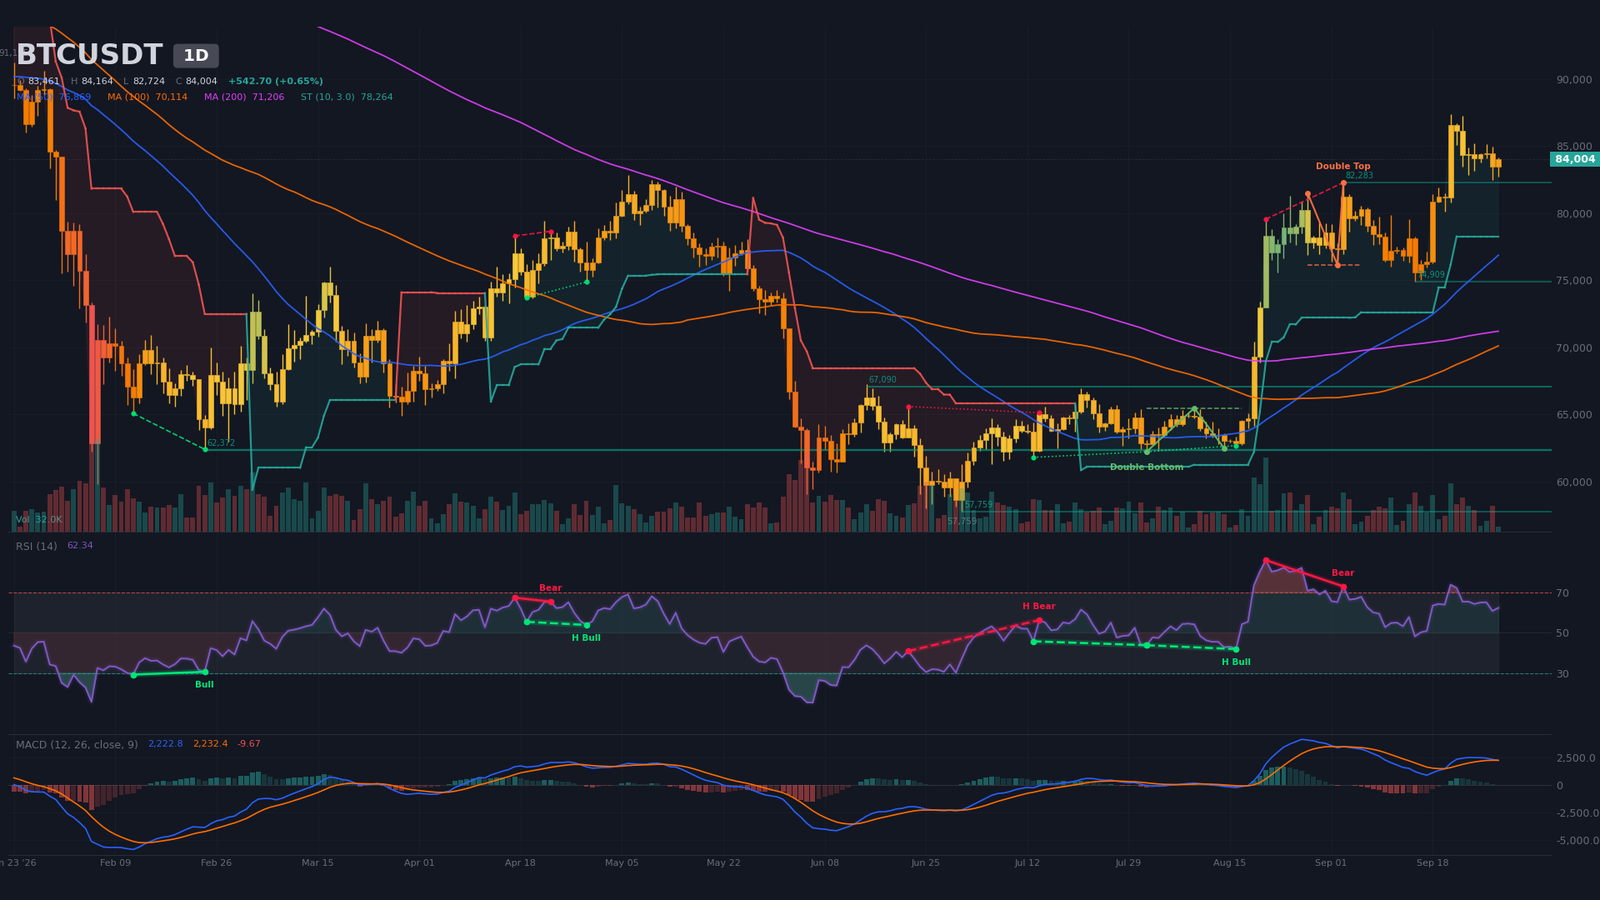
The daily structure preserves its uptrend. Spot price at $84,004 sits above the SMA20 ($80,957), SMA50 ($76,869), and SMA200 ($71,206), with a 50/200 golden cross confirmed on September 8 — twenty-one candles ago. The sequential break of swing highs — $81,270 on August 25, $82,283 on September 3, $87,385 on September 21 — confirms the major impulse from the August 14 trough at $62,484, where the RSI had compressed to 42.8. This sequential sequence of rising swing highs is the textbook signature of a primary uptrend.
However, since the September 21 high, price has been retracing through a series of lower highs inside a horizontalized corrective channel. MACD has just rolled over on a bearish cross dated September 29 (line 2,222.8 vs signal 2,232.4, histogram at -9.7) — the first exhaustion signal of the impulse — while RSI14 holds around 62.3, neutral, no overbought but with declining momentum. Identified supports stack at $82,283 (one touch, September 3), $74,909 (one touch, September 15), and the major threshold at $67,090 (two touches since June). The daily double top detected by the chartist model (neckline $76,152, target $70,412, last pivot September 3) is now invalidated by the September 21 break to $87,385.
The daily SuperTrend remains bullish at $78,264 — the structural protection level. Daily volume (31,983) prints only 22% of the 20-period average, a low-conviction seller signature. As long as price holds above the SMA20 at $80,957 and the SuperTrend at $78,264, the daily bullish thesis remains valid; a simultaneous break of both levels would signal a structural change that would invalidate the dominant weekly scenario.
Intermediate Dynamics (4H): Corrective Zig-Zag and Double Top
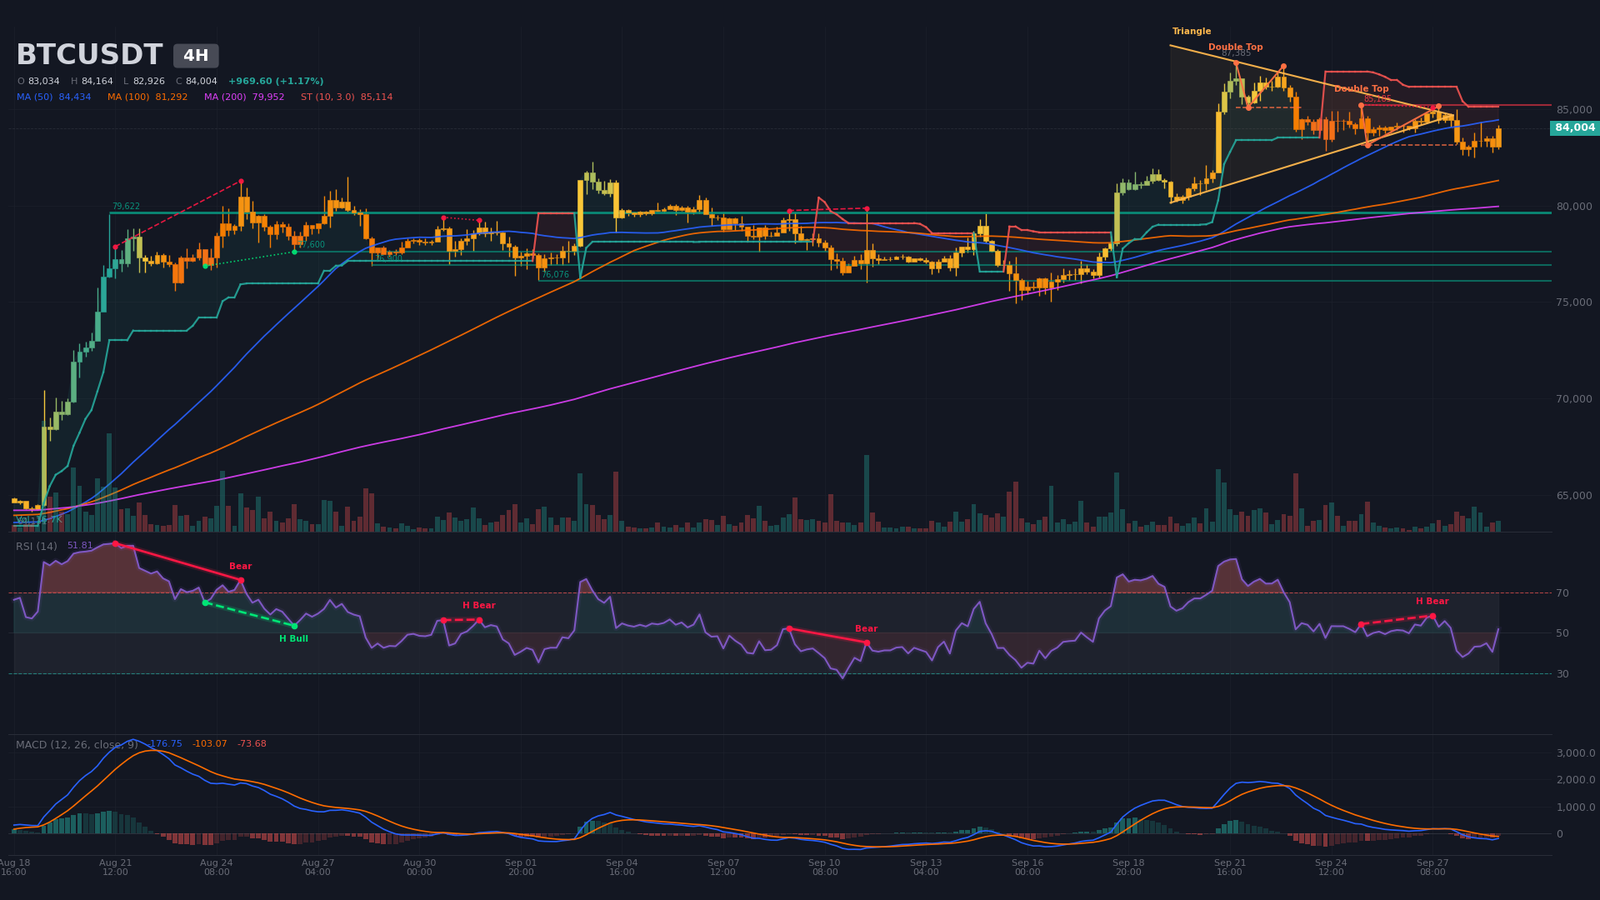
The 4-hour structure confirms the ongoing pullback. Since the impulse to $87,385 on September 21 at 12:00, price has alternated lower highs and lower lows: highs at $84,901 (09/24), $85,224 (09/25), $84,296 (09/26), $85,146 (09/27), $84,966 (09/28); lows at $85,080 (09/22), $83,450 (09/23), $82,832 (09/24), $83,130 (09/25), $82,500 (09/28). A 4H double top is confirmed: neckline at $85,080, theoretical target $82,844 (currently being tested), last pivot September 23 at 04:00. RSI14 at 51.8 stays median; MACD trades below zero (line -176.7, signal -103.1, histogram -73.7) with a bearish cross dated September 27 at 20:00, eight candles ago.
The 4H SuperTrend flips bearish at $85,114, the upper bound of the current range. A symmetrical triangle formed between September 20 and 27 (bounds $84,855 / $84,440) resolved to the downside. The major 4H support remains at $79,622 (five touches since August 21), followed by $77,600 and $76,076. Immediate resistance sits at $85,185 (two touches since September 25). 4H volume prints slightly above average (+17%), signature of a gradual distribution. The double-top target at $82,844 is now being tested: a clean break below this threshold would open the path toward the major support at $79,622.
Intraday Structure (15m): Compressive Wedge Rebound, RSI Overbought
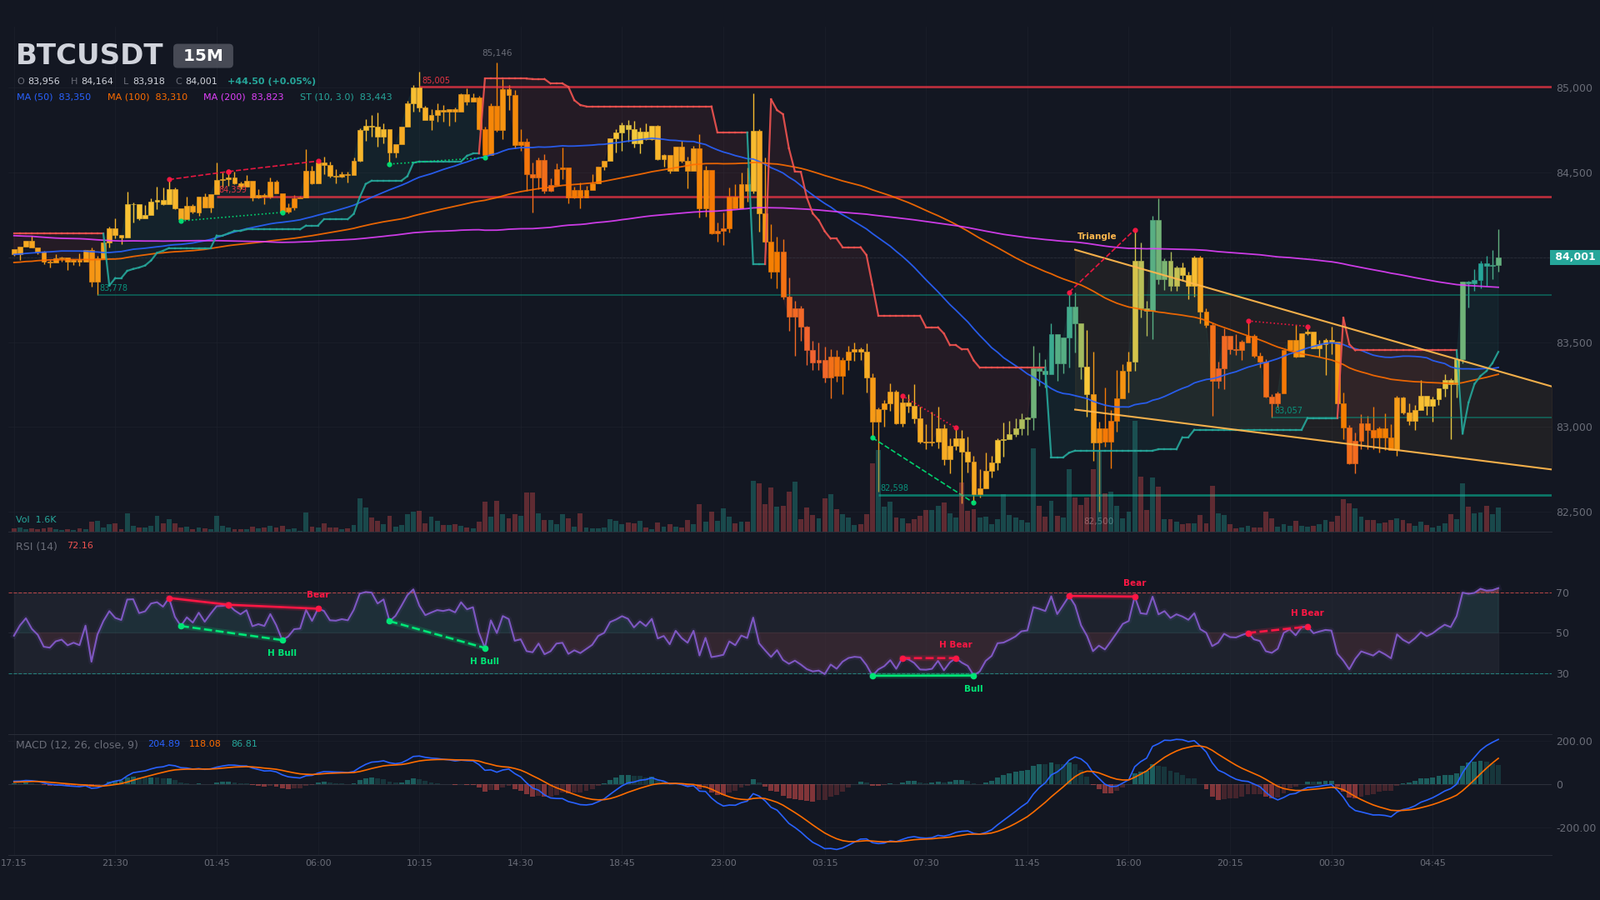
On the 15-minute timeframe, price is rebounding from the September 28 trough at $82,500 (12:00) into a fresh bullish sequence: $83,184, $83,276, $83,587, $84,358, then $84,042. RSI14 stretches to 72.2, in overbought territory, signalling a fading rebound; MACD has crossed back above zero (line 204.9, signal 118.1, histogram +86.8) with a bullish cross dated September 29 at 03:30. An ascending wedge is identified (start 09/28 13:45, last pivot 09/29 05:30, apex estimated 09/30 07:21, bounds $83,410 / $82,824); its break will dictate the next directional move.
Immediate resistance sits at $84,359 (four touches since 09/27), followed by $85,005 (four touches, swing high); immediate support is at $83,778 (one touch, September 26), then $83,057 and $82,598 (four touches since 09/28). The M15 SuperTrend is bullish at $83,443. Last candle volume prints 1.68x average, confirming intraday buyer engagement but at the cost of stretched momentum. The convergence of an ascending wedge, an overbought RSI, and a bearish 4H target at $82,844 suggests a tight tactical window over the next 24 hours.
Multi-Timeframe Synthesis
The combined read across the three timeframes reveals a textbook case of transition between mature impulse and medium-volatility corrective phase. The daily structure carries the trend, but the 4-hour timeframe dictates the timing; the intraday prints flag a momentum stretch that compresses the execution window.
| Timeframe | Dominant Trend | RSI (14) | MACD | Chart Pattern |
|---|---|---|---|---|
| Daily (1D) | Bullish (post-impulse consolidation) | ~62 | Nascent bearish cross (histogram -10) | Pullback from 09/21 top |
| 4 hours (4H) | Bearish (descending zig-zag) | ~52 | Below zero, bearish cross (8 candles) | Double top (neckline 85,080, target 82,844) |
| 15 minutes (M15) | Bullish (short-term rebound) | ~72 (overbought) | Above zero, bullish cross (16 candles) | Ascending wedge (apex 09/30 07:21) |
Mapping of Technical Levels and Pivots
The level mapping combines daily pivots (base = last completed candle from September 28), daily SMAs (20/50/200), swing high/low clusters, Binance order book walls, and chartist figure extensions. The short-term central pivot prints at $83,640 (Daily P), with the daily SMA20 at $80,957 acting as the structural pivot support. The architecture of the map reveals a compression of technical levels inside the $82,500 – $85,200 zone that frames current trading and defines the invalidation thresholds of each of the three scenarios.
| Level | Price (USD) | Category | Technical Foundation |
|---|---|---|---|
| R3 | 86,000 – 86,300 | Major resistance | 4H extension (Daily R2 86,109) + 09/25 4H top at 85,224 + estimated short liquidation pocket 87,000-87,700 ($165M) |
| R2 | 85,100 – 85,250 | Major resistance | Bearish 4H SuperTrend (85,114) + resistance 85,185 (2 touches) + sell wall 84,713 ($10.3M) |
| R1 | 84,350 – 84,400 | Immediate resistance | Daily R1 84,785 / M15 resistance 84,359 (4 touches) / sell wall 84,238 ($5.1M) |
| P | 83,600 – 83,650 | Pivot | Daily P 83,643 / M15 pivot 83,957 / Daily SMA20 80,957 (structural floor) |
| S1 | 82,300 – 82,500 | Immediate support | Daily S1 82,318 / M15 swing low 82,500 (09/28 12:00) / 4H trough 82,500 |
| S2 | 79,600 – 80,000 | Major support | 4H support 79,622 (5 touches) / Daily SMA50 76,869 (major belt) |
| S3 | 76,900 – 77,600 | Major support | 4H support 77,600 (2 touches) / Daily swing low 76,000 (09/11) / estimated long liquidation pocket 75,800-76,500 ($133M) |
Order Book and Liquidity Heatmap
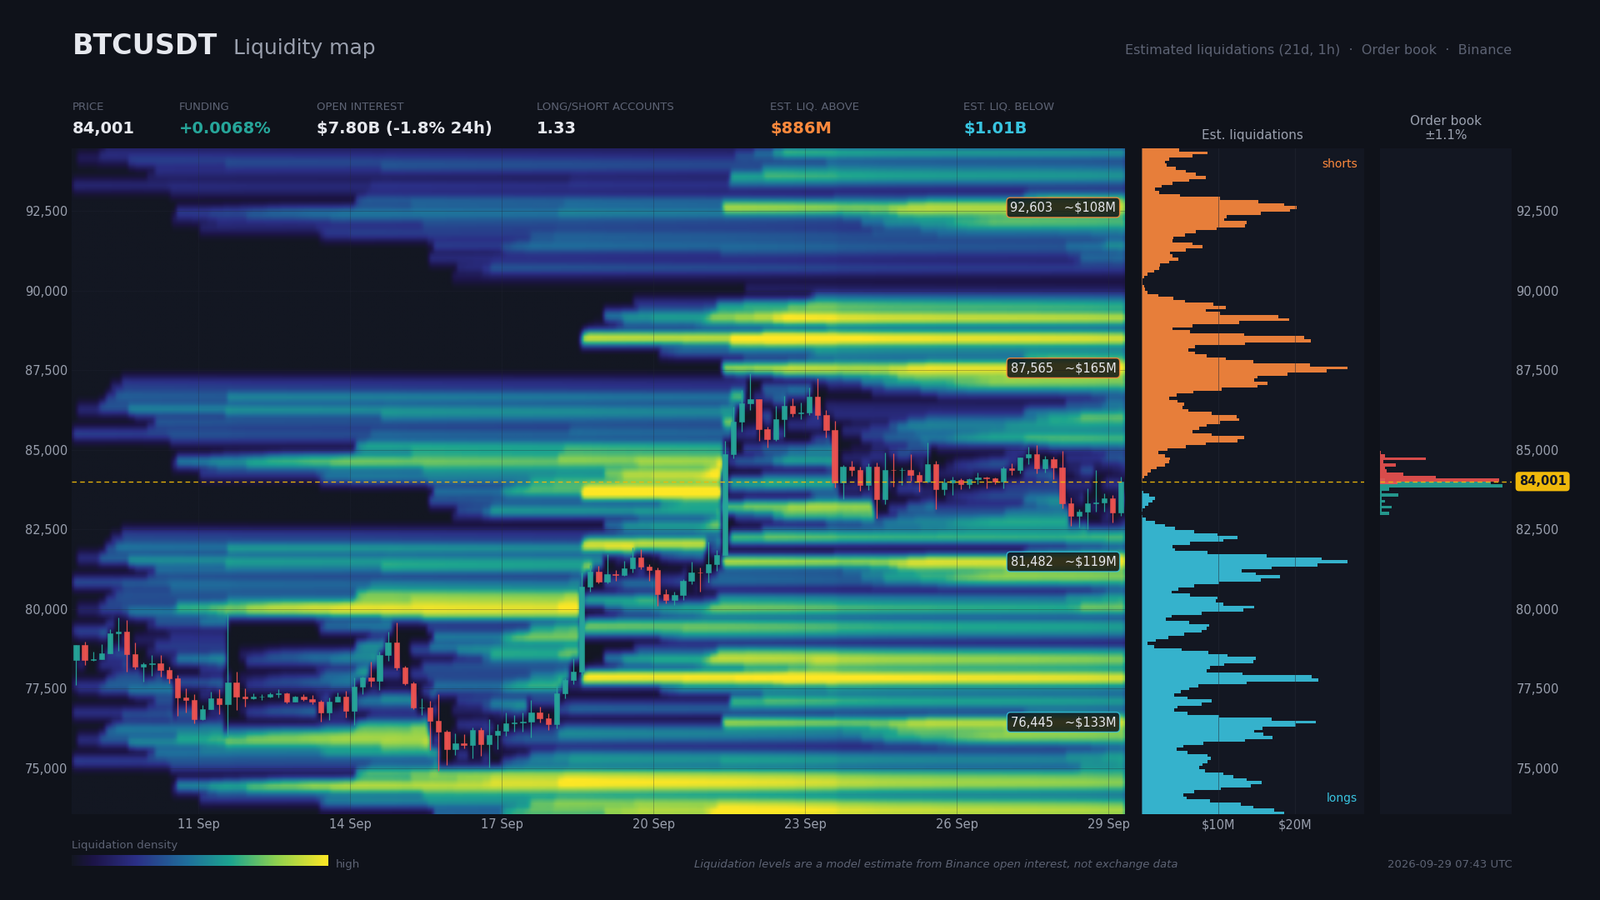
The Binance order book is covered at 1.06% of spot price, readable to ±1.06% around $84,001 (~$83,100 – $84,900). Beyond, only liquidation estimates inform real liquidity. The bid/ask imbalance is -0.4% (asks at $66.0M vs bids at $65.5M on the 2% window), a neutral structure that suggests neither aggressive buying nor aggressive selling. The thickest buy walls concentrate at $83,953 ($24.7M) and $83,858 ($27.3M) — two consecutive tiers forming a dense floor in the $83,850 – $83,950 zone that should cushion any sharp drop. The most significant sell walls are at $84,048 ($26.6M), $84,144 ($12.5M), and $84,714 ($10.3M): the first acts as sticky resistance above price, the second forms the next intraday upper bound.
On the derivatives side, spot funding sits at 0.0068% (7.5% annualized), moderately positive, signature of a non-aggressive bullish bias. Open interest stands at $7.80B, down -1.77% over 24 hours and -17.11% over 7 days — a significant leverage flush that reduces cascade risk. Long/short ratios show a bullish bias: 1.332 across all accounts, 1.886 among top traders, 24h taker buy/sell at 1.002 (near neutral). This divergence between a very bullish top-trader ratio and a neutral taker buy/sell reinforces the idea of a market compression waiting for the macro catalyst.
Model-based estimated liquidation zones (not measured) print as follows. Above price: $165M between $86,950 and $87,710, $108M between $92,365 and $92,935, and $73M around $88,420 — total $886M. Below price: $133M between $75,827 and $76,492, $119M between $81,245 and $81,720, and $65M around $77,775 — total $1,012M. The densest pocket therefore sits just below price ($81,200 – $81,700) at $119M, followed by the psychological $75,800 – $76,500 zone at $133M. The risk of a liquidity sweep toward $81,500 – $81,700 before a bullish reversal is non-negligible; a short squeeze toward $87,500 remains possible but requires an external macro catalyst.
Calendar: Catalysts to Watch
The week ahead is one of the heaviest of the US macro calendar, with a triptych of releases capable of catalysing the current range breakout. Three sessions stand out: Core PCE on September 30, ISM Manufacturing on October 1, and NFP on October 2. The Tuesday inflation print alone could dictate the direction of long-end yields and, consequently, the fate of the $83,640 pivot.
- 09/29, 16:00 (Zurich) — JOLTS Job Offers (USD, HIGH): consensus 7.24M, previous 7.271M. Issue: labor market tightness.
- 09/30, 14:30 (Zurich) — Core PCE m/m (USD, HIGH): consensus +0.4%, previous +0.2%. Major catalyst: a print above 0.4% confirms the Fed in waiting mode and weighs on risk assets.
- 09/30, 14:30 (Zurich) — GDP final t/t (USD, HIGH): consensus +6.4%, previous +3.6%. Final estimate subject to revisions.
- 10/01, 16:00 (Zurich) — ISM Manufacturing (USD, HIGH): consensus 54.9, previous 54.6. 50 threshold = expansion.
- 10/02, 14:30 (Zurich) — NFP (USD, HIGH): consensus +84k, previous +162k. The decisive catalyst: a print well below 84k or above 150k would break Bitcoin out of its current sideways structure.
Three Scenarios for the Coming Weeks
The three scenarios that follow combine chartist configurations detected on the three timeframes, the order book walls and estimated liquidations, and the US macro sessions over the next five days. Probabilities are conditional on the absence of any exogenous shock (geopolitical or monetary) not priced into consensus.
Scenario A — Consolidation $82,500 – $85,200 Then Bullish Break (probability 50%)
Trigger: Core PCE release ≤ 0.3% on 09/30 OR NFP ≤ 80k on 10/02 (risk-on reaction, US yields pullback). Trajectory: test of the $82,500 support (Daily S1), which holds given the density of buy walls at $83,850 – $83,950, then rebound toward $84,350 (R1) and $85,200 (R2, 4H SuperTrend). Extended target: $86,100 – $86,300 (R3 / former 4H high), then $87,400 (estimated short liquidation pocket, $165M). Execution zone: $82,300 – $82,600. Invalidation: 4H close below $82,000 (loss of the 09/28 swing low). Stop: $81,400 (≈ 1× ATR14 4H = $861). R:R ≈ 1.8.
Scenario B — Liquidity Sweep Toward $81,200 – $81,700 Then Rebound (probability 35%)
Trigger: Core PCE ≥ 0.4% OR persistent Iran/oil tensions (Brent > $100) OR NFP in line at +84k but Powell remains hawkish. The order book covering only 1.06% of spot, the market can target the $119M estimated liquidation pocket between $81,245 and $81,720. Trajectory: break of the $82,500 support (Daily S1) then a swift sweep toward $81,700 before a technical reaction. Execution zone: $81,500 – $81,700 (liquidation pocket + implicit 4H support). Invalidation: 4H close below $81,200 (trigger toward S2). Stop: $80,400 (1.5× ATR 4H). R:R ≈ 2.0.
Scenario C — Bearish Continuation Toward $79,600 – $80,000 (probability 15%)
Trigger: Core PCE ≥ 0.5% combined with ISM Manufacturing < 54 OR NFP > 150k (wage re-heating). Trajectory: break of $81,700 (implicit Daily S2), toward $79,622 (4H support at five touches) then $77,600 (second 4H touch). The daily SMA200 at $71,206 remains the absolute floor invalidating the primary trend. Execution zone: $79,700 – $80,000. Invalidation: daily close above $82,500 (recovery of Daily S1). Stop: $82,700.
Synthesis and Conclusion
Bitcoin is trading a post-impulse digestion phase: the primary daily trend remains bullish (50/200 golden cross, price above all three SMAs, corporate support from Strategy and Strive), but the 4H structure has flipped to corrective mode with a confirmed double top and SuperTrend bearish at $85,114. The open interest drop (-17% over seven days) has purged part of the leverage, which reduces capitulation risk; simultaneously, the concentration of estimated liquidations below price ($1.01B vs $886M above) creates a bearish magnet toward the $81,200 – $81,700 pocket.
The dominant strategy is wait-and-see: favor buys in the $82,300 – $82,600 zone (Daily S1 + buy walls $83,850 – $83,950), with a stop below $81,700; avoid buying above $85,200 as long as the 4H SuperTrend has not flipped. The decisive catalyst will be the October 2 NFP (consensus +84k, previous +162k) — a print well below expectations would validate Scenario A, a print in line would reignite the sweep risk. Daily protection level: $78,264 (bullish SuperTrend); structural alert level: simultaneous break of the SMA20 ($80,957) and the 4H SuperTrend ($85,114).
Sources
- UK Chancellor of the Exchequer Blasts Nigel Farage’s ‘Bitcoin Account’ — Bitcoin Magazine, 28/09/2026
- Strive Buys $94.5 Million in Bitcoin, Pushing Holdings Past 27,000 BTC — Decrypt, 28/09/2026
- Strategy and Strive Scoop Up More Than 2,700 Bitcoin in a Week — Bitcoin Magazine, 28/09/2026
- Strive pushes bitcoin holdings above 27,400 BTC with latest $94.5 million purchase — The Block, 28/09/2026
- Bitcoin Falls Lower as Trump’s Iran Snub Sends Oil, Yields Higher — Decrypt, 28/09/2026
- Stock futures are little changed after higher yields lead to losing session — CNBC, 29/09/2026
- Bond yields move relentlessly higher, as Wall Street wonders how much more tech stocks can take — MarketWatch, 28/09/2026
- Trump-Xi summit analysis: ‘Tangible outcomes’ needed for U.S.-China truce to hold — CNBC, 28/09/2026
- Australia raises benchmark rates to 15-year high as it fights sticky inflation — CNBC, 29/09/2026
- Tether says it helped freeze $550M in Iran-linked USDT this year — Cointelegraph, 29/09/2026
- $531M in crypto assets liquidated in 24 hours amid market stress — Crypto Briefing, 29/09/2026
- Bitwise ETF clients purchase $9.65M in Solana tokens as BSOL dominates US spot fund category — Crypto Briefing, 29/09/2026
- BlackRock ETF clients buy $15M worth of Ethereum — Crypto Briefing, 29/09/2026
- Citi Clients Can Now Take Stablecoin Payments Through Coinbase — Decrypt, 28/09/2026
- Tether’s USDT at center of Iran’s shadow banking network, new Senate Report says — The Block, 28/09/2026
- Pump.fun: Why PUMP’s 20% surge faces KEY test despite $466M buybacks — AMBCrypto, 28/09/2026
- Belarus Approves the Country’s First Crypto Banks: Report — Bitcoin Magazine, 28/09/2026
- SEC Proposes New Regulation Crypto Assets — SEC.gov, 18/08/2026
- Bitcoin ETF Outflows Expose a Fragile Institutional Bid — Investing.com, 10/09/2026
- Crypto ETF Options: The SEC Deadline on Sept 27 — CryptoTicker, 24/09/2026
- Bitcoin Futures — CME Group, page produit consultée le 29/09/2026
Disclaimer: This article is for educational and informational purposes only. It does not constitute investment advice, a recommendation to buy or sell, or an invitation to trade any financial asset. Cryptocurrency markets are extremely volatile; any investment decision should be based on your own research (DYOR) and, where appropriate, the advice of a licensed financial adviser.

