


As September 2026 draws to a close, the Bitcoin market sits at the intersection of two major forces: the unwinding of a colossal quarterly options expiry and uninterrupted institutional accumulation on the spot market. Between derivatives structure, ETF flows, and a multi-timeframe technical setup, here is a full read on what could determine BTC’s trajectory over the coming days.
Macroeconomic backdrop and derivatives market mechanics
Short-term dynamics are currently dominated by the unwinding, on Friday September 25 at 08:00 UTC on Deribit, of an options block with a notional value of between $15.6 and $15.9 billion — roughly 182,000 BTC. This expiry concentrates between 37% and 41.5% of the exchange’s total open interest, making it the largest settlement of the quarter.
The options book shows a put/call ratio of between 0.69 and 0.71, reflecting a clear overrepresentation of call positions, which total $9.4 to $9.6 billion versus $6.4 to $6.5 billion for puts. A substantial concentration of open positions sits at the $90,000 strike, while the « max pain » point — the theoretical level at which the largest number of contracts would expire worthless — sits between $72,000 and $75,000, a gap of more than $9,000 to $10,000 below spot prices.
This divergence is explained by a « positive gamma » regime among market makers heading into quarter-end: their dynamic hedging forces them to sell into strength and buy into weakness, mechanically compressing realized volatility beneath the local peak of $87,396. The expiry of this options block at 08:00 UTC releases these hedging flows and potentially exposes prices to a sharp directional re-acceleration — all the more so since this expiry coincides with the CME Bitcoin futures settlement at 15:00 UTC and the release of key US macroeconomic data (durable goods orders and the final University of Michigan consumer sentiment reading).
On the spot market, the trend remains firmly bullish: US Bitcoin ETFs recorded $191 million in net inflows on September 24, with $163 million coming from BlackRock’s IBIT alone. This steady spot demand absorbs hedging-related selling and builds a solid structural floor above $80,000, partly neutralizing the theoretical pull of max pain toward $75,000.
Multi-timeframe technical analysis
Daily chart (1D): major trend and structural setup
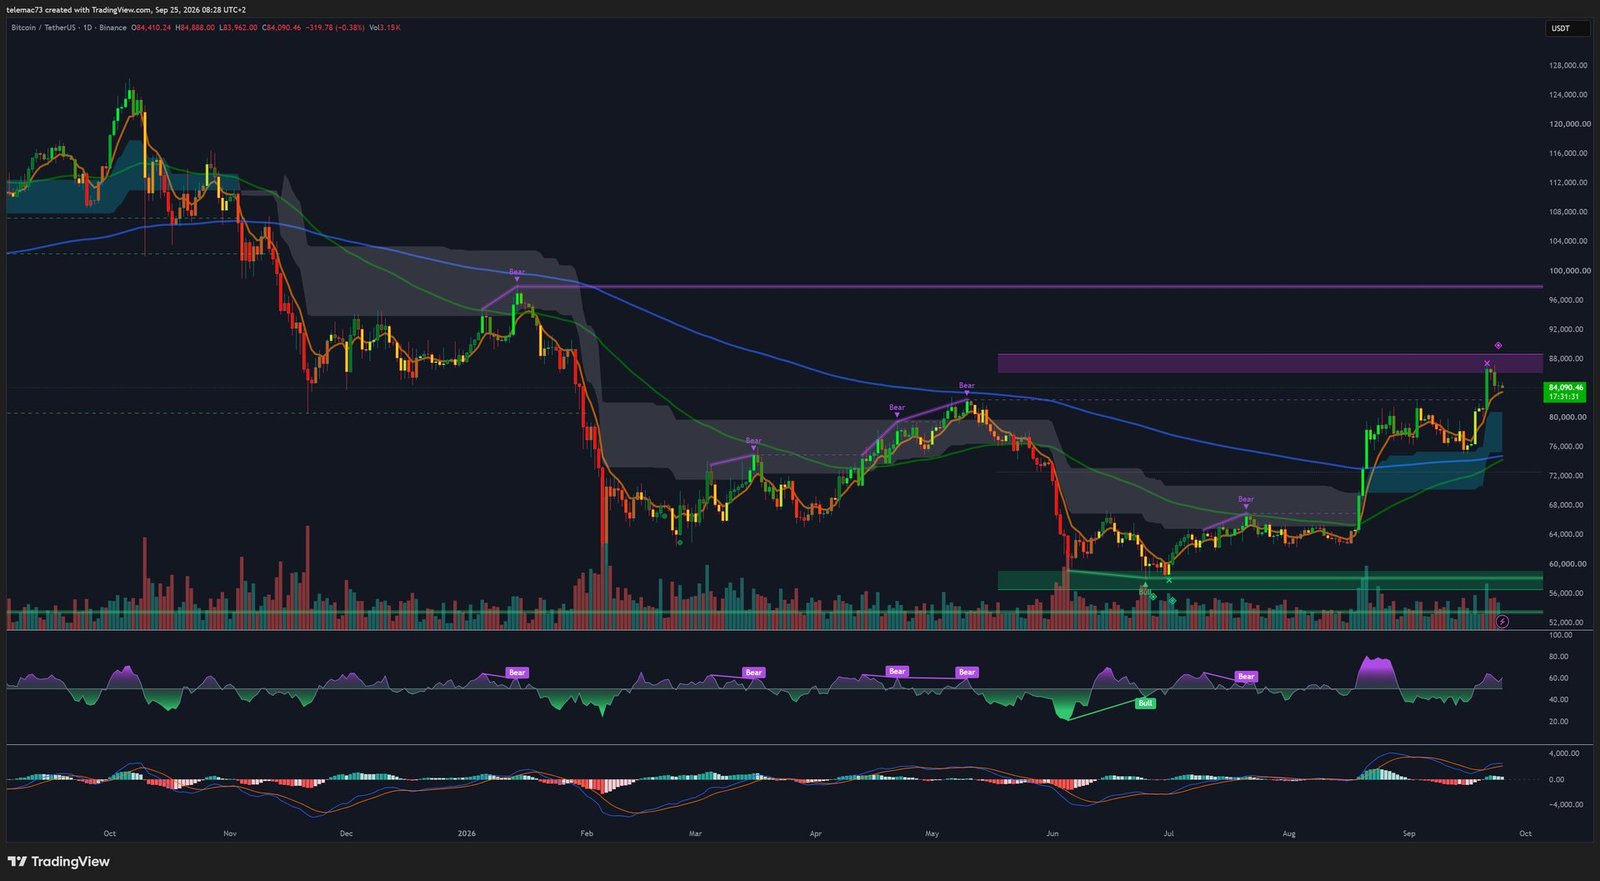
The daily timeframe shows a major structural transition that began with a long accumulation phase between $56,000 and $60,000. This zone served as a launchpad for a large vertical impulse that successively broke through resistance at $64,000, $72,000, and $80,000, before setting a local high at $87,396. Price has since run into a major institutional supply zone, located between $87,000 and $88,000, triggering the current consolidation around $84,410.
The moving-average structure confirms the strength of the underlying trend: the 50-day EMA sits clearly above the 200-day SMA, confirming a long-term Golden Cross. The 200 SMA is climbing toward $74,000-$75,000, while the 50 EMA is rising toward $79,000-$80,200, defining the first dynamic support zone in the event of a deeper correction. On the oscillator side, the daily RSI — which broke above 80 during the push to $87,396 — has cooled to 62, an orderly decompression that preserves bullish momentum without damaging market structure. The MACD remains strongly positive above 2,400, though a flattening histogram signals a slowdown in upward speed.
4-hour chart (4H): bull-flag consolidation
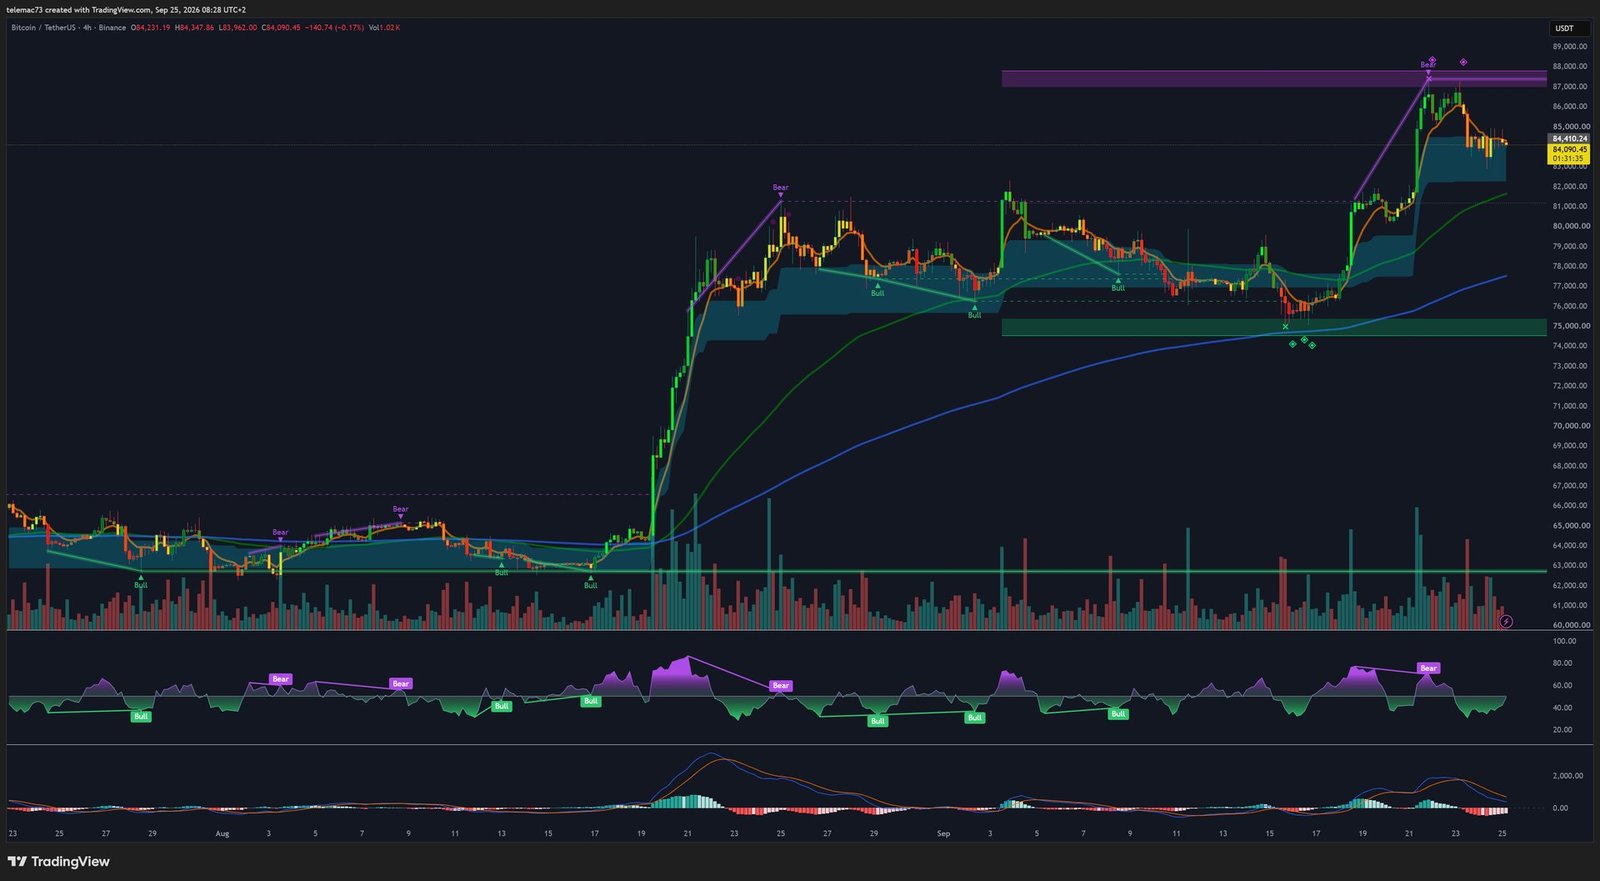
On the 4-hour timeframe, price is consolidating within a tight descending channel, characteristic of a bull flag following the prior near-vertical move. This pattern reflects an absorption of floating supply through institutional profit-taking rather than aggressive distribution. The short moving averages (10 and 20 periods) have turned lower in a local bearish crossover, forcing price to test the dynamic support band between $84,000 and $84,500, while the 200 SMA remains firmly bullish between $77,000 and $78,000.
The 4H RSI has fully unwound its overbought excess, returning to a neutral 47. The MACD confirmed a bearish crossover below its signal line, with its value falling to 676 — a sign that the corrective phase is maturing. From here, resuming the primary uptrend would only require a confirmed break above the flag’s upper boundary, around $85,000.
15-minute chart: intraday compression
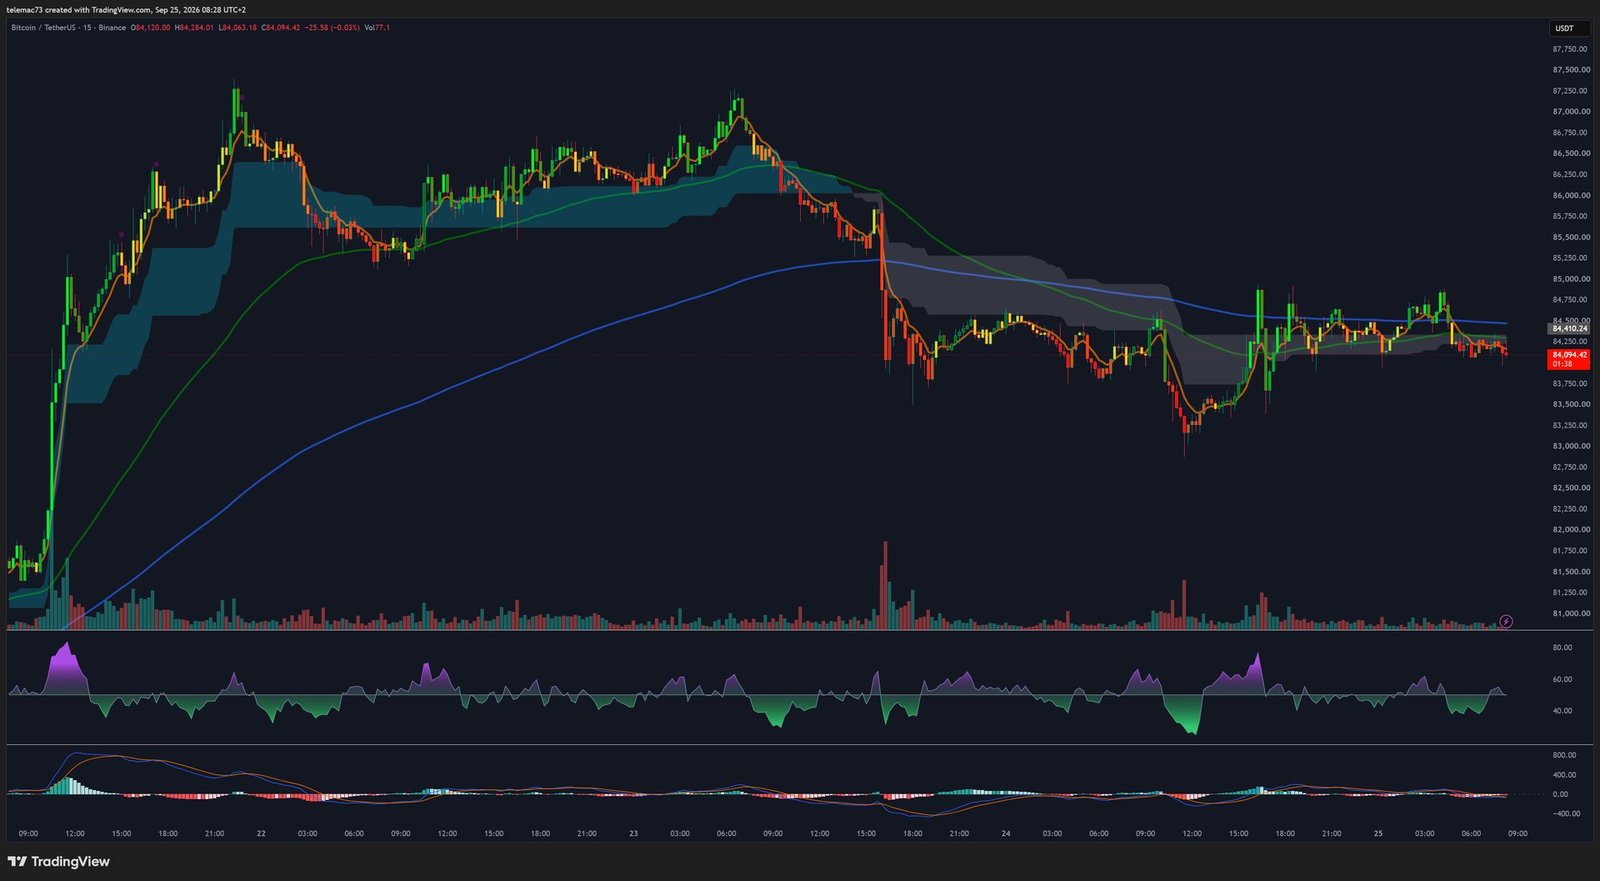
On the 15-minute timeframe, selling pressure is progressively fading in favor of a symmetrical-triangle compression structure. After testing the $82,800-$83,200 floor, buyers regained the initiative, pulling price back to the $84,094-$84,410 equilibrium zone. The short moving averages are now flattening and interweaving, reflecting marked indecision as the market awaits a volatility catalyst. The 15M 200 SMA, positioned at $85,100, forms the first dynamic intraday ceiling. RSI has stabilized at 48 and the MACD is glued to its zero line — a state of neutrality typical of phases that precede a directional expansion, here likely tied to the derivatives unwind.
Liquidity and order-book mapping
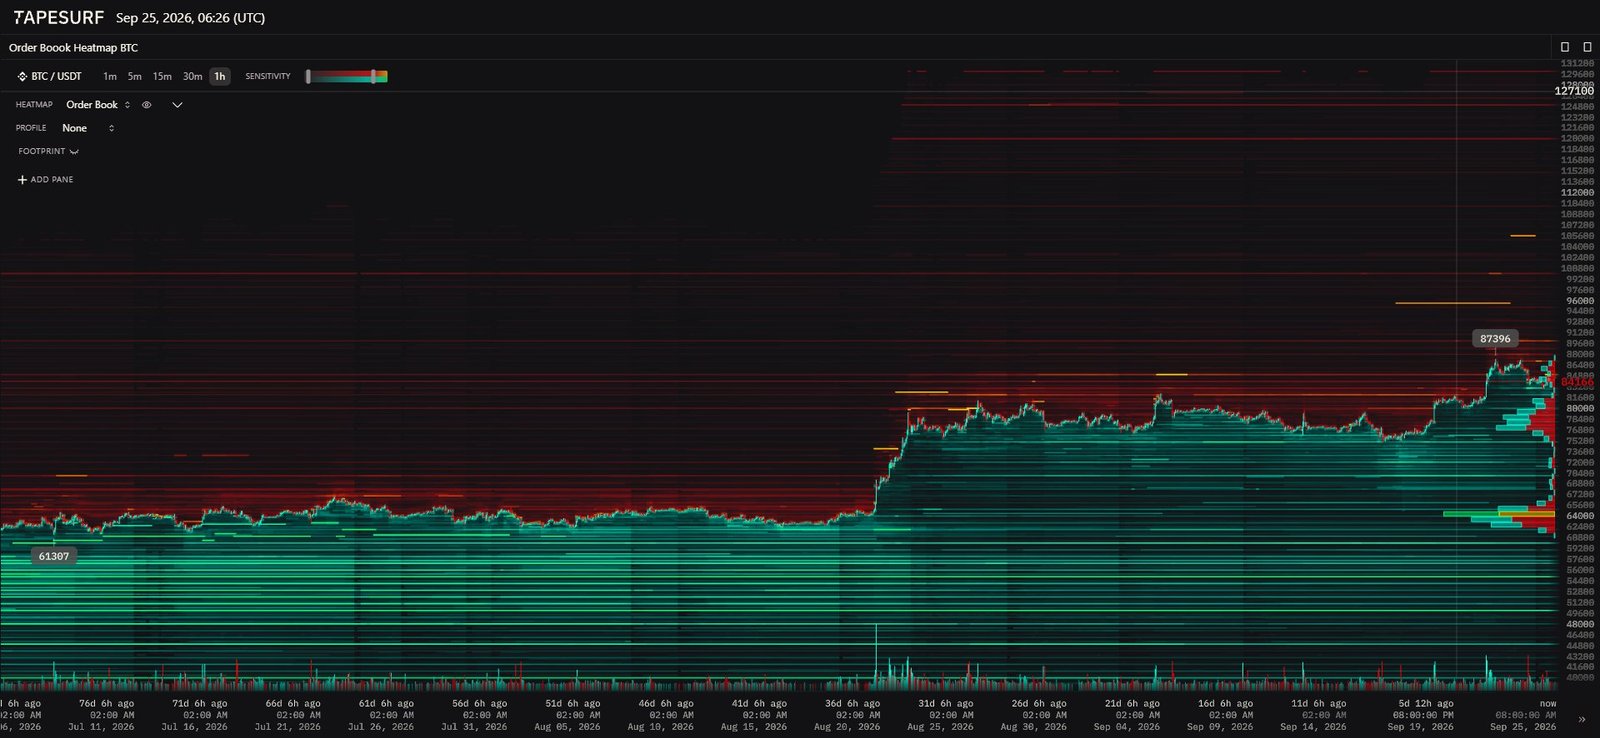
The Tapesurf heatmap reveals a highly asymmetric arrangement of institutional limit orders around the $84,410 spot price. On the buy side, a first support block sits between $82,800 and $83,200, a level that has already underpinned recent bounces, followed by a second accumulation layer protecting the $82,000 threshold. The densest concentration in the order book sits between $72,000 and $75,000 — a zone that lines up exactly with the quarterly options max pain and the daily 200 SMA, forming a genuine institutional wall against any systemic liquidation scenario. Further down, the long-term historical floor remains anchored at $61,387.
On the sell side, resistance is organized in successive layers: an initial profit-taking zone between $85,000 and $86,000, followed by two major institutional sell walls at $88,000 (roughly $103 million in limit orders) and $90,000 (roughly $123 million), which form the main barrier before the $95,000 zone. An isolated residual liquidity line also appears higher up at $127,100. Between $85,500 and $87,000, the thin order depth creates a genuine liquidity vacuum: any confirmed break above $85,000 could therefore trigger a mechanical acceleration toward $87,396 and then the $88,000 wall.
Key technical levels
| Level | Price threshold | Rationale |
|---|---|---|
| Major resistance 3 | $90,000 | Psychological threshold, institutional order wall |
| Major resistance 2 | $88,000 | Sell-limit order wall, distribution shelf |
| Immediate resistance | $87,374-$87,400 | September local high, upper flag boundary (1D) |
| Key intraday pivot | $84,800-$85,200 | 200 SMA (15M), 4H bull-flag boundary, bearish invalidation level |
| Spot price (equilibrium) | $84,094-$84,410 | Median compression zone, neutral oscillators |
| Immediate support | $82,800-$83,200 | 15M triangle floor, buy-side liquidity entry |
| Intermediate support | $80,000-$80,280 | Psychological threshold, daily EMA 20/50 confluence |
| Major structural support | $75,000-$76,000 | Deribit max pain, daily 200 SMA, densest order band |
Trajectories and scenarios
Primary scenario: bullish resolution via flag breakout
The preferred scenario rests on the continued dominance of the daily uptrend and the ongoing absorption of supply by spot ETFs. A confirmed 4H close above the $84,800-$85,200 pivot zone would validate the descending channel as a bullish continuation pattern, driving a break above the 15M 200 SMA and ending the sequence of lower intraday highs. The first impulse would target a quick return to $87,396; once that resistance is absorbed, the market could enter a short-squeeze phase toward the order walls at $88,000 and then $90,000. Confirmation would come from a positive reopening of the 4H MACD histogram and the daily RSI returning above 70.
Corrective scenario: bearish breakdown and liquidity sweep
This scenario would take shape in the event of an asymmetric unwind of options hedges after 08:00 UTC, combined with a temporary slowdown in ETF inflows. A confirmed hourly close below $82,800 would trigger a cascade of stop-loss executions, first pushing price toward $80,000-$81,200. Should that intermediate floor give way, gravitational pull would drive prices toward the institutional liquidity base between $75,000 and $76,000 — the ultimate rebound zone, in confluence with the daily 200 SMA and max pain.
Neutral scenario: extended sideways compression
An indecision scenario envisions continued oscillation within the $83,200-$84,800 channel, so long as the market remains in a wait-and-see posture between the morning’s Deribit expiry and the 15:00 UTC CME futures settlement. The 15M and 4H oscillators would hold a flat trajectory around the 50 midline, while the order book continues to accumulate liquidity at its outer bounds — delaying directional expansion while increasing the potential intensity of the eventual breakout.
Institutional summary
The multi-timeframe analysis of Bitcoin points to an asset underpinned by a robust bullish base trend, reflected in the daily Golden Cross and the strength of spot flows. The consolidation observed below $87,396 looks like a healthy technical breather within a 4H bull flag, allowing the RSI to unwind its overbought excess. The $15.9 billion quarterly derivatives expiry on September 25 marks the unlocking of the positive-gamma straitjacket that had been suppressing volatility. As long as the buy-order zone between $82,800 and $83,200 holds, market structure favors an upside resolution; reclaiming the $85,000-$85,200 pivot would serve as the trigger signal to unleash momentum toward the institutional targets of $88,000 and $90,000.
Disclaimer: this article is published for purely educational and informational purposes. It does not constitute investment advice, a recommendation to buy or sell, or a solicitation to trade in financial markets. Cryptocurrencies are highly volatile and risky assets: only invest what you can afford to lose, and always do your own research (DYOR) before making any decision.

