


Bitcoin is now trading in the immediate vicinity of $86,600, at the end of a bullish impulse of more than 13% deployed over just a few sessions. This vertical expansion follows a long horizontal accumulation phase within the 74,000–78,000 dollar corridor, whose bullish resolution was amplified by a massive liquidation of short positions. Here is a look at the macroeconomic, technical and microstructural drivers of this move, and at the scenarios that could shape what comes next.
A macroeconomic backdrop that is clearing up
On the monetary front, the current dynamic reflects a rapid resolution of uncertainty. On September 16, 2026, the US Federal Reserve raised its benchmark rate by 25 basis points, bringing it into the 3.75%–4.00% range. The digital asset market absorbed this shock without capitulating: the initial knee-jerk pullback toward $75,900 was quickly neutralized by buying flows, a sign that the tightening had largely been priced in by institutional desks. Central bankers’ remarks, describing the move as a routine mid-cycle adjustment, dispelled fears of an aggressive tightening cycle.
At the same time, the joint decline in oil prices and US Treasury yields eased global financial conditions, recreating a favorable environment for risk-taking. This improvement materialized through a shift in net flows of US spot Bitcoin ETFs toward a clearly positive balance, with daily net inflows exceeding $433 million in a single session, propelling the price above the pivotal $85,000 threshold. That level corresponds precisely to the volume-weighted average acquisition price of the entire spot ETF holder base, turning a large cohort of passive institutional investors into holders of unrealized gains and neutralizing part of the structural selling pressure.
| Macroeconomic indicator | Observed value | Structural impact on the BTC market |
|---|---|---|
| US benchmark rate (Fed Funds) | 3.75% – 4.00% | 25bp hike absorbed; monetary uncertainty dissipating |
| US Treasury buyback program | $14.5bn / week | Primary liquidity injection stabilizing the debt market |
| US spot ETF net flows (key session) | +$433M (IBIT, FBTC) | Validation of institutional support, absorption of passive supply |
| Average ETF holder cost basis | ~$85,000 | Major psychological shift: return to overall profitability |
| Short liquidation volume | $648M / 24h | Technical catalyst for the breakout above $82,000 |
Multi-timeframe technical analysis: from accumulation structure to directional impulse
A sequential review of the daily (1D), 4-hour (4H) and 15-minute charts documents the transition from a long-term accumulation wedge to a directional impulse, now undergoing a local compression phase beneath a major supply zone.
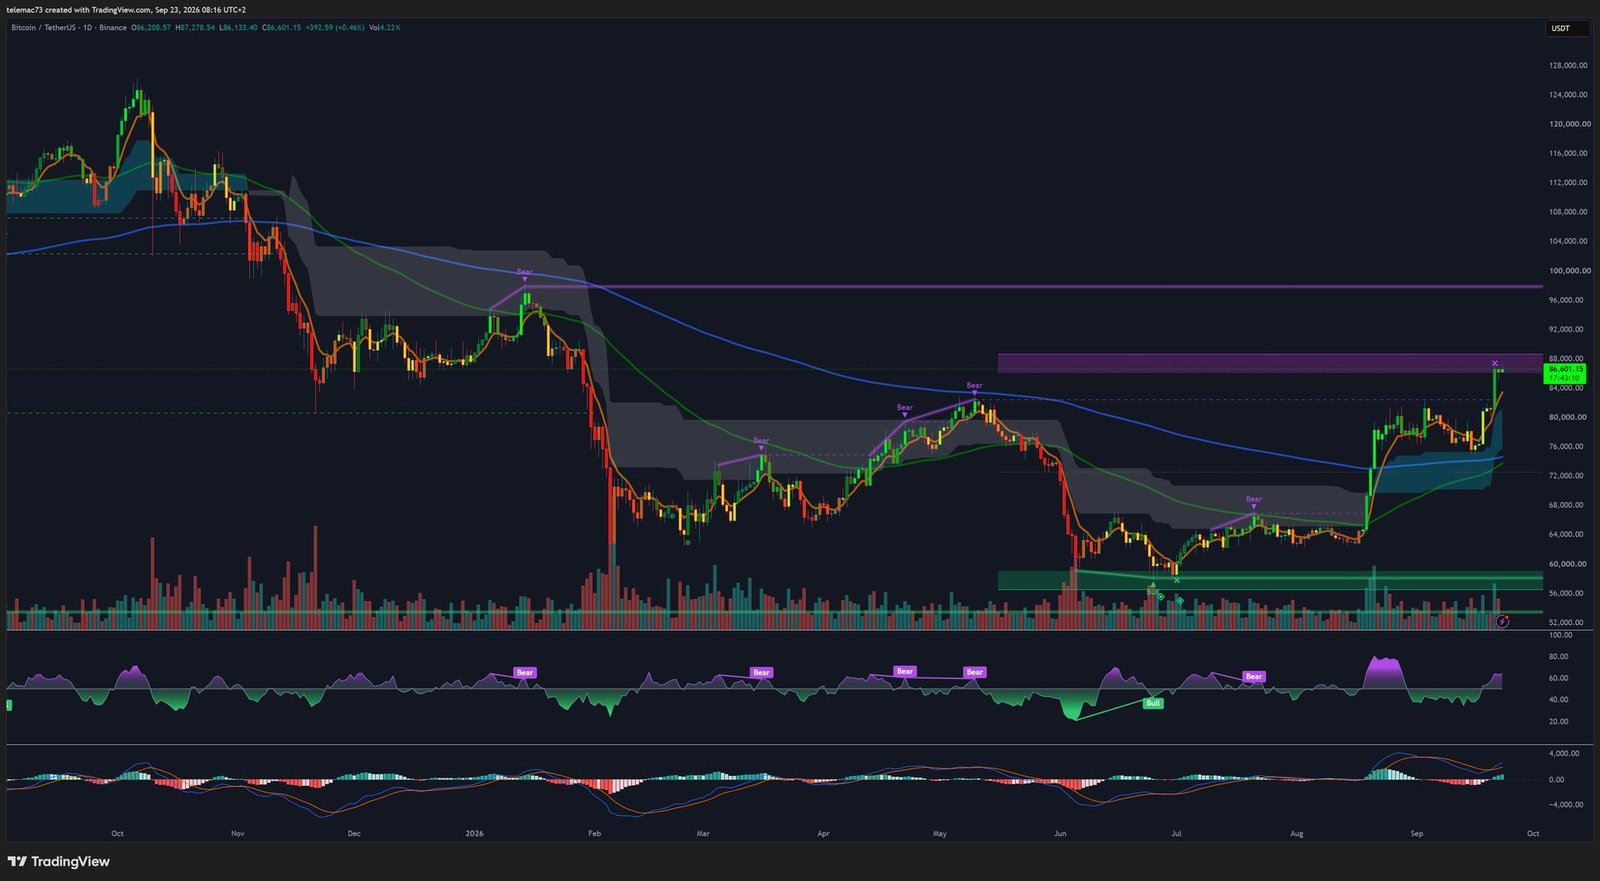
Daily timeframe (1D): structural reversal and the 200-day MA breakout
The daily chart confirms a breakout above a prolonged correction that began from the October 2025 all-time high near $126,000. Over the summer months, Bitcoin built a solid technical base between $54,000 and $58,000, forming a broad double-bottom structure (an “Adam and Eve” pattern).
The decisive technical element is the volume-backed bullish break of the 200-day moving average, which oscillates around $77,500–78,500. This level, which had acted as an impassable dynamic resistance since the start of 2026, is now validated as a macroeconomic structural pivot. Price is currently testing the upper horizontal resistance band, between $86,000 and $88,000, which delineated the historic bearish breakdown zone from February 2026. The absence of an impulsive rejection at this zone highlights active absorption of residual selling liquidity.
4-hour timeframe: Golden Cross and vertical expansion
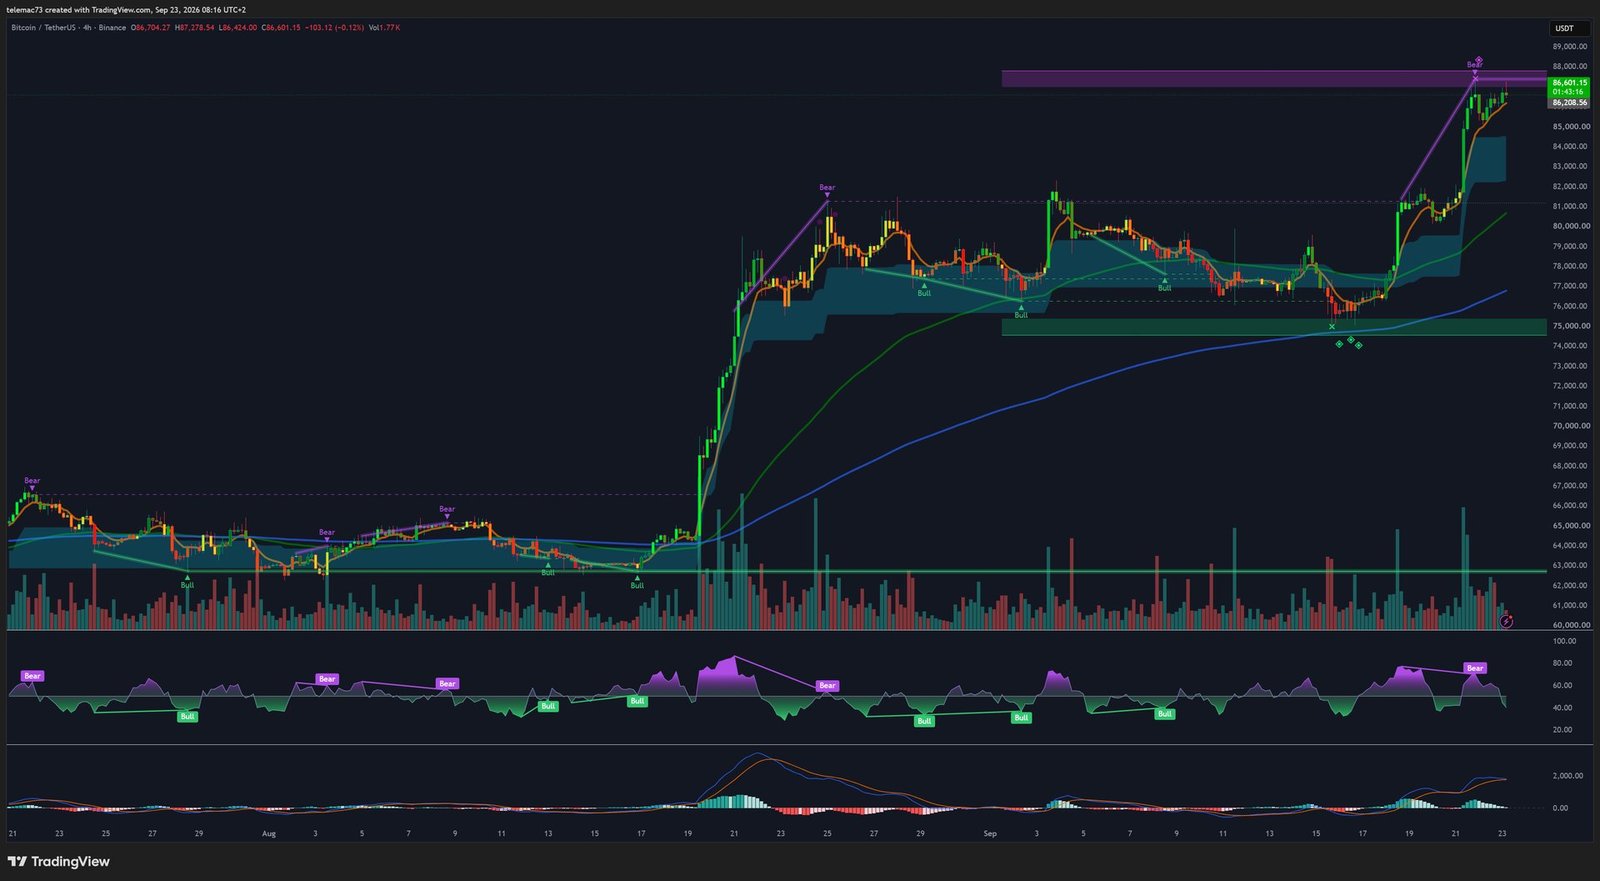
On the 4-hour timeframe, market structure is defined by a parabolic extension out of the $74,000–75,000 support. This impulse triggered a major bullish crossover (Golden Cross) between the fast and slow moving averages around $77,500. That crossover set off an acceleration that swept away the prior local high at $82,293 with no intermediate pullback. Price action peaked at $87,396, the exact point of contact with the top of the supply channel. The most recent candles show upper absorption wicks, signaling that aggressive buying flow is, for the first time, meeting significant passive resistance.
Intraday timeframe (15m): compression into a bullish pennant
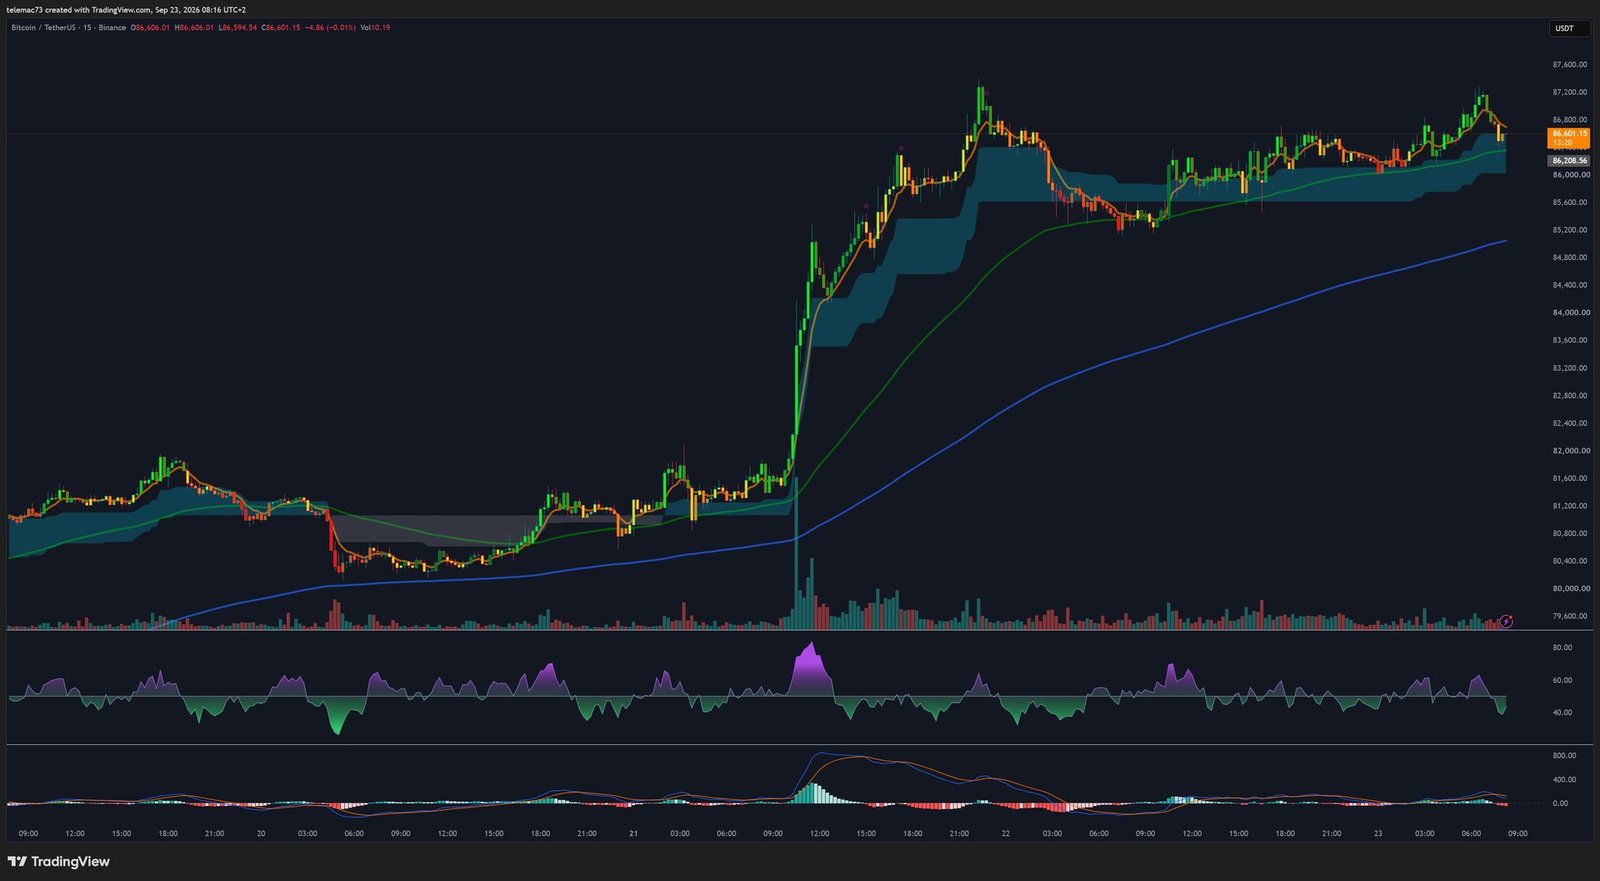
High-frequency observation reveals that the temporary pause in the rally is not translating into aggressive distribution, but instead taking the shape of a bullish continuation pennant, or symmetrical compression triangle. The market is printing descending highs below $87,396 and $86,850, while firmly defending ascending lows between $85,800 and $86,200. The fast moving average is flattening around $86,250 and supporting candle bodies, while the gap versus the slow moving average (near $84,000) indicates a pronounced stretch in intraday momentum, exposing the market to volatility sweeps before any durable directional resolution.
Key levels to watch
| Timeframe | Key level (USD) | Technical category |
|---|---|---|
| Daily (1D) | 96,000 – 100,000 | Major resistance |
| Daily / 4H | 87,400 – 88,000 | Immediate resistance |
| 15 minutes | 86,850 | Intraday pivot |
| 15 min / 4H | 85,500 – 85,800 | Immediate support |
| 4 hours | 82,000 – 82,500 | Polarity support |
| Daily / 4H | 77,500 – 78,500 | Macro structural pivot (200-day MA / Golden Cross) |
| Daily (1D) | 54,000 – 58,000 | Floor support (summer double bottom) |
Oscillators and momentum: overheating on wide horizons, reset on short ones
On the daily chart, the RSI is trading above 72, an overbought level that, during a cycle recovery phase, reflects underlying directional strength while limiting the immediate reward for tactical entries. On the 4-hour horizon, the RSI hit an extreme reading near 85 during the initial break above $86,000, before easing toward 74-76 as price tested $87,396 — a setup that sketches out a classic bearish divergence, with price printing a marginal new high while momentum erodes. On the 15-minute chart, by contrast, intraday RSI has fully reset, falling from a peak above 88 to a neutral zone of 52-55, purging short-term excess.
On the MACD side, the daily structure shows a full bullish expansion, with a Golden Cross validated in late August below the midline, followed by a clean crossing of the zero line and a broadly positive histogram. On the 4-hour timeframe, the lines maintain a clear upward angle, although histogram growth is starting to form a plateau characteristic of passive absorption. On the 15-minute chart, a minor death cross occurred at the top of the compression, with the lines converging horizontally near zero while awaiting a volume catalyst.
| Timeframe | RSI and status | MACD configuration | Signal |
|---|---|---|---|
| 1D | 72-75 (overbought) | Positive lines, rising green histogram | Active Golden Cross, dominant impulse |
| 4H | 74-85 (bearish divergence) | Diverging positive lines, plateauing histogram | Buying momentum losing steam |
| 15m | 52-55 (neutral zone) | Flat lines after a bearish crossover | Compression / waiting neutrality |
Microstructure: what the order book heatmap reveals
The order book liquidity map (1h timeframe, aggregated depth) highlights an asymmetric distribution of passive liquidity. On the sell side (asks), a first band of orders has consolidated between $87,800 and $88,500, forming the immediate ceiling blocking price progression. A second pocket of sell liquidity appears near $90,000, while the largest institutional order wall sits between $96,000 and $100,000 — this corridor marks the main distribution target for large operators.
On the buy side (bids), the book shows a dense accumulation base. A first wall of limit buy orders is positioned between $83,500 and $84,500, followed by a major wall between $80,000 and $82,000. Further down, the deepest layers remain anchored around the former pivot at $74,000–76,000, confirming a protective staircase against sharp corrections.
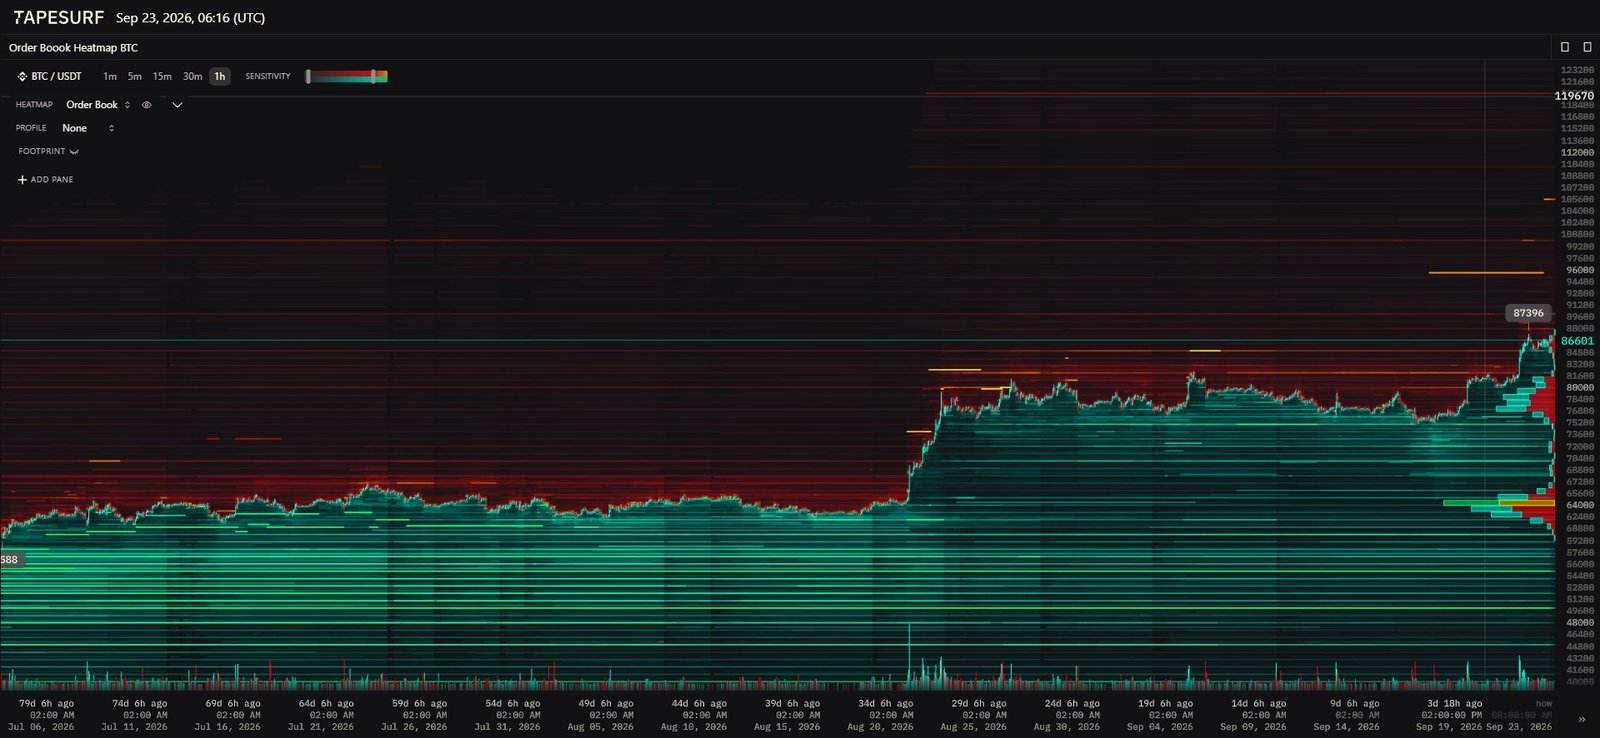
The rapid move from $76,000 to $87,000 was driven by the forced unwinding of short sellers: $648 million worth of short positions were liquidated in 24 hours, including $262 million within a single hour. This forced sweep left a low-volume pocket, or “air pocket,” in the volume profile between $82,500 and $85,000. Should the $88,000 resistance trigger a sharp pullback, price could travel through this intermediate zone with little passive friction, until making contact with buy orders positioned near $82,000.
Derivatives and institutional flows: leverage worth watching
The break above $86,000 triggered a reconfiguration of the futures market. Global open interest rose 7.59% to reach $156 billion, expanding paradoxically during the cascade of short liquidations. This simultaneous expansion of price and open interest shows that the market did not merely purge short positions, but absorbed a new cohort of buyers deploying heavy leverage.
This speculative activity is reflected in funding rates, which turned broadly positive on 24 of the 25 largest global perpetual contracts: long position holders are now paying shorts heavily to maintain their exposure, a structural imbalance that raises the risk of a reversal if new highs fail to materialize for an extended period. Nevertheless, the strength of the move remains supported by substantial spot accumulation: corporate treasury entities such as Strategy (Michael Saylor) have expanded their holdings, acquiring an additional 950 BTC for $76 million and bringing their total portfolio to 846,000 coins. The confirmed reclaim of the 50-week moving average corroborates this underlying trend, a level that has historically marked the definitive close of multi-year correction phases.
Three scenarios for what comes next
Scenario 1 — Bullish breakout and continuation toward $96,000 (45% probability)
- Trigger: a firm 4H close above $87,500, accompanied by aggressive buying volume.
- Target 1: $90,000. Target 2: $96,000–100,000 (major liquidity concentration zone on the heatmap).
- Invalidation: a 4H close below $85,500.
Scenario 2 — Polarity retest and pullback toward $82,000–84,000 (40% probability, preferred scenario)
- Trigger: a break of the lower boundary of the 15m pennant below $85,800.
- Target stabilization zone: the $82,000–84,000 cluster, where major buy walls and the former range high converge.
- Invalidation: a daily close below $80,000.
Scenario 3 — False breakout and deep re-entry (15% probability)
- Trigger: an impulsive break of $82,000 with no buying reaction, confirmed by a daily close below the former resistance.
- Pullback targets: the structural 200-day MA pivot between $77,500–78,500, with a potential extension toward $74,000.
- Invalidation: a daily close above $88,500.
Conclusion
Bitcoin’s structural shift into a bullish market regime is technically established by the volume-backed break of the daily 200-day MA, the deployment of a 4H Golden Cross, and the return to profitability of the entire spot ETF investor base. However, the direct confrontation with the major $88,000 resistance band, combined with an emerging bearish divergence on the 4H RSI and overheated leverage in derivatives markets ($156bn open interest, stretched funding rates), calls for strict execution discipline.
The most measured approach is to avoid any aggressive buying within the current overbought zone ($86,500–87,000) and to favor one of two approaches: wait for confirmation of a 4H close beyond $87,500 to target the liquidity pull toward $96,000–100,000, or exploit a corrective pullback toward the dense support at $82,000–84,000 to consider long positions benefiting from technical confluence and optimal order-book depth.
Disclaimer: this article is provided for purely informational and educational purposes. It does not constitute investment advice, a recommendation to buy or sell, or a solicitation to trade digital assets. Cryptocurrency markets are volatile and carry the risk of capital loss. Always do your own research (DYOR) and consult a qualified financial advisor before making any investment decision.

