


On September 18, 2026, Bitcoin (BTC/USDT) trades at $77,543, up 1.47% on the session. This rebound follows one of the most tense weeks of the month: a legislative setback in Washington, a Federal Reserve rate hike, and a wave of liquidations across derivatives markets. Yet the market’s technical structure suggests this stress phase may already be behind it.
A double macroeconomic shock absorbed without a crack
Bitcoin’s recent trajectory has been shaped by a confluence of events between September 15 and 17. The first setback came on September 15, when the Digital Asset Market CLARITY Act stalled in the US Senate, falling short of the 60-vote threshold on a 49-50 cloture vote. Disagreements centered on rules governing senior officials’ digital holdings and on stablecoin competition with traditional bank deposits. The setback pushed a comprehensive federal regulatory framework beyond the midterm elections, triggering more than $600 million in long liquidations across derivatives platforms.
On September 16, the Federal Reserve added to the pressure by raising its benchmark rate 25 basis points to a 3.75%-4.00% target range under Kevin Warsh — the first hike since 2023. The hawkish tone, driven by sticky inflation and rising oil prices, pushed 10-year Treasury yields to their highest level since 2007, strengthened the dollar, and triggered combined net outflows of $592 million from Spot Bitcoin and Ethereum ETFs.
| Event | Date | Observed impact on BTC |
|---|---|---|
| CLARITY Act cloture vote fails | September 15, 2026 | > $600M in long liquidations |
| Fed rate hike (+25 bps to 4%) | September 16, 2026 | Initial pullback to $75,000; $592M net ETF outflows |
| Corporate treasury purchase (Strive) | September 17-18, 2026 | Acquisition of 25,000 BTC; absorbs sell flow |
| Strategic BTC Reserve progress | September 17, 2026 | Committee approval; sentiment recovery |
Despite this double shock, price held the $75,000 psychological support, signaling a structural shift in market behavior. Panic selling was absorbed by institutional spot buyers: corporate treasury firm Strive acquired 25,000 BTC, alongside legislative progress in the House of Representatives on a bill codifying a Strategic Bitcoin Reserve.
Order book microstructure: an asymmetry favoring buyers
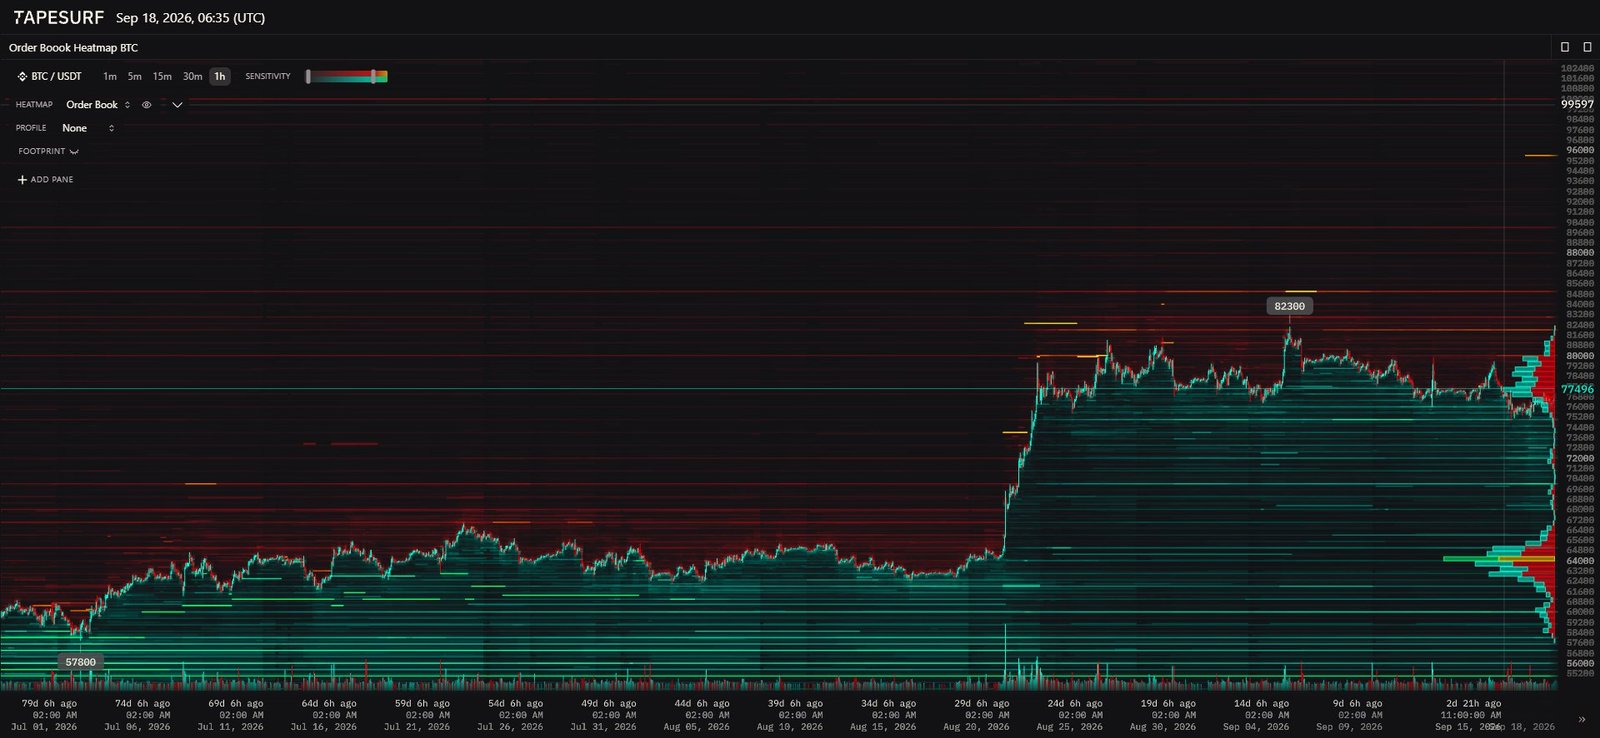
The Tapesurf order book heatmap for BTC/USDT, aggregated over a one-hour window, reveals a liquidity architecture clearly tilted to the upside. The $74,000-$76,000 price band shows a dense concentration of buy limit orders, which acted as a shock absorber during the sell-off triggered by the Fed’s announcement. The volume profile confirms that heavy market selling was absorbed without breaking market structure. Lower down, the $57,800 floor marks the base of the annual cycle, while the $64,000-$68,000 shelf forms a secondary support zone.
By contrast, the sell side shows a relative liquidity void between $78,000 and $80,500, ahead of a dense sell-limit wall stacked at $82,390. This configuration positions that level as a priority magnet: the absence of friction between $78,000 and $80,500 could allow for rapid price expansion on bullish confirmation, while $82,390 would act as a magnet for short covering.
| Price segment | Book density | Function |
|---|---|---|
| $74,000 – $76,000 | High (bids) | Institutional absorption zone, defensive base |
| $78,000 – $80,500 | Low | Liquidity void, rapid expansion possible |
| $82,390 – $82,800 | Very high (asks) | Attraction pole, short-covering zone |
| $84,000 – $88,000 | Moderate to high | Macro profit-taking |
| $96,000 – $99,597 | Maximum | Terminal resistance before $100,000 |
Multi-timeframe read: daily, 4-hour and 15-minute
Daily timeframe: correction running out of steam
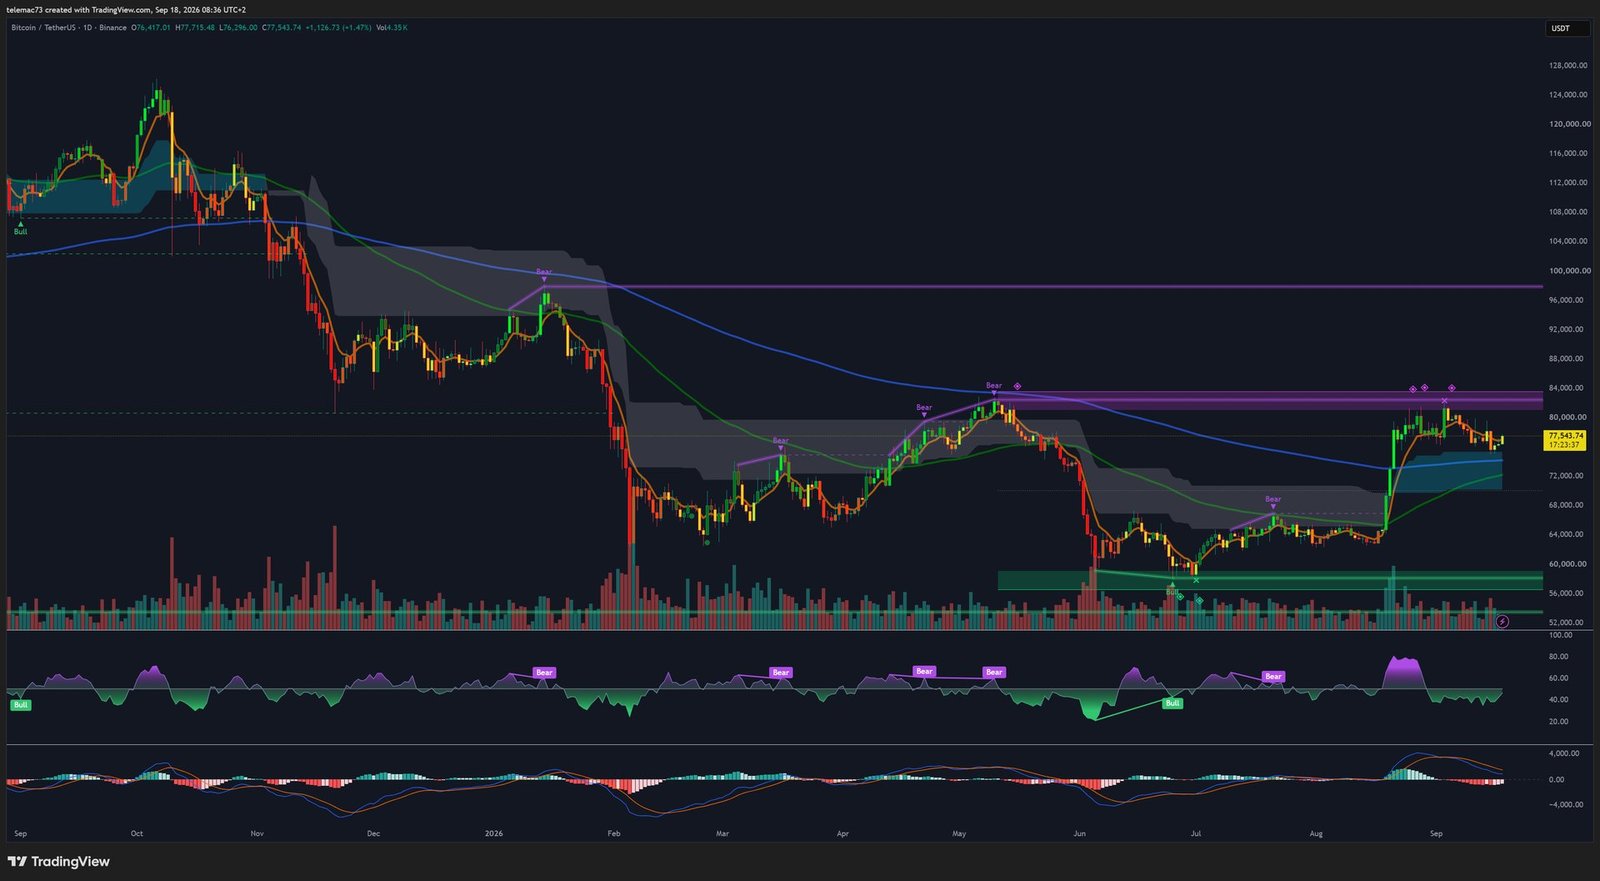
The daily chart frames the current consolidation within the broader move from October 2025’s all-time high of $126,198 down to summer 2026’s cyclical low of $58,000. August’s impulsive move (+25%) had driven prices up to $82,400 before September’s seasonal contraction triggered an orderly round of profit-taking. The September 18 candle sits firmly in positive territory, with a strong rejection of lower wicks.
Price remains positioned above the short-term moving average ribbon. Above current levels, the 200-day moving average, still sloping down from the 2025 highs, is converging toward the $84,000-$85,000 corridor — a dynamic resistance whose breakout could signal the start of a new expansion phase. The daily RSI (50.8-52.0) has purged the summer’s overbought condition without slipping into oversold territory, while the MACD histogram shows a marked deceleration in selling pressure.
4-hour timeframe: bullish flag breakout
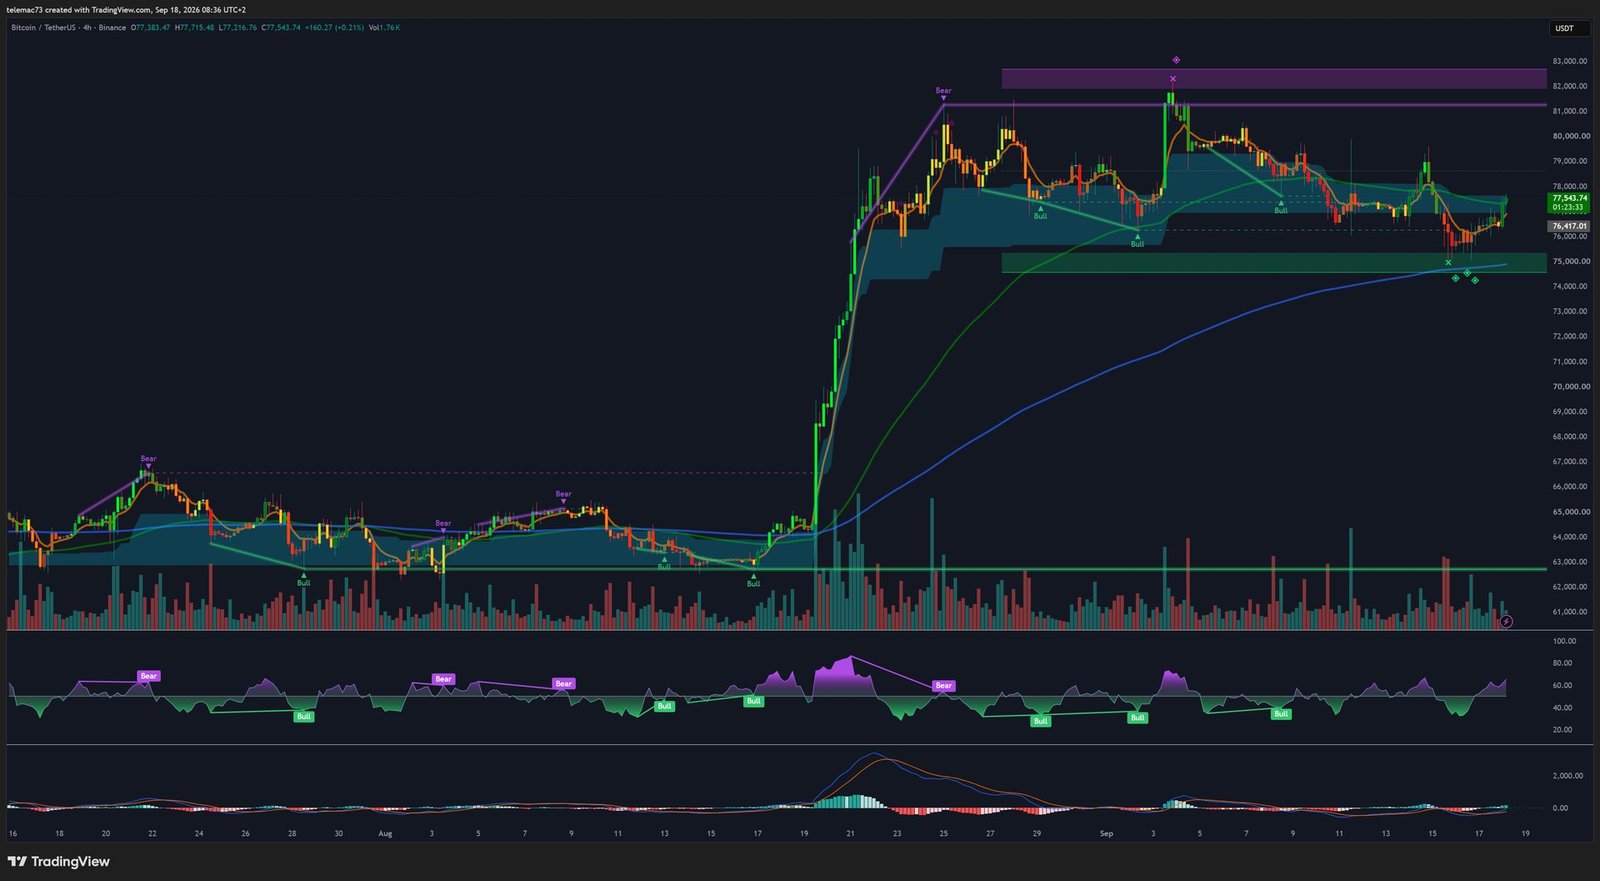
The 4-hour chart reveals a textbook bullish continuation setup: the corrective phase below the $82,390 top channeled price inside a descending wedge (bull flag), whose upper boundary has just been broken. The breakout rests on several technical confluences: a precise rejection of the 200-period EMA (~$74,800) aligned with a bullish order block, a bullish MACD divergence between the September 12 pullback and the post-Fed low on September 16, and a 4H RSI advancing from 32 to 53, crossing above its midline. Reclaiming the $76,417 central pivot validates this reversal pattern.
15-minute timeframe: intraday dynamics
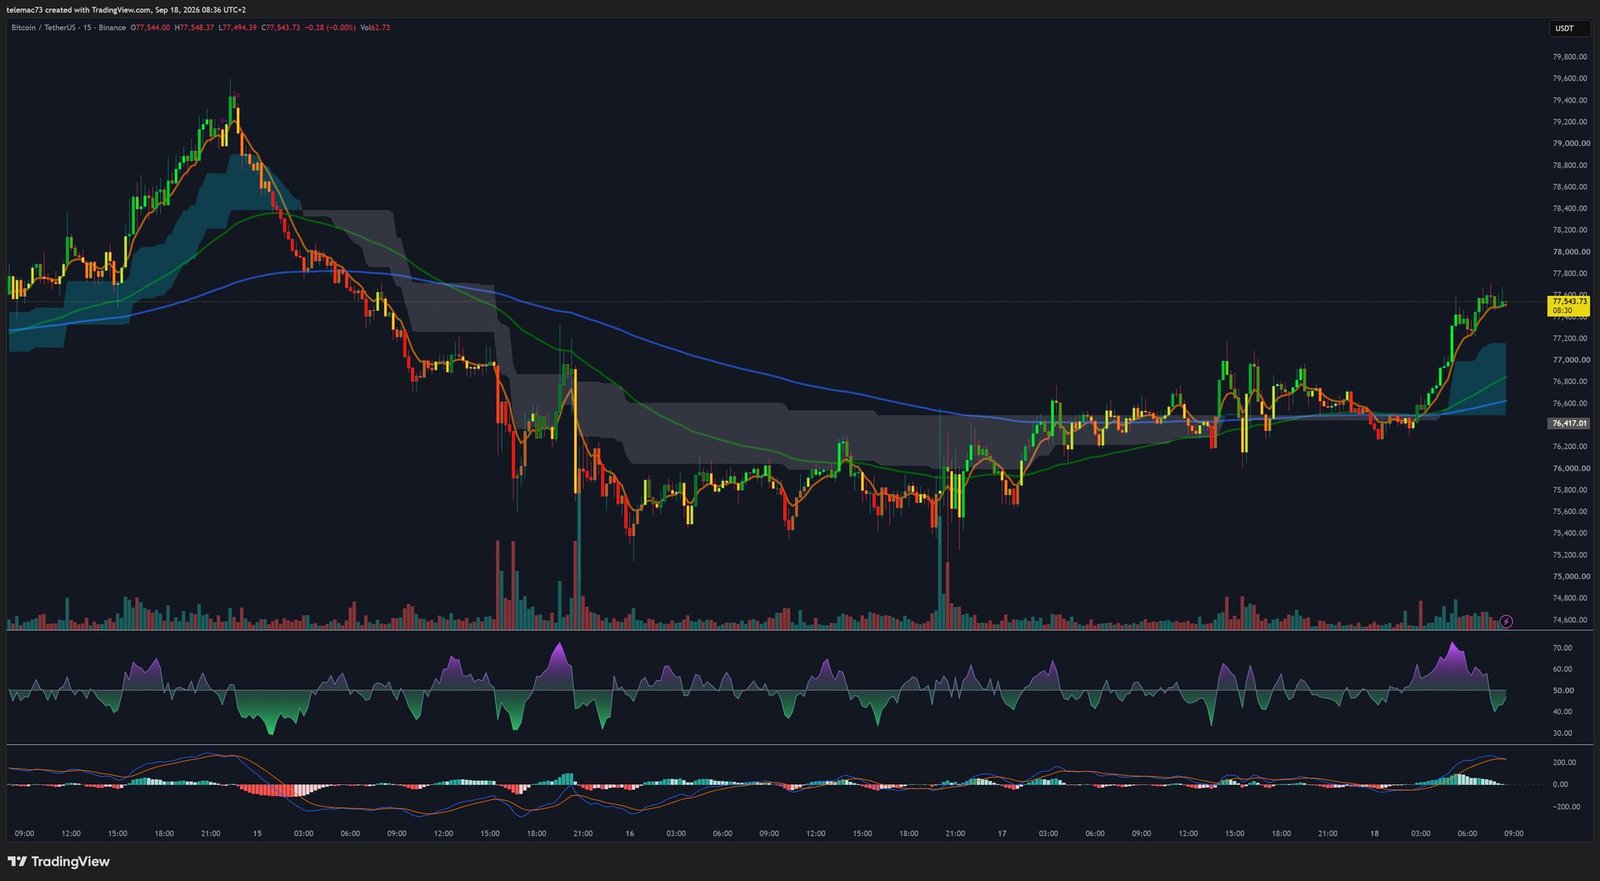
On the short-term horizon, price action built a rounding-bottom accumulation pattern above the $75,600 intraday support during the September 16-17 sessions. The overnight acceleration into September 18 broke through the $76,600 resistance with a noticeable expansion in buying volume. The fast moving-average ribbon flipped into a bullish fan, and the 15-minute MACD remains positioned above its zero line, indicating buying flow remains the session’s dominant driver.
Key technical level matrix
| Level | Designation | Confluence |
|---|---|---|
| $88,000 – $96,000 | Major resistance (R4) | 61.8% Fibonacci extension; institutional wall |
| $84,000 – $85,000 | Pivot resistance (R3b) | Descending 200-day moving average |
| $82,390 – $82,800 | Key resistance (R3a) | August rally top; dense sell wall |
| $80,600 – $81,000 | Intermediate resistance (R2) | Upper distribution boundary |
| $78,000 – $78,600 | Immediate resistance (R1) | Intraday congestion |
| $77,543.74 | Current price (spot) | September 18 European open |
| $76,417.01 | Major central pivot | Breakout neckline |
| $75,800 – $76,000 | Immediate support (S1) | Rounding-bottom retest |
| $74,800 – $75,400 | Critical support (S2) | 4H 200 MA; bullish order block |
| $72,000 – $73,500 | Secondary support (S3) | Pre-summer-rally accumulation base |
| $66,400 – $69,000 | Structural support (S4) | 61.8% Fibonacci retracement of the 58k-82k move |
| $57,800 – $58,000 | Annual floor (S5) | Summer 2026 cyclical low |
Three scenarios for the sessions ahead
- Bullish continuation (estimated probability: 65%) — Triggered by a 4H close above $77,800, targeting $82,390-$82,800, with a possible extension toward $84,000-$85,000. Invalidated by a 4H close below $76,417.
- Range compression (25%) — A rejection below $78,600 would send price back into an oscillation between $75,800 and $80,500, without challenging the underlying uptrend as long as $74,800 holds on a daily close.
- Secondary capitulation (10%) — Would require an exogenous macro deterioration (a spike in bond yields, accelerating ETF redemptions) confirmed by a daily close below $74,800, risking an extension toward $72,000-$73,500, or even $66,400 in the event of prolonged panic.
Conclusion
As of September 18, 2026, Bitcoin has turned a phase of monetary and regulatory stress into a demonstration of institutional absorption. The convergence of a 4-hour continuation wedge, a bullish MACD crossover, the defense of the daily RSI midline, and a passive-order void up to $82,390 gives buyers a technical edge — as long as the $74,800 threshold holds as the invalidation line.
Disclaimer: this article is provided for informational and educational purposes only. It does not constitute investment advice, a recommendation to buy or sell, or a solicitation to trade digital assets. Cryptocurrency markets are highly volatile and involve a risk of capital loss. Do your own research and consult a licensed financial advisor before making any investment decision.

