


On September 17, 2026, Bitcoin is navigating one of the most decisive phases of its annual cycle. After a historic peak of $82,360 in late August, the asset suffered a 3.3% pullback within 24 hours, dragging the price into a strategic compression zone between $76,400 and $76,580. This retreat, triggered by the unexpected convergence of tighter U.S. monetary policy and a legislative setback in the Senate, is now testing the institutional support at $74,500 — a level that could well determine the market’s trajectory for months to come.
A Double Shock From Washington
The September 15-16 sell-off stems from two distinct but concurrent events. First, the U.S. Federal Reserve raised its benchmark rate by 25 basis points to a range of 3.75%-4.00% — the first hike since 2023. Fed Chair Kevin Warsh struck a distinctly hawkish tone, stating that underlying inflation had remained too high for too long. The accompanying dot plot came in tougher than expected: 12 of 18 participants still project another hike before year-end, PCE inflation forecasts for 2026 were raised to 3.7%, and the return to the 2% target has been pushed back to 2029.
This monetary firmness immediately rattled bond markets: the 2-year Treasury yield climbed to 4.74% while the 10-year briefly topped 5%, strengthening the dollar index by 0.74% and weighing on non-yielding risk assets.
Second, the U.S. Senate rejected, by a vote of 50 to 49, cloture on the CLARITY Act — the bill meant to clarify the legal status of digital assets between commodities and securities. Falling short of the 60-vote threshold, the bill is now unlikely to pass before 2027, with the legislative calendar dominated by the upcoming midterm elections.
The impact on institutional flows was immediate: spot Bitcoin ETFs saw net outflows of $450.33 million on September 15 — their worst session since late June — while spot Ethereum ETFs lost $141.47 million, bringing two-day cumulative outflows to roughly $592 million. On the derivatives side, $224.81 million was liquidated within 24 hours, including $190.10 million in long positions. On a more encouraging note, open interest held nearly steady at $52.26 billion (+0.30%), suggesting the market’s infrastructure is absorbing the deleveraging without a broad-based capitulation.
The Underlying Trend: A Daily Bull Flag Still Intact
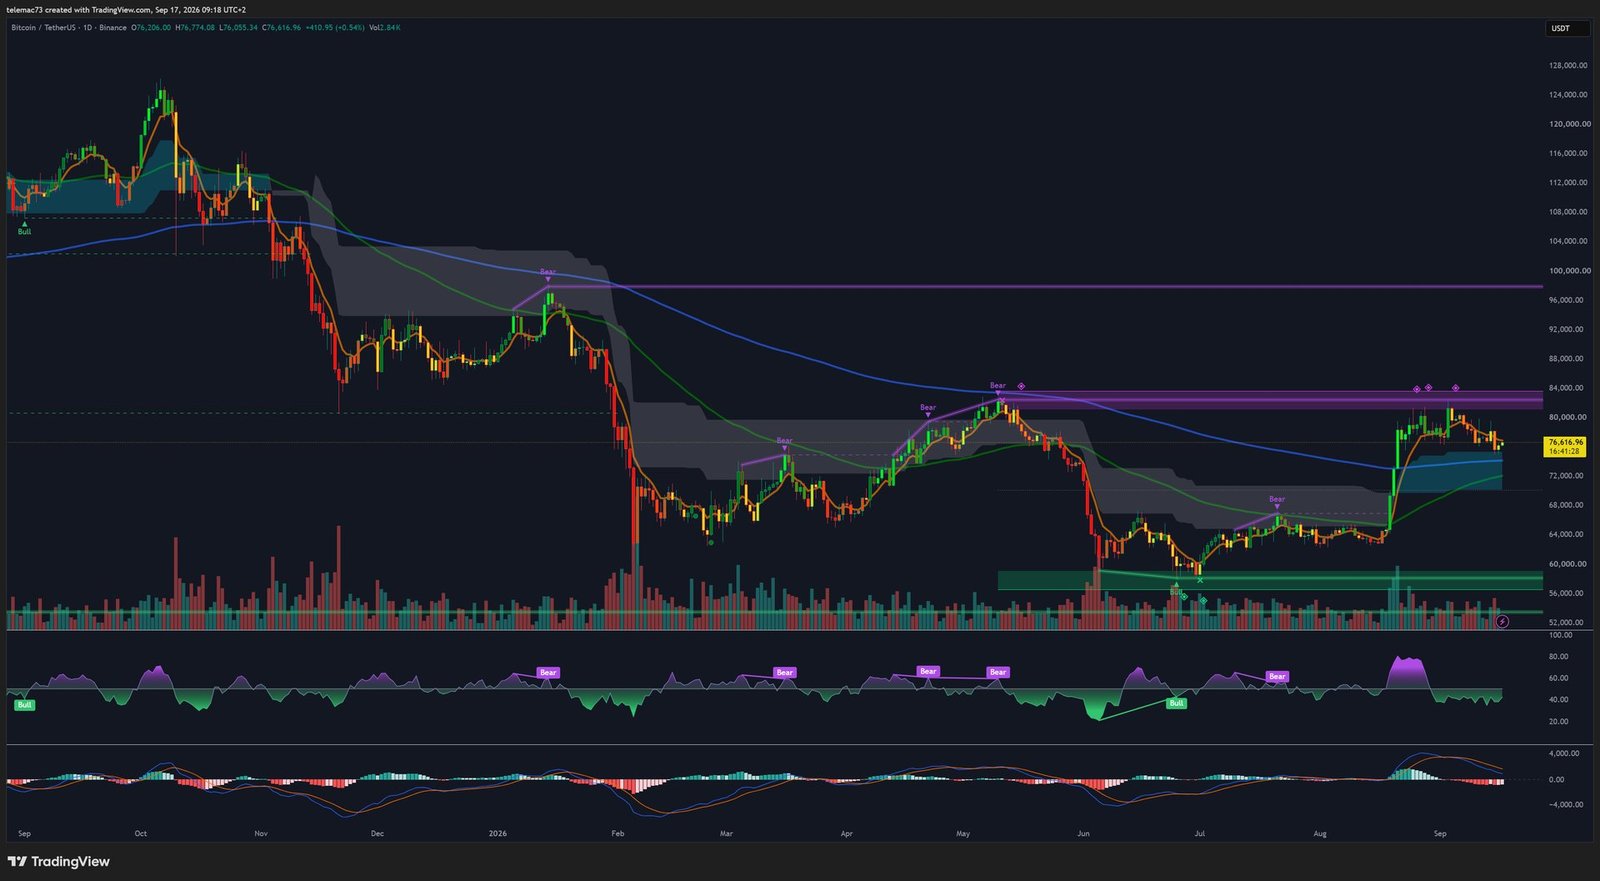
On the daily timeframe, Bitcoin remains within the secular trajectory that began after the October 2025 all-time high of $126,198. Following a long distribution phase and a consolidation between $56,000 and $60,000 through June and July, the explosive rally of late August drove price up to $82,360, triggering a Golden Cross along the way (the 50-day EMA crossing above the 200-day EMA).
The daily 200-EMA, once a ceiling of resistance, has since flipped into structural support around $74,500-$74,800. The chart pattern traces a large bull flag: the flagpole is the $22,000 vertical rally of August, while the flag itself takes the shape of a descending channel bounded by a diagonal resistance near $82,360 and horizontal support between $74,000 and $75,200.
| Indicator (1D) | Reading | Interpretation |
|---|---|---|
| Spot price BTC/USDT | $76,516 | Consolidating above major support |
| EMA 50 | ~$72,800 (rising) | Bullish alignment after Golden Cross |
| EMA 200 | ~$74,500-$74,800 | Testing primary dynamic support |
| RSI (14) | 52.4 | Overbought excess cleared, no oversold signal |
| MACD | Positive lines, flat histogram | Momentum decelerating, no bearish cross |
| 24h spot volume | $37.42B | Contraction typical of a bull flag |
The daily RSI, which peaked above 78 during the rally to $82,360 (a distribution signal), has since eased to 52 without ever entering structural oversold territory. The MACD contracted toward the zero line, reflecting a slowdown in summer momentum without producing a bearish « death cross. » As long as daily closes hold above $74,500, the structure remains technically constructive for a fresh attempt at $82,000, with a symmetrical projection toward $95,000.
4-Hour Timeframe: Bouncing Off the 200-EMA Inside a Falling Wedge
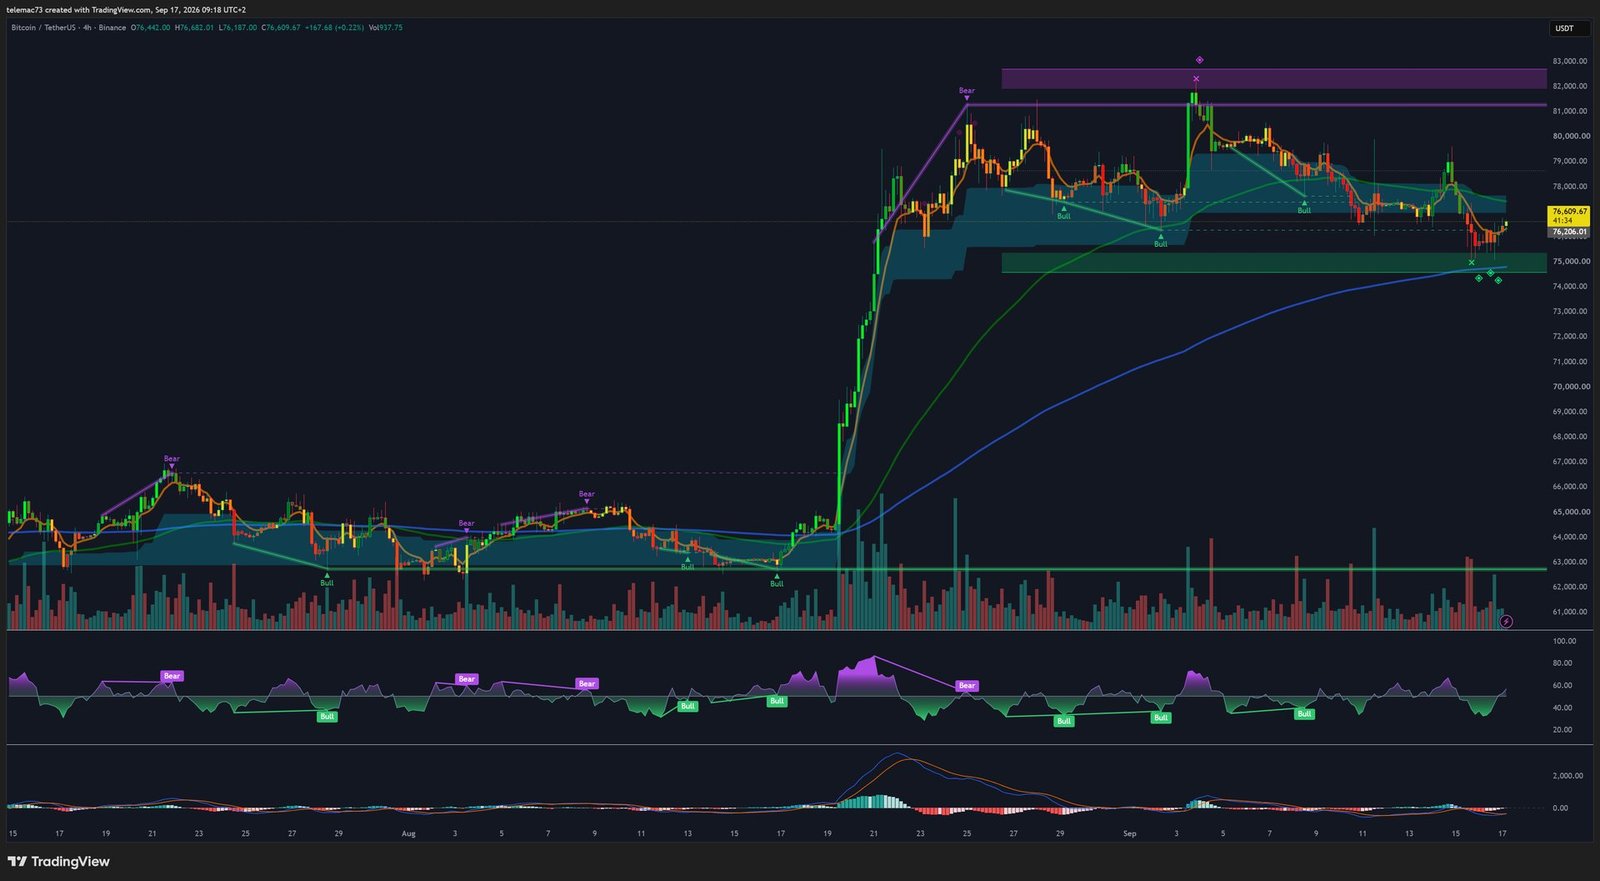
On the 4-hour chart, the correction following the failed breakout above $79,600 has taken the shape of a classic falling wedge, with converging lower highs and lower lows. The September 16 sell wave pushed price directly into the 4H 200-EMA, exactly where it converges with horizontal support at $74,750. That confluence triggered an immediate buying reaction, preventing any extended breach of the support.
| 4H structure zone | Level | Status |
|---|---|---|
| Wedge upper boundary | $79,600-$80,000 | Institutional selling pressure |
| Median axis / pivot | $77,200-$77,500 | Immediate dynamic resistance (EMA 50) |
| Current fixation level | $76,409-$76,600 | Post-bounce consolidation |
| Absorption floor | $74,750-$75,000 | Aggressive defense, EMA 200 confluence |
The 4H RSI, which dropped to 28 during the test of $74,750 (oversold territory), rebounded to 46, tracing an early bullish divergence. The 4H MACD histogram shows a clear upward inflection, with negative bars shrinking — a pattern that often precedes a short-term reversal. The 4H 50-EMA, currently sloping down toward $77,200, stands as the key intermediate resistance to clear to confirm an upside break of the wedge.
Intraday Microstructure: Compression on the 15-Minute Chart
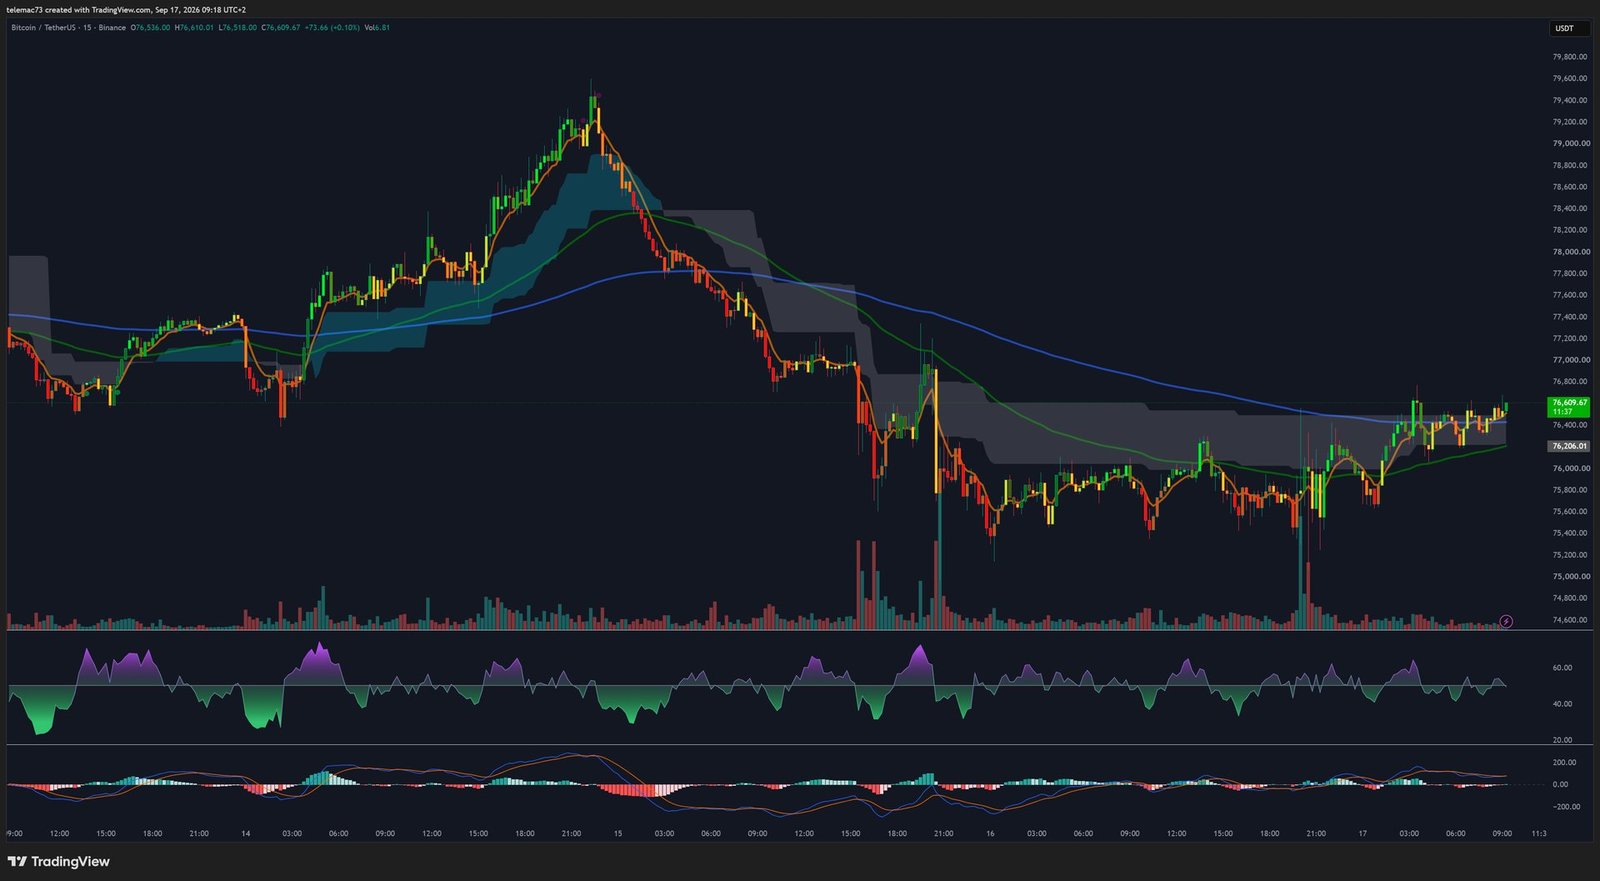
On the 15-minute chart, the market is digesting the September 16 liquidation cascade. After touching $74,750, price staged a quick technical recovery to $76,500 before entering a sideways phase bounded by support at $75,800 and resistance at $76,600 — a symmetrical compression triangle reflecting a temporary balance between sellers closing positions and cautious spot buyers.
The 15-minute RSI, which had collapsed below 18 during the flush, has recovered to 54, indicating a full normalization without any immediate bullish excess. A 15-minute close above $76,600 accompanied by expanding volume would confirm a breakout of the triangle toward $77,200, while a break below $75,800 would expose the order book to renewed selling pressure.
Liquidity Mapping: Where the Big Orders Sit
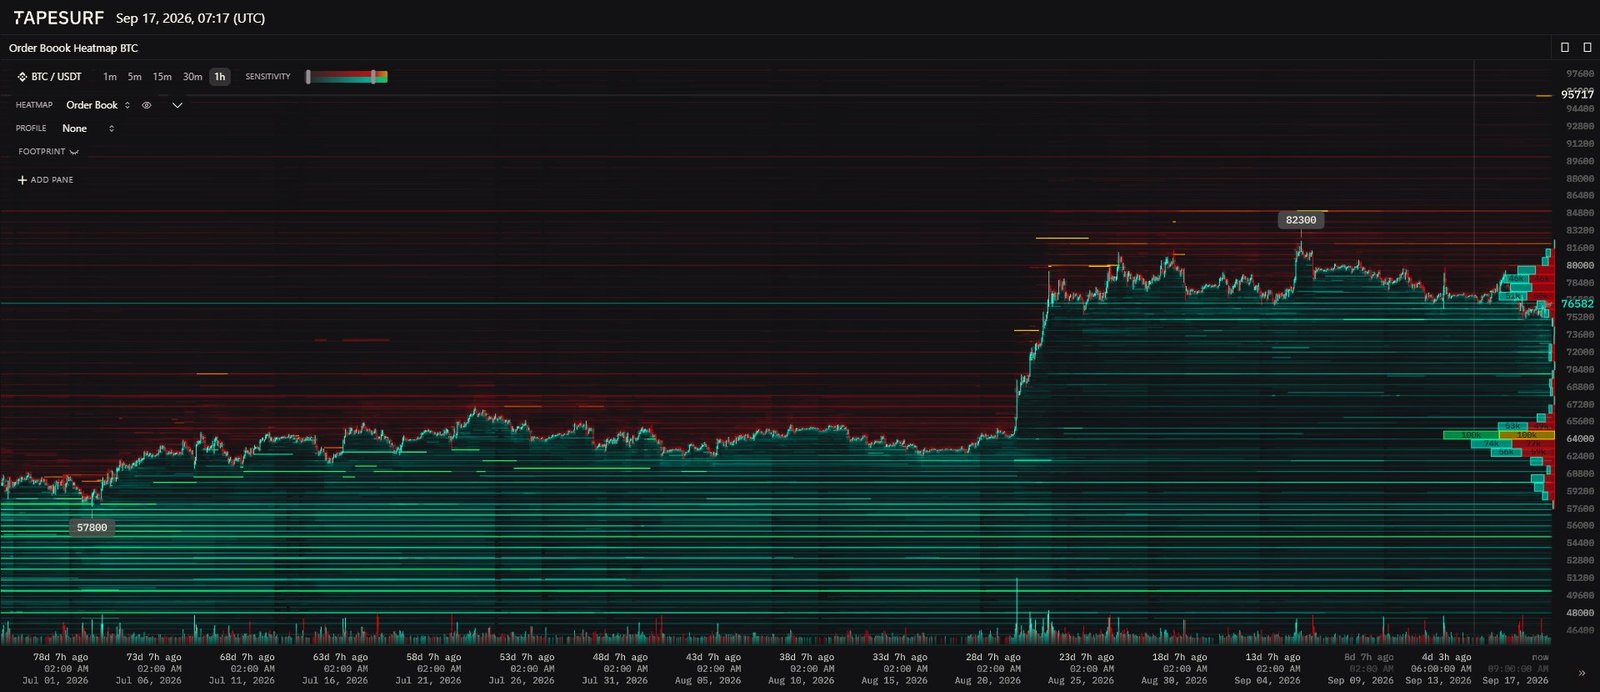
The order book liquidity heatmap confirms the stabilizing role of the passive buy wall between $74,500 and $75,000 — precisely where the forced-selling flow from liquidations was fully absorbed. Above the market, sell-side liquidity is stacked in layers at $78,500, $80,000, and especially between $82,000 and $82,360. A particularly large sell order sitting at $95,717 confirms that large players maintain a profit-taking grid extending toward six-figure territory.
| Price level | Order type | Function |
|---|---|---|
| $95,000-$95,717 | Asks (sell) | Upper institutional wall, macro target |
| $82,000-$82,360 | Asks (sell) | Local top resistance |
| $78,000-$78,500 | Asks (sell) | First obstacle to a 4H wedge breakout |
| $74,500-$75,000 | Bids (buy) | Institutional sponge that absorbed liquidations |
| $72,000-$72,500 | Bids (buy) | Backup pullback level |
| $57,800-$60,000 | Bids (buy) | Macro capitulation base from August 2026 |
Three Scenarios for the Fall
Bullish Scenario: Triangle Breakout and Wedge Resolution
A 15-minute close above $76,800 would confirm a bullish breakout of the intraday triangle, pushing price toward the 4H 50-EMA at $77,200-$77,500. A 4-hour close beyond $77,500 would validate the wedge breakout, triggering mechanical short covering toward $78,500, followed by a retest of $82,360 — a necessary step before any extension toward $95,000. Invalidation: a 4H close below $75,600.
Bearish Scenario: Structural Support Break
If continued monetary tightening and bond yields near 5% keep draining spot liquidity, a confirmed daily close below $74,500 would break both the 200-EMA and the institutional floor, triggering a new wave of margin calls toward $72,000-$72,500, or even a prolonged capitulation back into the summer range near $60,000. Invalidation: a 4H close above $78,000.
Neutral Scenario: Sideways Attrition
This scenario favors a narrow horizontal drift between $75,000 and $77,500 over the coming sessions, allowing the market to absorb post-FOMC and post-CLARITY Act volatility while the daily RSI stabilizes near 50. In this setup, institutional players would accumulate on dips toward $74,800 while trimming positions near $77,200-$77,500.
Conclusion
The September 16-17, 2026 correction looks more like a healthy flush of speculative leverage than a structural breakdown of the yearly uptrend. The rigorous defense of the $74,500-$75,000 institutional support, backed by a substantial passive buy wall and the daily 200-EMA, gives the market an asymmetric technical bias that still favors buyers over the medium term. A break above $77,500 resistance would be the key signal to confirm an expansive recovery, while a daily close below $74,500 would call the entire post-summer bullish structure into question.
Disclaimer: This article is provided for informational and educational purposes only. It does not constitute investment advice, a recommendation to buy or sell, or an invitation to take any market position. Cryptocurrencies are highly volatile assets, and any investment decision should be preceded by independent research and, where appropriate, consultation with a qualified financial advisor.

