


Bitcoin is trading at 77,640 USDT as of September 14, 2026, sitting in a strategic compression zone after tagging a local high of 82,300 USDT following a nearly 25% bullish impulse deployed since late August. Structurally, the market is validating a healthy reaccumulation phase above the 76,000–76,840 USDT technical support, absorbing institutional profit-taking while decompressing its overbought oscillators ahead of two major upcoming volatility shocks.
The dominant technical posture remains bullish over the medium term, underpinned by a Golden Cross of the major moving averages on the daily timeframe and by the preservation of a higher-lows structure on the four-hour horizon. The market’s current behavior resembles a spring compressing inside a bull flag: passive buy orders accumulated between 75,500 and 76,500 USDT form a robust defensive floor, while overhead sell-side liquidity is temporarily capping price beneath the psychological 80,000 USDT threshold and the historical 82,300 USDT resistance.
This transitional phase reflects institutional capital absorbing the residual supply left over from a $750 million leveraged-position purge, while awaiting macroeconomic confirmation. Two major events will in fact determine the directional resolution of this structure: the U.S. Senate’s procedural vote on the CLARITY Act on September 15, and the Federal Reserve’s FOMC monetary policy meeting on September 15–16.
Daily Timeframe: A High-Reliability Golden Cross
The daily (1D) horizon highlights a structural regime shift away from the bear market that began at the late-2025 all-time high near 128,000 USDT. After building a cyclical accumulation floor between 56,000 and 60,000 USDT during June and July 2026, price staged a clean bullish break of all its descending resistances, printing an annual high of 82,300 USDT before beginning the orderly pullback currently underway.
The dominant technical signal is a confirmed Golden Cross: the 50-day EMA (~68,500 USDT, rising) has crossed above the 200-day SMA (~72,400 USDT), formalizing the resumption of the primary uptrend and turning the former 72,000–74,000 USDT congestion zone into a highly reliable macro inflection base. The daily RSI (14) has cooled off constructively, moving from an overbought peak above 82 points down to a current reading of 62.5 — a correction driven by time rather than by a violent price decline. The MACD keeps its lines solidly anchored in positive territory, though the histogram shows an initial flattening beneath the 82,000–84,000 USDT institutional resistance band.
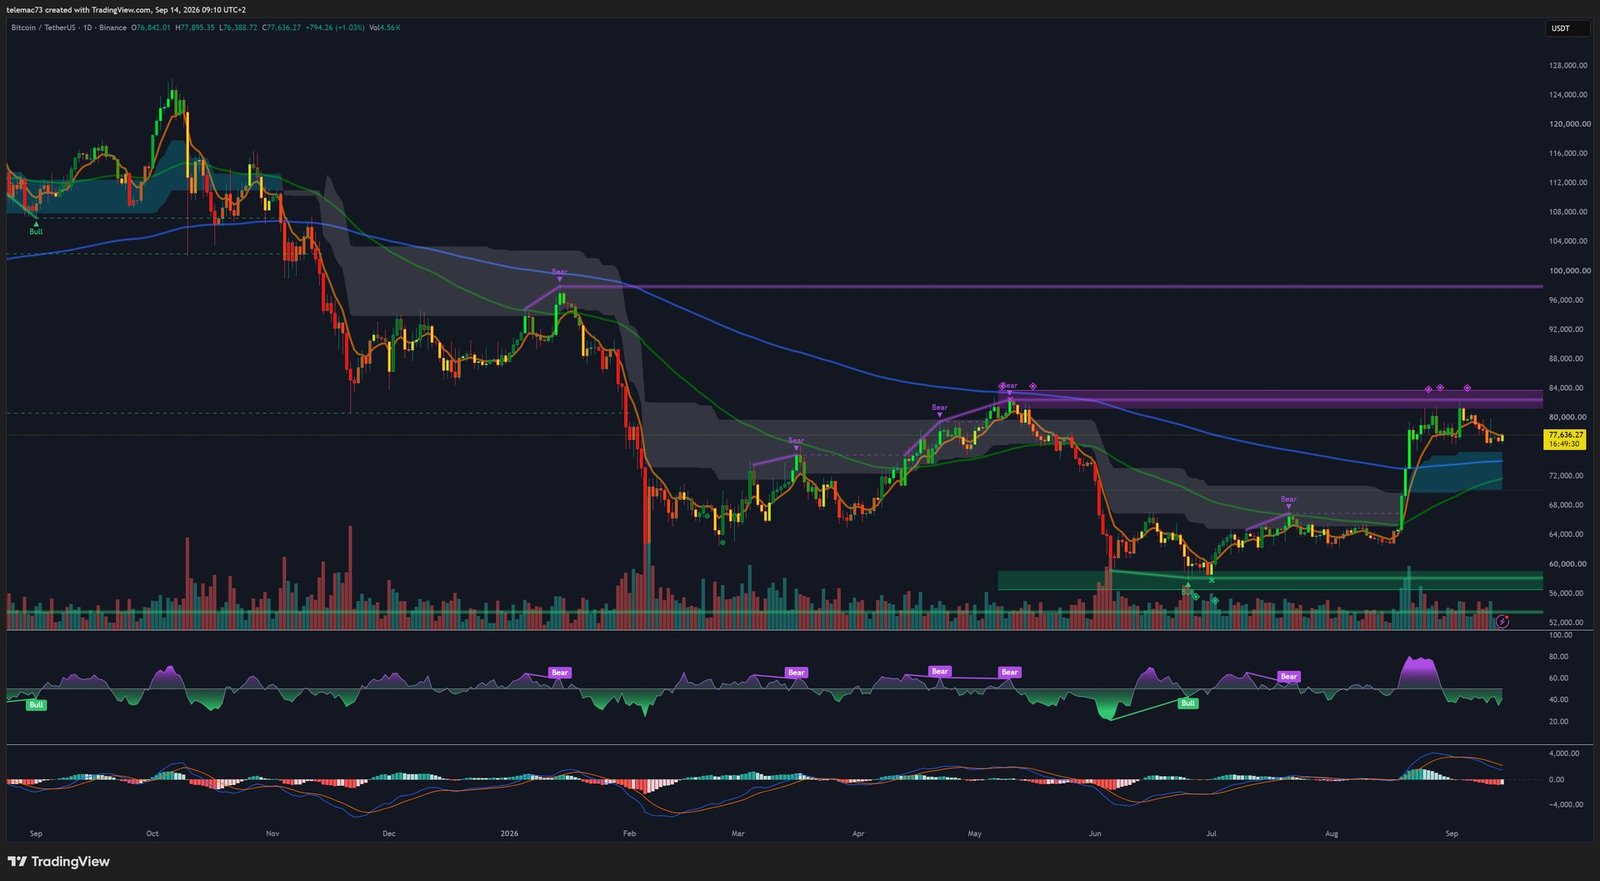
| Key level | Zone (USDT) | Strategic implication |
|---|---|---|
| Main 1D resistance | 82,000 – 84,000 | Institutional profit-taking |
| Macro pivot / floor zone | 72,000 – 74,000 | Uptrend invalidation level |
| 200-day SMA (Golden Cross) | ~72,400 | Long-term structural support |
| 50-day EMA | ~68,500 | Intermediate trend support |
The Four-Hour Bull Flag
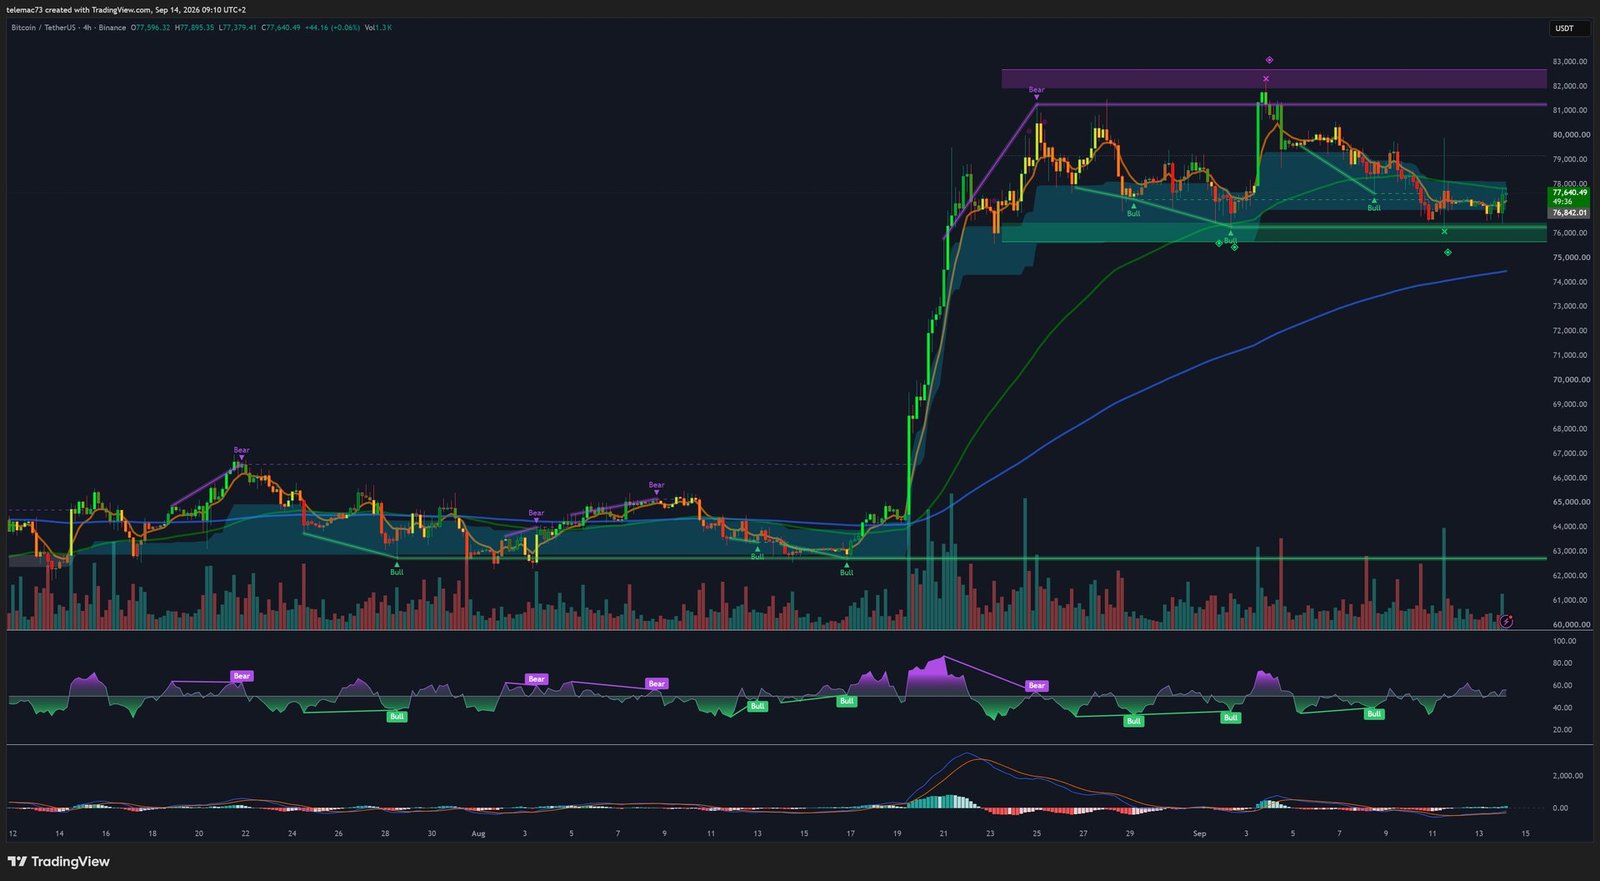
The four-hour chart is shaping a continuation pattern in the form of a bull flag. The pole of the pattern originates from the vertical impulsive leg launched at 64,000 USDT, while the flag’s body encloses a sequence of descending highs that began with the rejection at 82,300 USDT. Downside incursions have been consistently contained by the demand zone identified between 76,000 and 76,842 USDT.
The post-top pullback produced a short-term Death Cross between the fast and intermediate EMAs, compressing price below 78,500 USDT. However, the structural 4H moving average (~74,500 USDT, rising) is providing direct dynamic support to the lower boundary of the channel. The 4H RSI sits at 48.2 points after bouncing precisely off the critical 38 threshold — a classic algorithmic buy signal forming a hidden bullish divergence. The 4H MACD shows a continuous deceleration of its selling histogram, foreshadowing an imminent bullish crossover should the descending trendline at 78,800 USDT be broken.
15-Minute Microstructure: The Footprint of Institutional Buyers
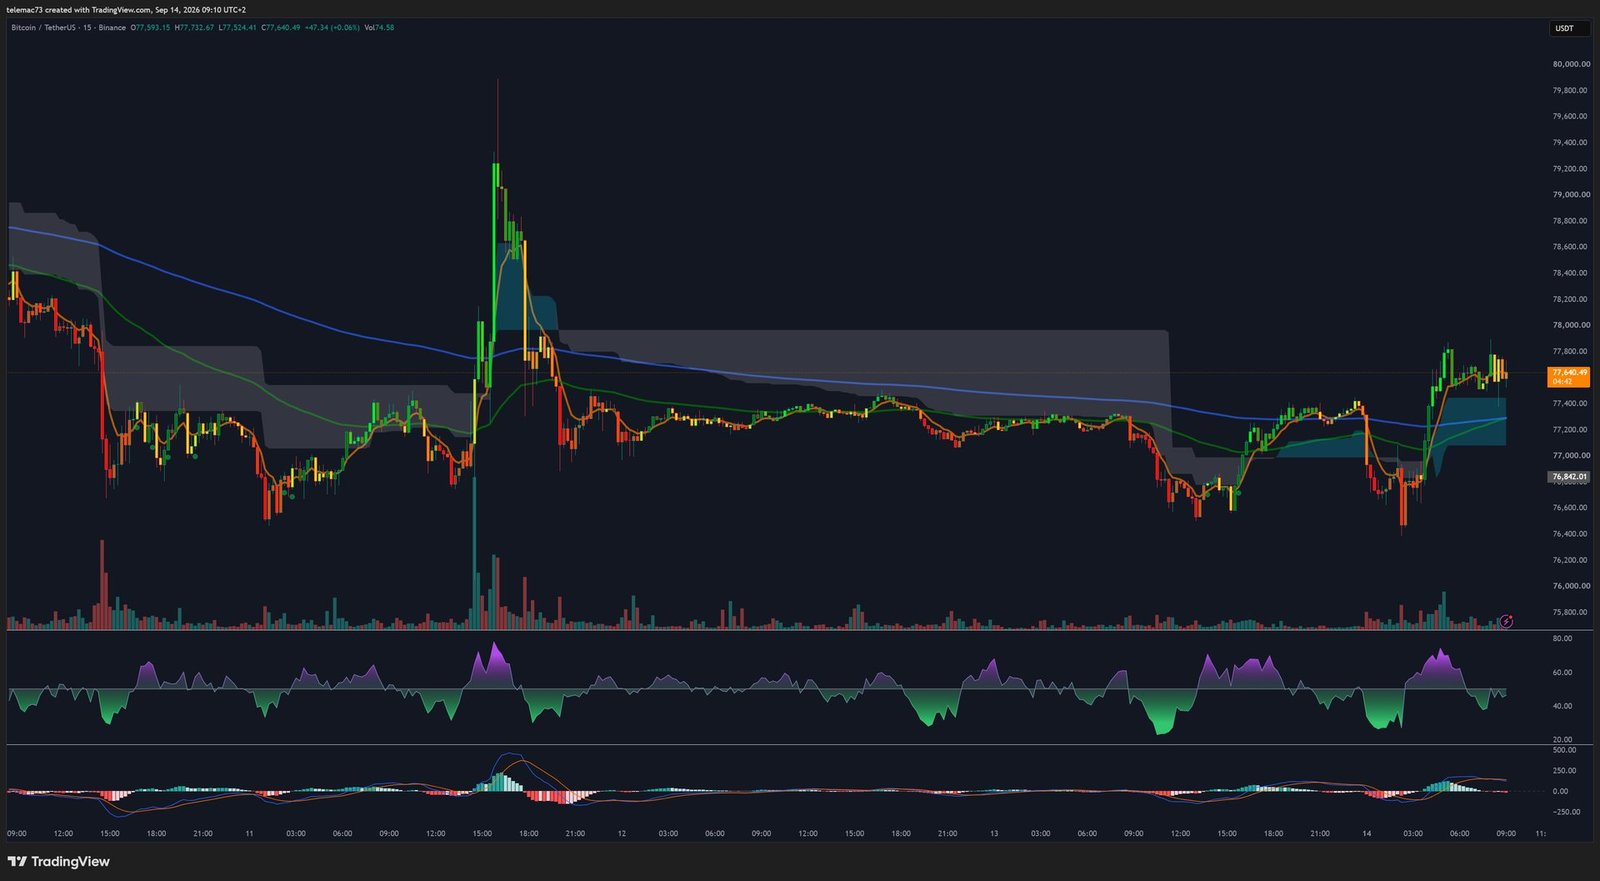
The 15-minute horizon documents order-flow microstructure following an unusually violent liquidity sweep: the market suffered a sharp downside liquidation from 80,000 USDT down to 76,500 USDT, a level where passive buy orders fully absorbed the excess supply, triggering an immediate rebound into the 77,200–77,800 USDT consolidation channel.
Price is currently trading right at its intraday point of control (local VWAP). The 15m EMA 20 and EMA 50 have flattened and interwoven between 77,400 and 77,550 USDT, reflecting extreme volatility compression within a short-term symmetrical triangle. The 15m MACD has just printed a clean Golden Cross above its zero line, while the 15m RSI reads 54.6 points, confirming steady upward momentum after exiting the marked oversold zone reached at the intraday low of 76,500 USDT.
Order Book: An Asymmetric Liquidity Architecture
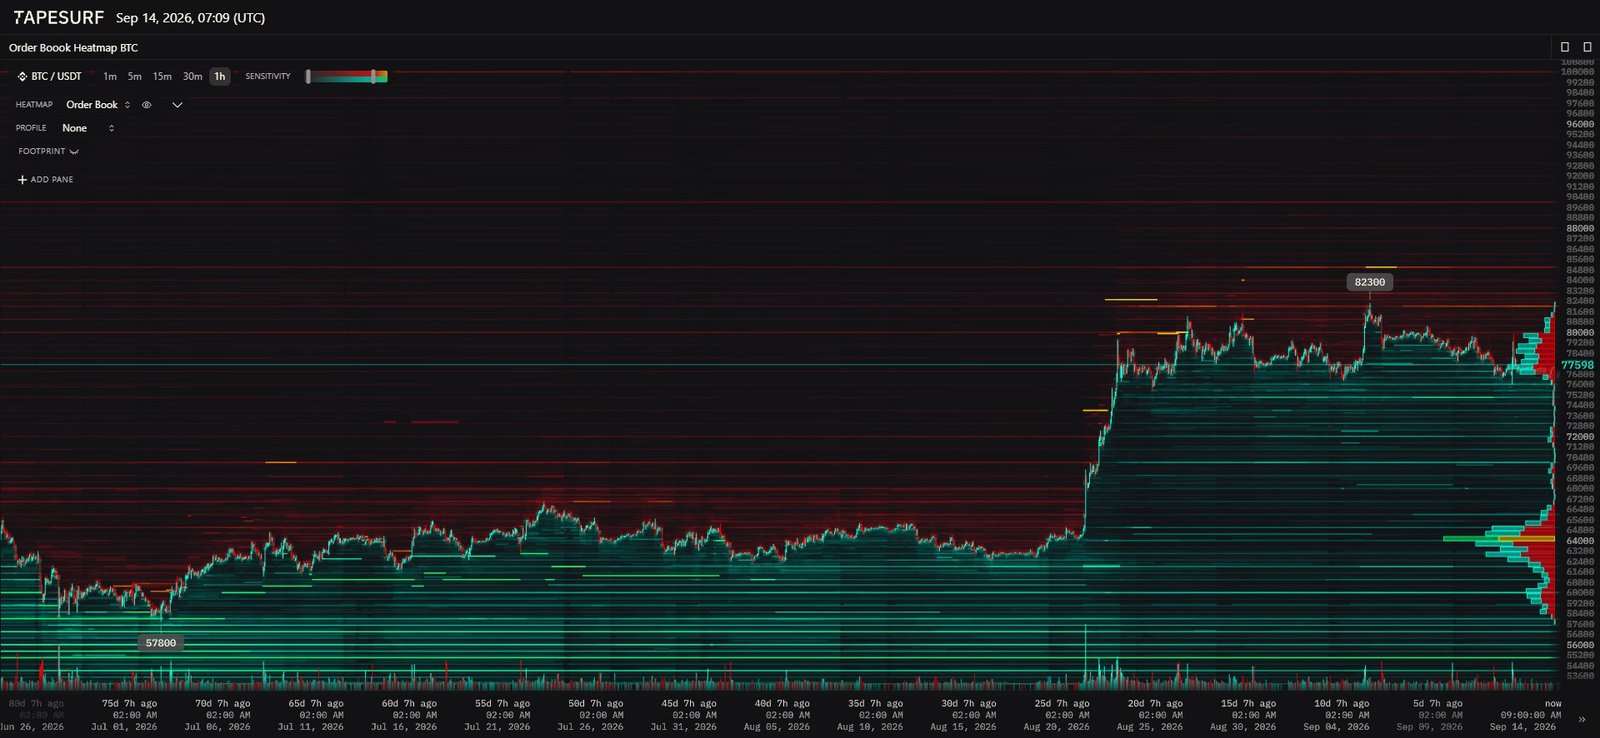
The BTC/USDT order-book heatmap (data as of September 14, 2026, 07:09 UTC) reveals an asymmetric book, with buyers structuring dense support tiers that contrast with seller clusters concentrated at precise target levels. On the supply side, two massive liquidity blocks dictate resistance: a continuous line of orders at the psychological 80,000 USDT level, and a major institutional wall anchored between 82,300 and 84,000 USDT — the ultimate ceiling for swing-trading operations.
On the demand side, the defensive structure comprises three tiers: a very dense buy wall between 75,500 and 76,000 USDT, a secondary liquidity reserve around 72,000 USDT, and a prominent volume peak centered on 77,200–77,800 USDT — the fair-value zone where the heaviest institutional trading currently takes place.
Macro Catalysts: The CLARITY Act and the FOMC
The U.S. legislative arena stands as the first directional catalyst, with a procedural motion-to-proceed vote in the Senate on the CLARITY Act scheduled for September 15. This 630-page bill, championed by Senator Cynthia Lummis, aims to separate CFTC and SEC jurisdiction while establishing prudential rules for centralized protocols. Although Treasury Secretary Scott Bessent and presidential adviser Patrick Witt are actively pushing for its passage, the bill is stalling on the Democratic wing’s refusal to endorse ethics clauses seen as too permissive toward President Trump’s direct crypto interests and those of World Liberty Financial. Prediction markets Kalshi and Polymarket assign only around a 20% probability to immediate final passage — yet a positive outcome in this procedural vote would spark a major bullish impulse by opening traditional banking balance sheets to digital assets.
On the monetary front, the FOMC meeting on September 15–16 is freezing unilateral risk-taking. Inflation data (CPI and PPI) pointing to sticky prices, combined with Brent crude climbing back above $100 amid persistent U.S.–Iran tensions, are narrowing the Fed’s room to ease policy. Several market strategists note that Bitcoin’s current pause around 77,000–78,000 USDT reflects rational institutional patience rather than a loss of fundamental confidence, with the defense of the 77,000–77,500 USDT floor conditioning the continuation of a path toward 80,000–82,000 USDT.
Institutional flows are sending mixed signals: spot Bitcoin ETFs have seen three consecutive sessions of net outflows in favor of a temporary reallocation toward Ethereum, following a historic August marked by a 17.6% rise in total crypto market capitalization. Conversely, corporate treasuries continue systematic accumulation — listed company Capital B confirmed on September 14 the acquisition of new bitcoins, bringing its holdings to 3,525 BTC. This tug-of-war between speculative ETF outflows and non-discretionary spot buying is stabilizing the market and keeping the Fear & Greed Index in “Greed” territory at 73 points.
Three Trading Scenarios
| Scenario | Trigger | Targets | Invalidation |
|---|---|---|---|
| Bullish (breakout) | 4H close > 78,800 USDT | 82,300 USDT then 86,500–88,000 USDT | 4H close < 76,000 USDT |
| Bearish (correction) | 4H close < 75,800 USDT | 74,200–74,500 then 72,000–72,400 USDT | 4H close > 78,200 USDT |
| Sideways (range trading) | Bounces between 76,500 and 78,500 | Sell 78,300 / Buy 76,600 USDT | Clean break of the range |
The bullish scenario relies on holding the 76,000–76,800 USDT support and the emergence of a positive catalyst — advancement of the CLARITY Act’s procedural step or a dovish Fed tone. A 4H close above 78,800 USDT would trigger a cascade of stop-buy orders sweeping through the 80,000 USDT wall to directly target 82,300 USDT, with a theoretical extension toward 86,500–88,000 USDT.
The bearish scenario would result from an unfavorable combination: rejection of the bill in the Senate amid an ethics-related standoff, coupled with restrictive rate guidance from the FOMC. A clean 4H close below 75,800 USDT would send price toward the rising 4H moving average at 74,200–74,500 USDT, with a possible extension toward the macro support at 72,000–72,400 USDT should ETF outflows intensify.
Pending official rulings from Washington and the Federal Reserve, a neutral scenario also remains plausible: price would oscillate between the 76,500 USDT liquidity floor and the 78,500 USDT intermediate resistance without a lasting directional break, with RSI oscillators staying pinned around their neutral 50-point level.
Summary
Bitcoin’s positioning at 77,640 USDT illustrates the mechanical standoff between the strength of a spot market underpinned by a macro Golden Cross and the caution of institutional desks forced to wait out the resolution of the Senate vote and the Fed’s rate decision. Price compression within the 4H bull flag and the density of buy-side limit orders on the heatmap at 76,000 USDT give a favorable bias to passive absorption. This fragile equilibrium calls for rigorous risk management: a break above 78,800 USDT would unlock upside potential toward new annual highs, while a confirmed break below 75,800 USDT would precipitate a test of the structural support at 72,000 USDT.
Disclaimer: This article was written for strictly educational and informational purposes. It does not constitute investment advice, a recommendation to buy or sell, or a solicitation to trade on financial markets. Crypto assets are highly volatile and risky instruments. Always do your own research (DYOR) and consult a licensed financial advisor before making any investment decision.

