


On September 11, 2026, Bitcoin finds itself at a pivotal juncture. After stalling against resistance at 82,389 USDT, price retreated to 77,251 USDT, closing out a summer marked by a spectacular rally of over 42% since the July low of 57,747 USDT. This consolidation comes as the market weighs massive institutional support via spot ETFs against the return of a significantly more restrictive macroeconomic backdrop.
Macro backdrop: inflation crashes the party
The immediate bearish catalyst comes from the US Producer Price Index (PPI), which came in at +5.4% year-over-year — its highest level in twelve months — driven by a 24.1% spike in diesel fuel amid tensions in the Strait of Hormuz between Washington and Tehran. Brent crude is now trading above $100 per barrel, a factor that directly weighs on global liquidity and complicates the Federal Reserve’s task.
Consensus for August 2026 CPI sits between 3.3% and 3.4% year-over-year (Core CPI at 2.4%), a decisive data point for monetary policy calibration. Resilient labor market data (162,000 jobs added, unemployment at 4.1%) and the hawkish tone struck at the Jackson Hole symposium have pushed futures markets to price in roughly 58–60% odds of a preemptive rate hike to 3.75%–4.00% at the September 16, 2026 FOMC meeting, whereas a hold at 3.50% had initially been expected.
Market structure: technical deleveraging, not capitulation
During the push above 82,000 USDT, short-term holders and institutional portfolios had accumulated over $9.07 billion in unrealized gains — a cyclical record that mechanically triggered algorithmic profit-taking. Despite this, spot Bitcoin ETF holdings demonstrated solid absorption, capturing $3.8 billion over three weeks. Open interest on derivatives remained stable despite $246 million in liquidations (74.7% long positions), and the Fear & Greed Index merely eased from “euphoria” into a moderate “greed” zone (69–73).
This behavior characterizes a cleansing of the market’s financial structure rather than a structural withdrawal of long-term capital.
Daily timeframe (1D): the underlying trend remains bullish
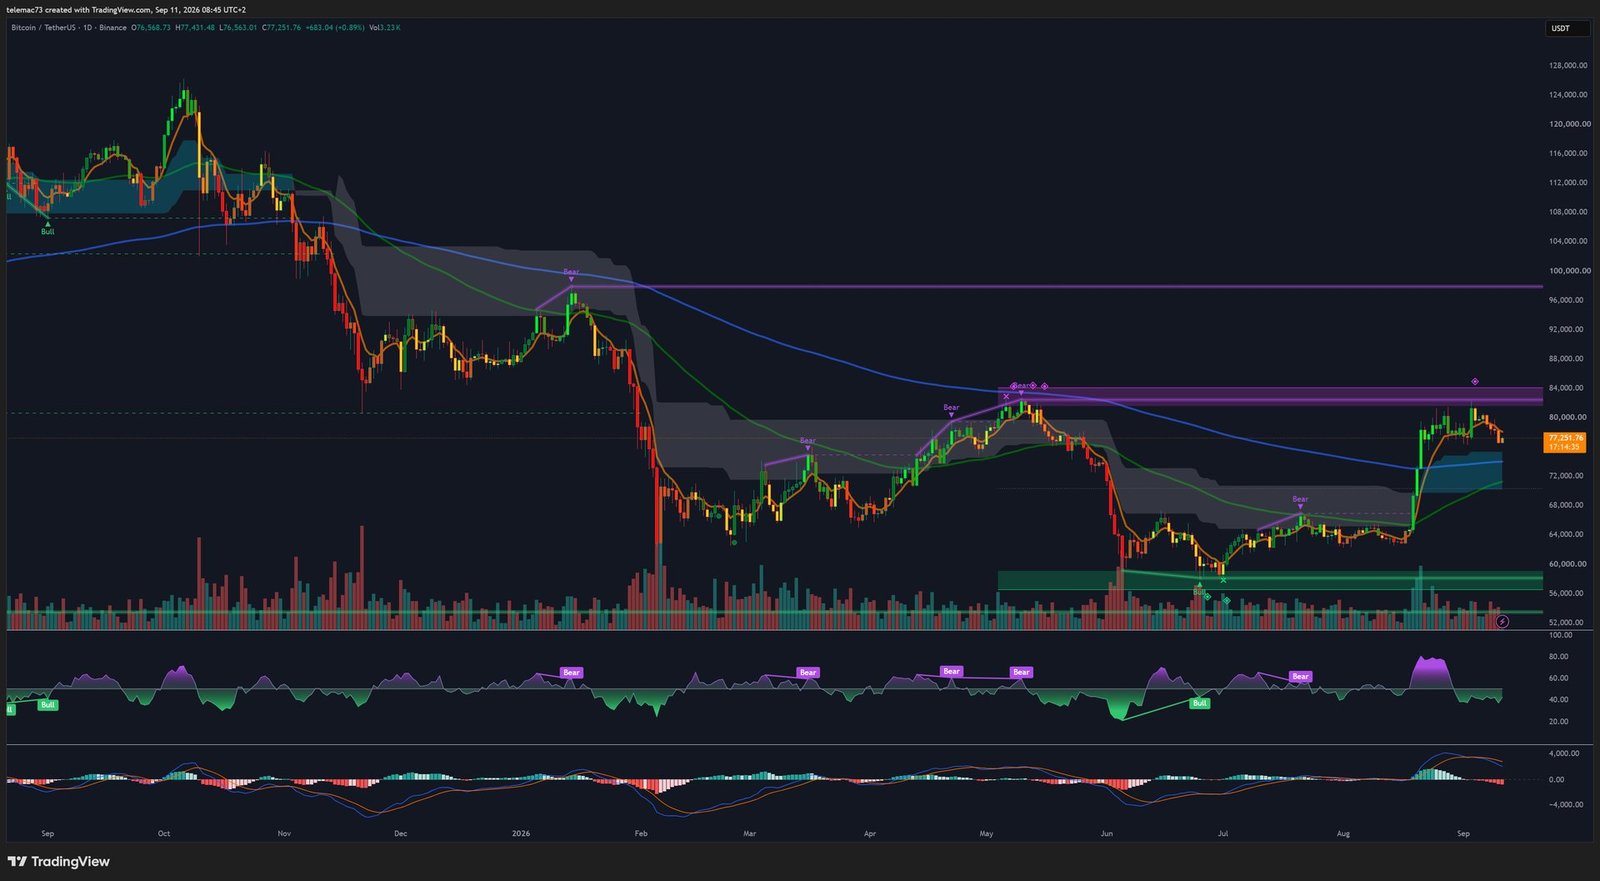
The underlying daily trend remains firmly bullish. The dominant technical element lies in the configuration of the exponential moving averages: the 50-day EMA is advancing toward the 200-day EMA, sitting between 74,500 and 75,000 USDT, sealing the imminent formation of a “Golden Cross.” This would be the first bullish crossover of this magnitude since the “Death Cross” validated in November 2025. The ADX, measured at 45.8, confirms that the move retains sufficient directional inertia despite the current pause.
The daily RSI sits at 55.6, reflecting an effective normalization after an overbought spike to 73 near contact with 82,000 USDT. This momentum purge allowed the RSI to retreat toward its neutral-bullish zone without breaking the 50-midline, preserving the buyers’ statistical edge. The MACD keeps its lines firmly anchored in positive territory, although histogram contraction signals a deceleration in upward momentum.
Chartwise, the consolidation below the historic resistance band at 81,500–83,000 USDT is shaping up as a large Bull Flag, within a structure of higher lows that began at 57,747 USDT. As long as the pivotal 76,000 USDT threshold holds on a daily close basis, the secular bias favors an upside resolution toward 88,000 and then 90,000 USDT.
Intermediate timeframe (4H): a more fragile distributive phase
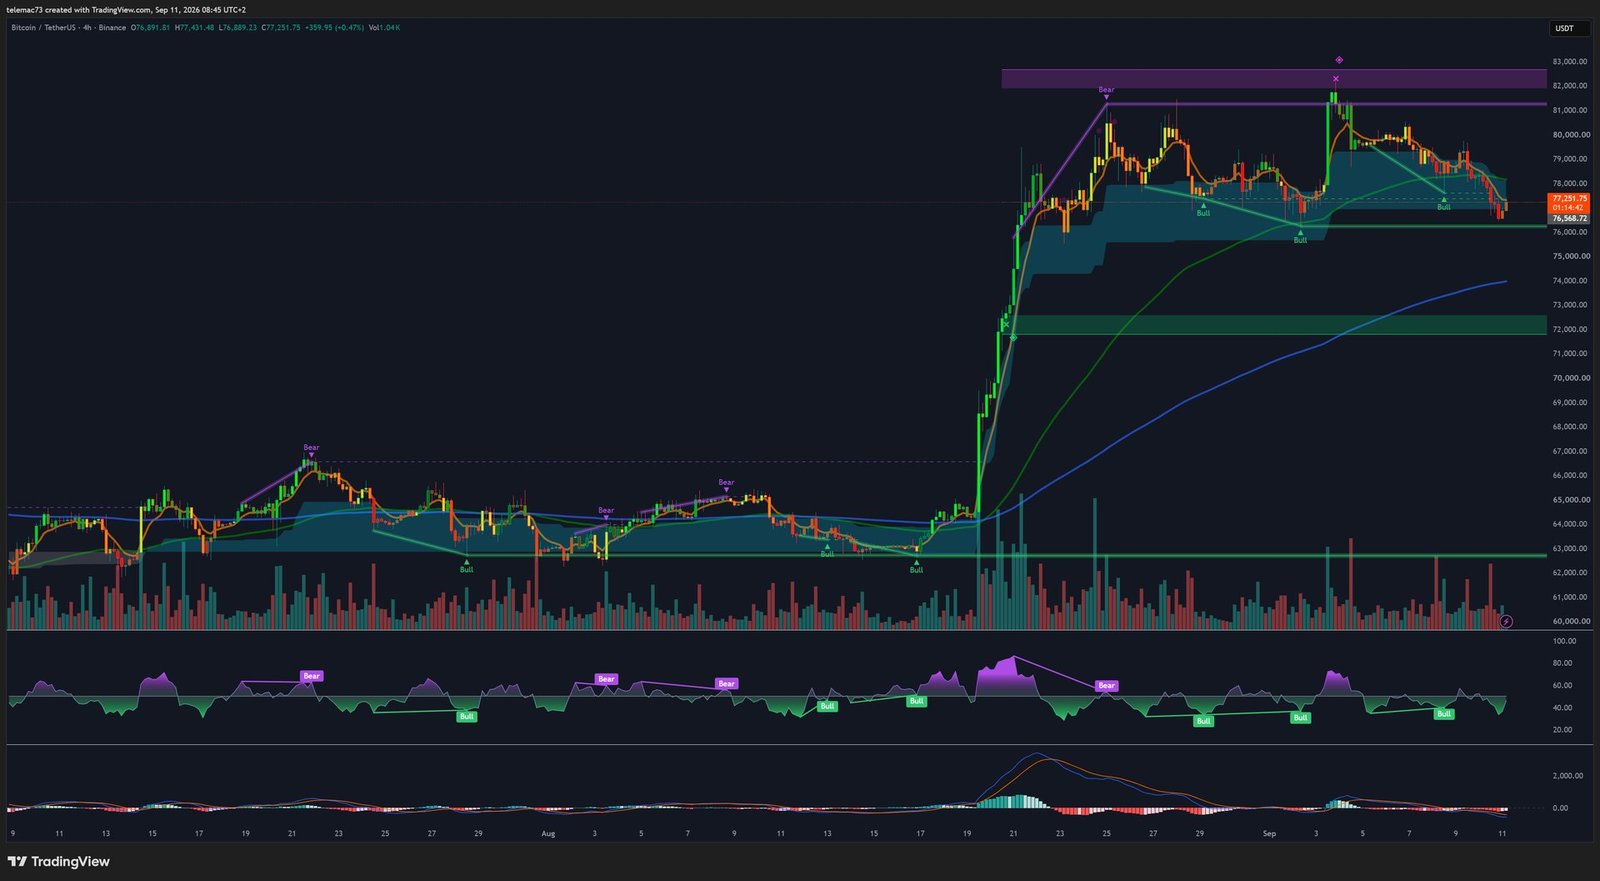
The 4-hour horizon presents a more vulnerable setup. Repeated failures by buyers to clear resistance at 82,389 USDT have materialized as a local triple top, with successive rally attempts producing descending highs (81,200, then 79,650 USDT), reflecting the gradual exhaustion of aggressive buying pressure.
Price sliding below the 20 and 50 EMAs on the 4H chart triggered a break of local market structure below the 78,500 USDT pivot. The 4H RSI validated a classic bearish divergence at the last peak above 81,500 USDT, before dropping to a low of 38. On the 4H MACD, a “Death Cross” has formed, though the recent shrinking of red histogram bars suggests selling pressure is starting to run dry near the 76,500–76,650 USDT support band. However, a 4H close below 76,500 USDT would risk turning this technical breather into a more severe double-top reversal pattern (“M-Top”), targeting the 4H 200 EMA at 74,200 USDT.
Intraday timeframe (15M): the mechanics of the liquidity hunt
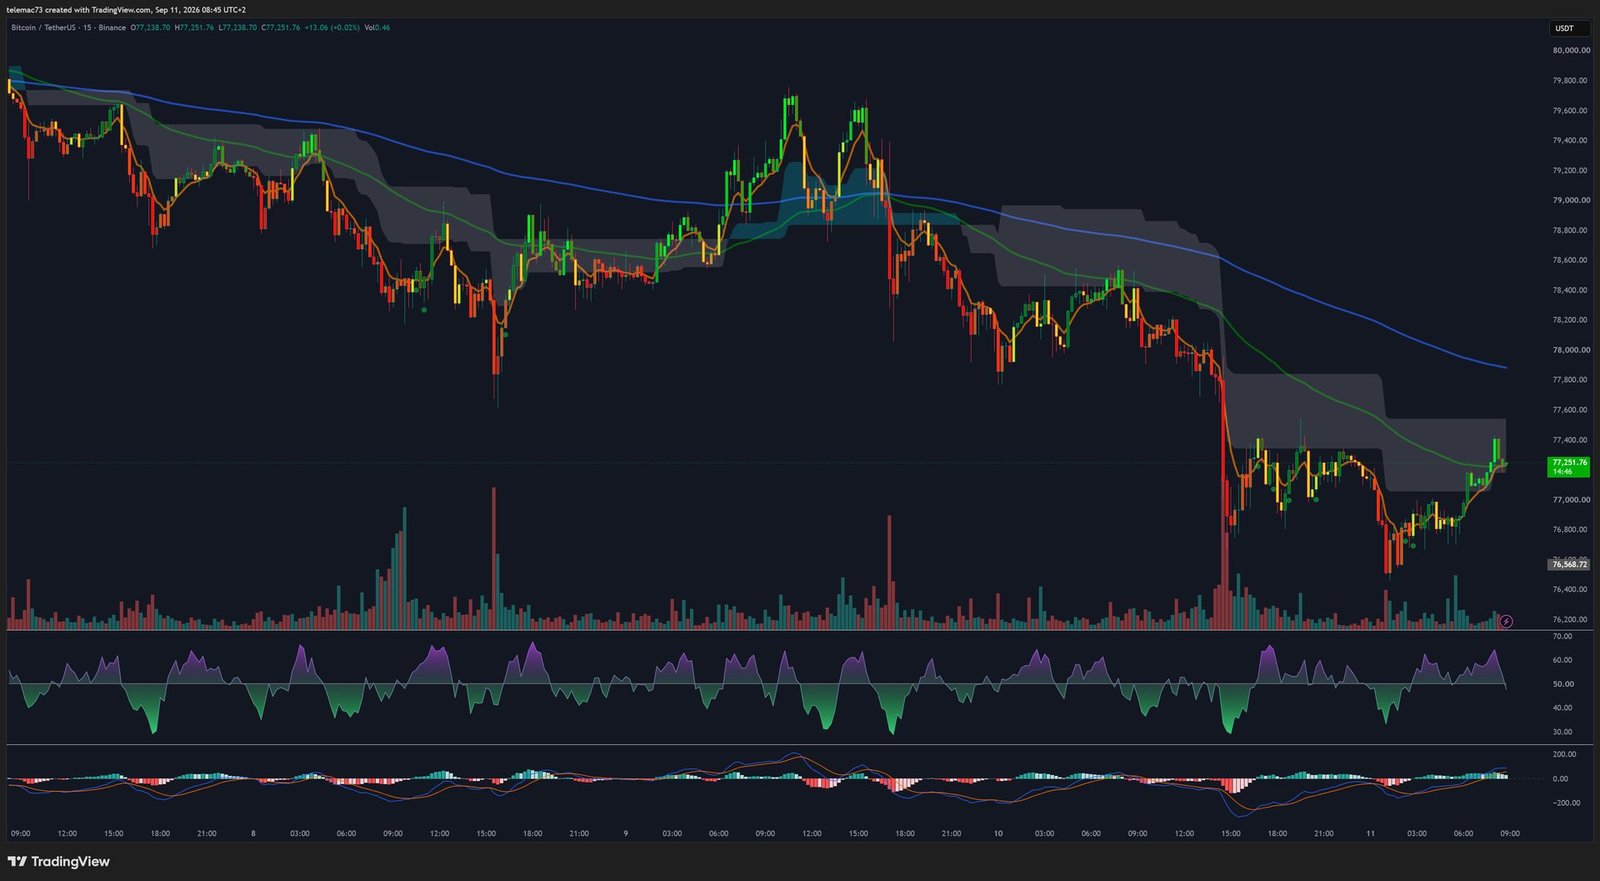
On the 15-minute timeframe, a vertical liquidation leg drove price from 79,650 USDT down to an intraday floor of 76,566 USDT, accompanied by a pronounced lower wick and an instantaneous volume spike — the signature of massive stop-loss execution followed by immediate institutional absorption.
The 15M RSI collapsed below 25, an extreme oversold level, before rebounding to 58 via a micro-structural bullish divergence. The 15M MACD validated a bullish crossover deep in negative territory. The bounce from 76,566 USDT, however, remains confined to a tight ascending channel resembling a short-term Bear Flag, with price currently running into the 15M 200 EMA between 78,200 and 78,400 USDT.
Order book mapping: magnetic liquidity zones
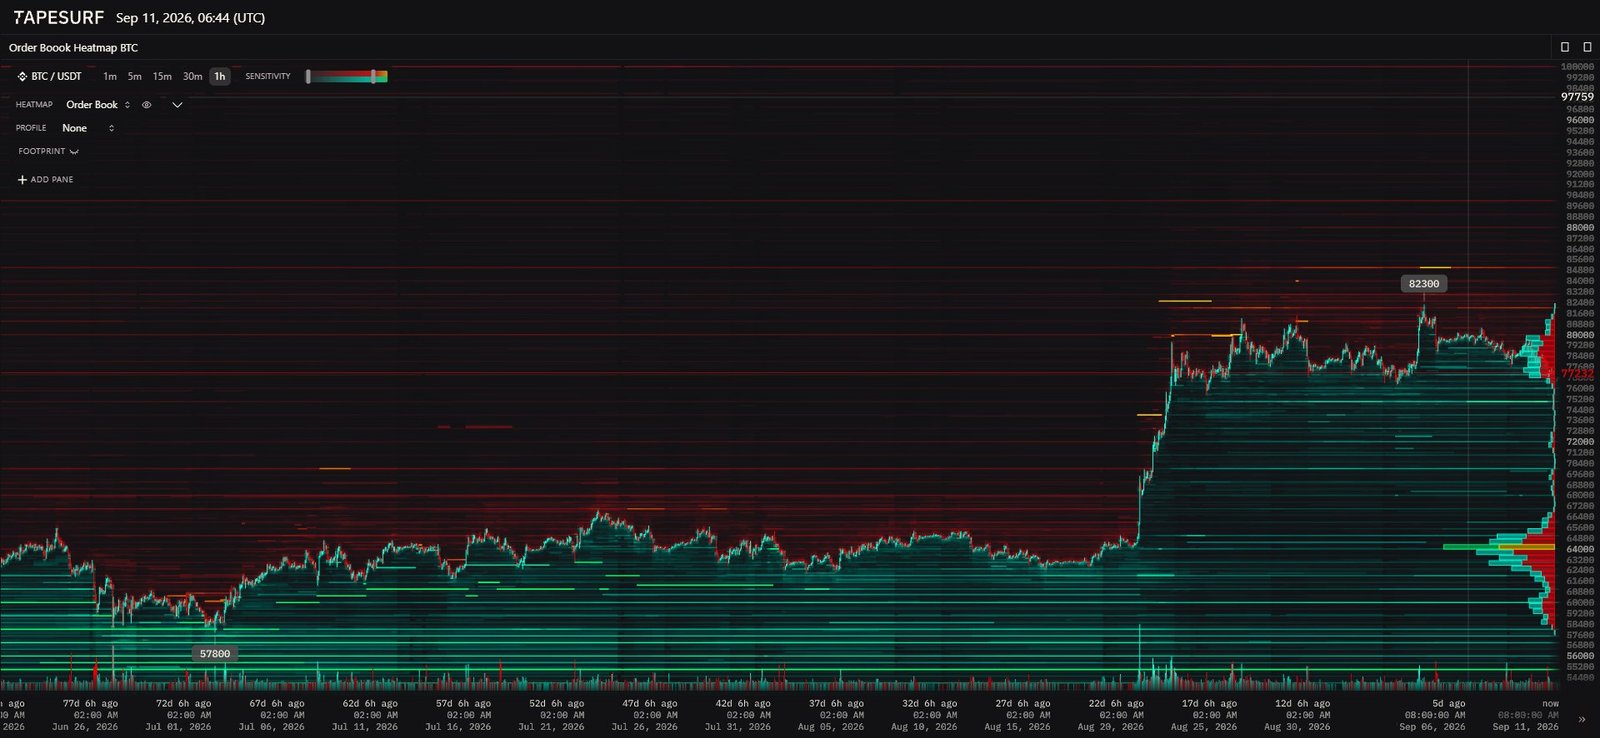
The 80,000–82,500 USDT zone appears as a dense heat band on the heatmap, with concentration peaking at the 82,389 USDT summit — a sign of deliberate institutional distribution that, for now, prevents any disorderly upside expansion. Conversely, passive buyers have walled off the 76,000–76,500 USDT range, which is exactly what halted the intraday incursion at 76,566 USDT.
Between 78,500 and 80,000 USDT lies a relative liquidity vacuum (Low Volume Node): any high-volume break of the 78,500 USDT resistance would suck price toward 80,000 USDT via an air pocket effect. Conversely, a breakdown of the 76,500 USDT support would trigger acceleration toward the passive order cluster located between 73,800 and 74,500 USDT, where the daily 200 EMA would provide a first-order technical defense.
Key strategic levels to watch
| Level | Price (USDT) | Technical rationale |
|---|---|---|
| Major resistance (R3) | 82,000 – 82,389 | 4H triple top and peak of sell-side liquidity |
| Intermediate resistance (R2) | 79,800 – 80,200 | Psychological threshold and top of the 4H descending channel |
| Immediate resistance (R1) | 78,200 – 78,500 | 15M 200 EMA, boundary of the intraday bear flag |
| Equilibrium pivot | 77,400 – 77,800 | Weekly VWAP, median value zone |
| Immediate support (S1) | 76,500 – 76,650 | Swept intraday low, primary bid shelf |
| Major support (S2) | 73,800 – 74,500 | Confluence of Daily/4H 200 EMA and dense order book |
| Structural support (S3) | 71,800 – 72,200 | Ultimate invalidation level of the bullish cycle |
Forward-looking scenarios
Primary scenario: absorption bounce and bullish extension
If the liquidity purge at 76,566 USDT has cleared out excess speculative positioning and a CPI print confirming disinflation (Core CPI at 2.4% or below) prompts the Fed to soften its tone, Bitcoin could break free of its 15M channel by clearing 78,200–78,500 USDT on volume. This break would open the path toward 80,000 USDT, then a frontal assault on the 82,389 USDT wall, unlocking potential toward 85,000 and 88,000 USDT. This scenario loses validity on a daily close below 76,000 USDT.
Alternative scenario: rejection and cascade toward the 200 EMA
A CPI print above expectations, combined with oil holding above $100, would reinforce rate-hike expectations for September 16. The current bounce would then fail below 77,800–78,400 USDT, validating the distributive nature of the 15M Bear Flag. A confirmed break of 76,500 USDT would trigger a stop-loss cascade toward the major accumulation zone at 73,800–74,500 USDT, where the confluence of the daily 200 EMA would offer a potential floor. This bearish bias would be invalidated by a 4H close above 79,500 USDT.
Bottom line
As of September 11, 2026, Bitcoin displays a robust market on its secular horizon, but one temporarily constrained on its intermediate and tactical timeframes by demanding macroeconomic trade-offs. The imminent daily Golden Cross attests to a structural regime shift from the bear market of late 2025. The 76,500–78,500 USDT band constitutes the immediate decision corridor: the clash between CPI releases and FOMC decisions will provide the decisive impulse in settling whether the market resumes its bullish advance or retests the 200 EMA near 74,000 USDT.
Disclaimer: This article is provided for educational and informational purposes only. It does not constitute investment advice, a recommendation to buy or sell, or a financial solicitation of any kind. Cryptocurrency markets are highly volatile and carry significant risk of capital loss. Do your own research (DYOR) and consult a qualified financial advisor before making any investment decision.

