


Bitcoin enters the third quarter of 2026 at the intersection of two opposing forces: an increasingly solid macroeconomic and institutional architecture, and an extremely compressed market microstructure sitting just below a level that could trigger one of the year’s most violent moves. This analysis combines institutional flow data, the Swiss and European regulatory framework, the liquidity heatmap, and the daily, 4-hour and 15-minute charts to map out the forces currently at play.
A new institutional valuation paradigm
Traditional discounted-cash-flow valuation models no longer apply to Bitcoin: the asset generates no dividends and offers no corporate-style terminal value. Yet trillions of dollars are now allocated to it within institutional portfolios. Value today emerges from the interaction between global liquidity, economic activity and investor attention, within a highly reflexive system: liquidity drives price formation, price feeds the narrative, and the narrative sustains adoption.
This new framework also highlights what some analysts call the “scaling paradox”: as Bitcoin’s underlying technology becomes more efficient, the economic pressure tied to block-space scarcity fades, and investor attention shifts away from theoretical intrinsic-value estimates toward pure capital-flow modeling.
Macro backdrop and geopolitical shocks
The dominant narrative remains the “debasement trade”: faced with the ongoing erosion of fiat purchasing power, Bitcoin has established itself as the most asymmetric hedge instrument in the eyes of asset managers. This dynamic has been reinforced by easing energy prices, falling US bond yields and a weaker dollar.
The asset now reacts with remarkable sensitivity to geopolitical shocks, at times rivaling gold as a barometer of global anxiety. The most striking episode remains the US military operation in Venezuela on January 3, 2026, which led to the removal of President Nicolás Maduro: Bitcoin jumped from below $90,000 to above $94,000 within hours, driven by massive short-position liquidations and unverified rumors of a secret Venezuelan sovereign Bitcoin reserve. The episode illustrates how pure narrative risk can now dictate the asset’s pricing.
Other shocks, such as escalating US tariffs and Middle East tensions, have also fueled significant volatility, amplified by the collapse of peripheral speculative bubbles — most notably the wave of politically themed memecoins, which durably dented retail investor confidence.
ETFs and corporate treasuries: the balance-sheet shift
Bitcoin’s most structural transformation isn’t visible on the candlestick charts — it’s in the accounting ledgers of major institutions. Cumulative net inflows into US spot Bitcoin ETFs since January 2024 now exceed $57 billion, with total assets under management approaching $130 billion, led by BlackRock’s IBIT fund, which crossed $67 billion in AUM in under a year. Roughly 24.5% of total Bitcoin ETF holdings are now held by pure institutional entities — benchmark-driven capital that is largely insensitive to short-term volatility.
Meanwhile, publicly listed companies collectively now hold more than 1.7 million BTC, roughly 8% of total circulating supply — a shift made possible by the introduction of fair-value accounting, which finally allows companies to recognize gains on their crypto holdings, not just write-downs.
Regulation and infrastructure: MiCA, FINMA and stablecoins
2026 marks the shift from theoretical regulatory frameworks to operational execution. In Europe, the harmonized MiCA framework now provides a single rulebook across 27 countries. In Switzerland, FINMA has cemented its position as a global reference for institutional digital finance, while tightening identity-verification requirements for any transaction above CHF 1,000 — creating a two-speed market between retail and institutional flows.
Settlement infrastructure is also undergoing a revolution as stablecoins become mainstream, now regarded as critical plumbing for global financial markets — illustrated by major banks rolling out their own token networks for round-the-clock settlement and lower operational costs.
The liquidity heatmap: where the real levels hide
Unlike a traditional order book, a liquidation heatmap aggregates leveraged-position accumulation and reveals where massive liquidation pools have formed — the precise price levels at which overleveraged positions will be automatically closed by exchange risk engines.
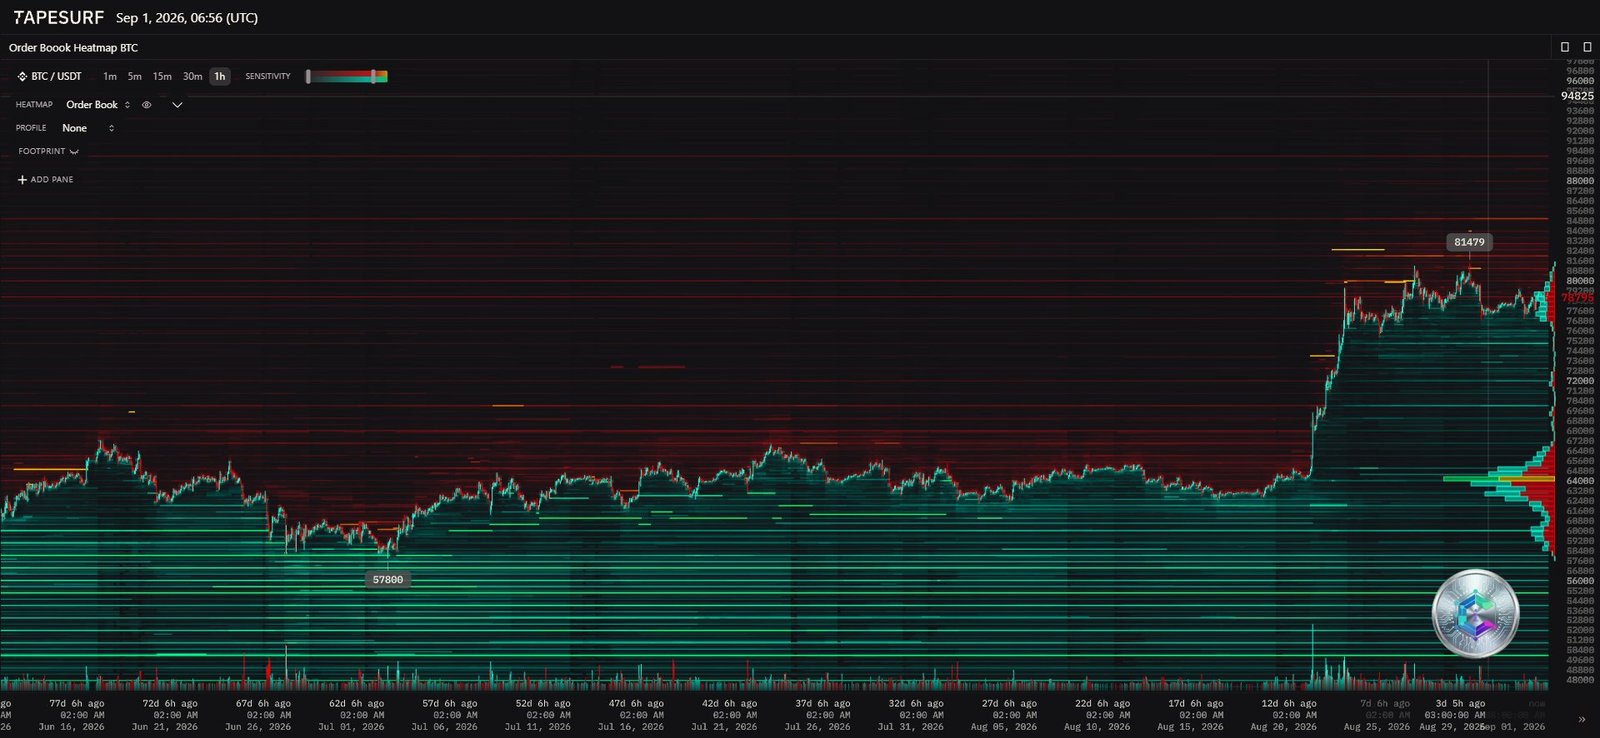
The BTC/USDT heatmap reveals a striking asymmetry: an extremely dense concentration around $81,479, marked by intense red and yellow bands, signals a colossal institutional resistance wall and a massive cluster of short-position liquidations. A break above this threshold would trigger a mechanical feedback loop — liquidation engines executing forced buy orders to cover insolvent short positions, propelling price higher in a classic short squeeze.
By contrast, the lower half of the map shows a more layered support architecture, with a foundational liquidity band around $57,898 — the ultimate support of the 2026 market structure — and intermediate bands concentrated between $62,000 and $64,000, likely the footprint of institutional execution algorithms deploying capital gradually on each pullback.
The underlying trend: the daily chart
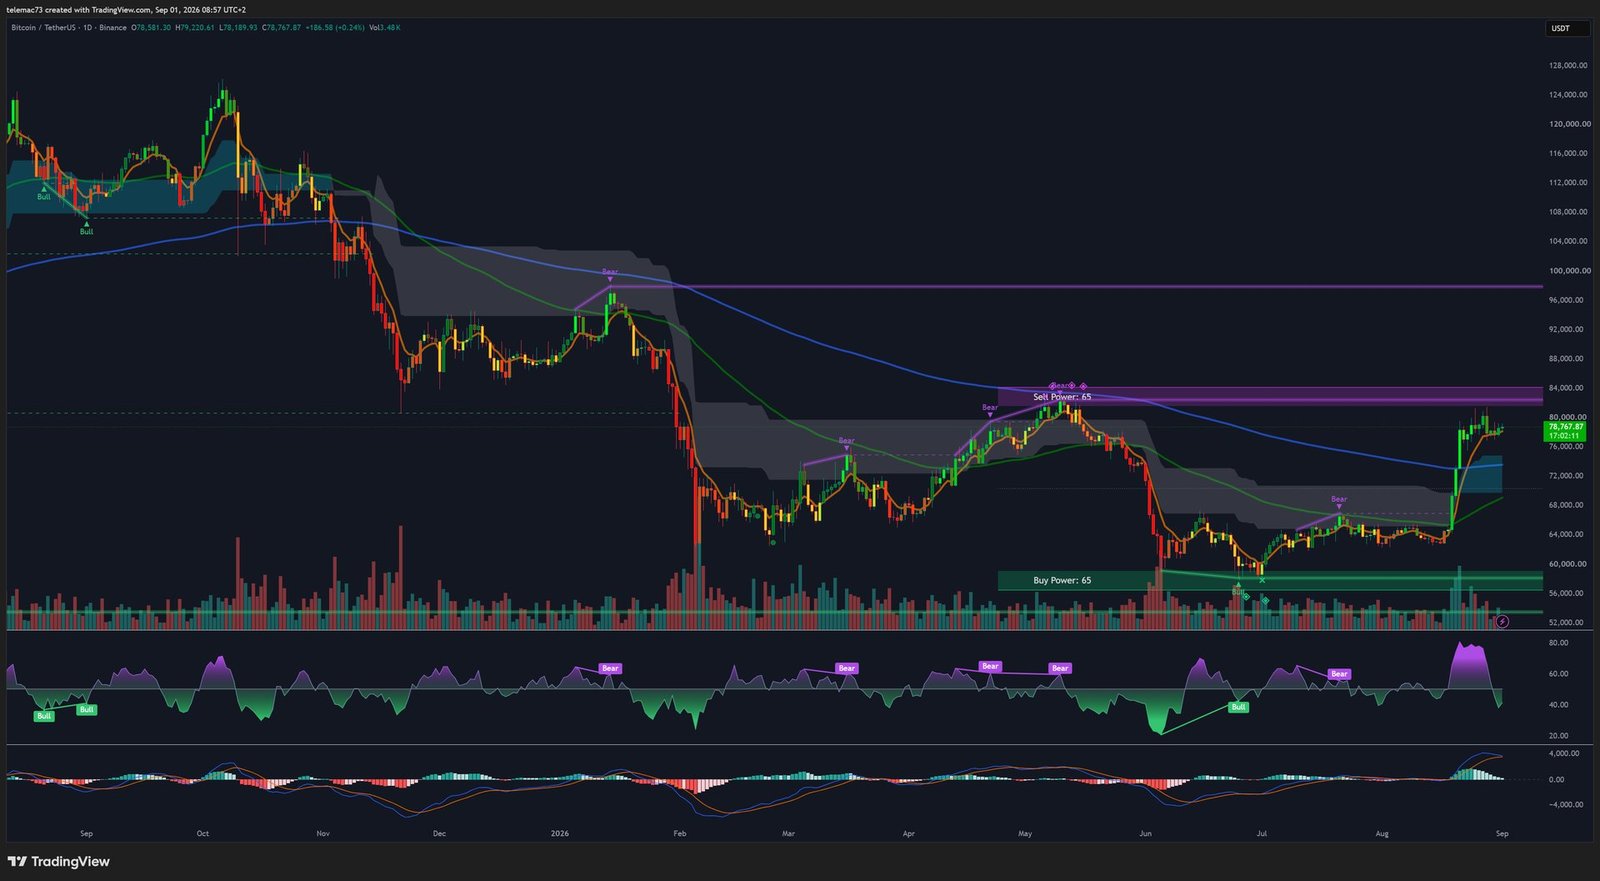
The daily chart shows a broad rounding-bottom reversal structure, typical of a prolonged accumulation phase and a transfer of assets from speculative participants toward ETF funds and corporate treasuries. Price is currently consolidating around $78,767, beneath a technical ceiling spanning $81,000–$84,000 — a zone that converges with the 200-day moving average, the historical arbiter of the underlying trend, positioned around $83,418.
A confirmed daily close above $83,500 would mark a major regime shift, opening the path toward $95,000 and ultimately $100,000. Conversely, the support base between $60,000 and $64,000 remains the pillar of the current recovery. The daily RSI trends firmly above 50 while approaching overbought territory, while the MACD has printed a bullish crossover below the zero line — two signals confirming the strength of the underlying trend, though extended overbought phases are common in crypto markets.
The intermediate dynamic: the 4-hour chart
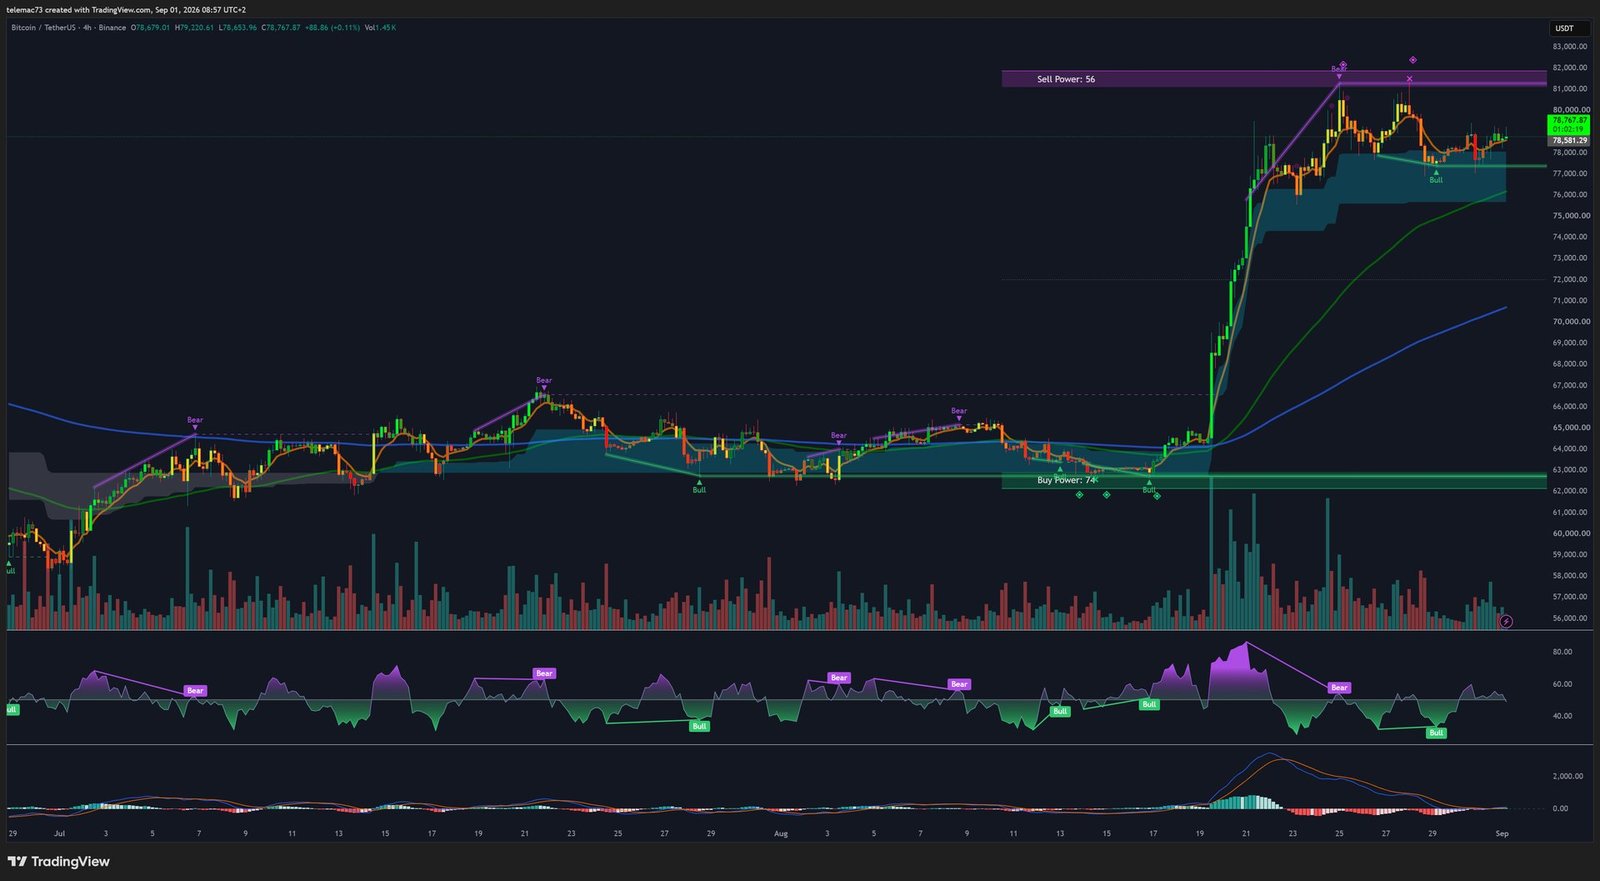
On the 4-hour timeframe, price violently broke away from its accumulation zone around $62,000 before entering a geometric digestion phase, forming a classic bull flag. As long as price holds above the flag’s lower boundary, currently around $77,000–$77,500, the most probable resolution remains a bullish breakout toward the $81,000–$83,500 resistance.
A note of caution is warranted, however: the 4H RSI, after exceeding 80 at the peak of the impulse, is now printing a hidden bearish divergence, a sign of fading marginal buying pressure. The MACD confirms this loss of velocity with a local bearish crossover. An invalidation of the flag below $77,000 would send the market toward the $72,000–$74,000 retracement zone.
Microstructure noise: the 15-minute chart
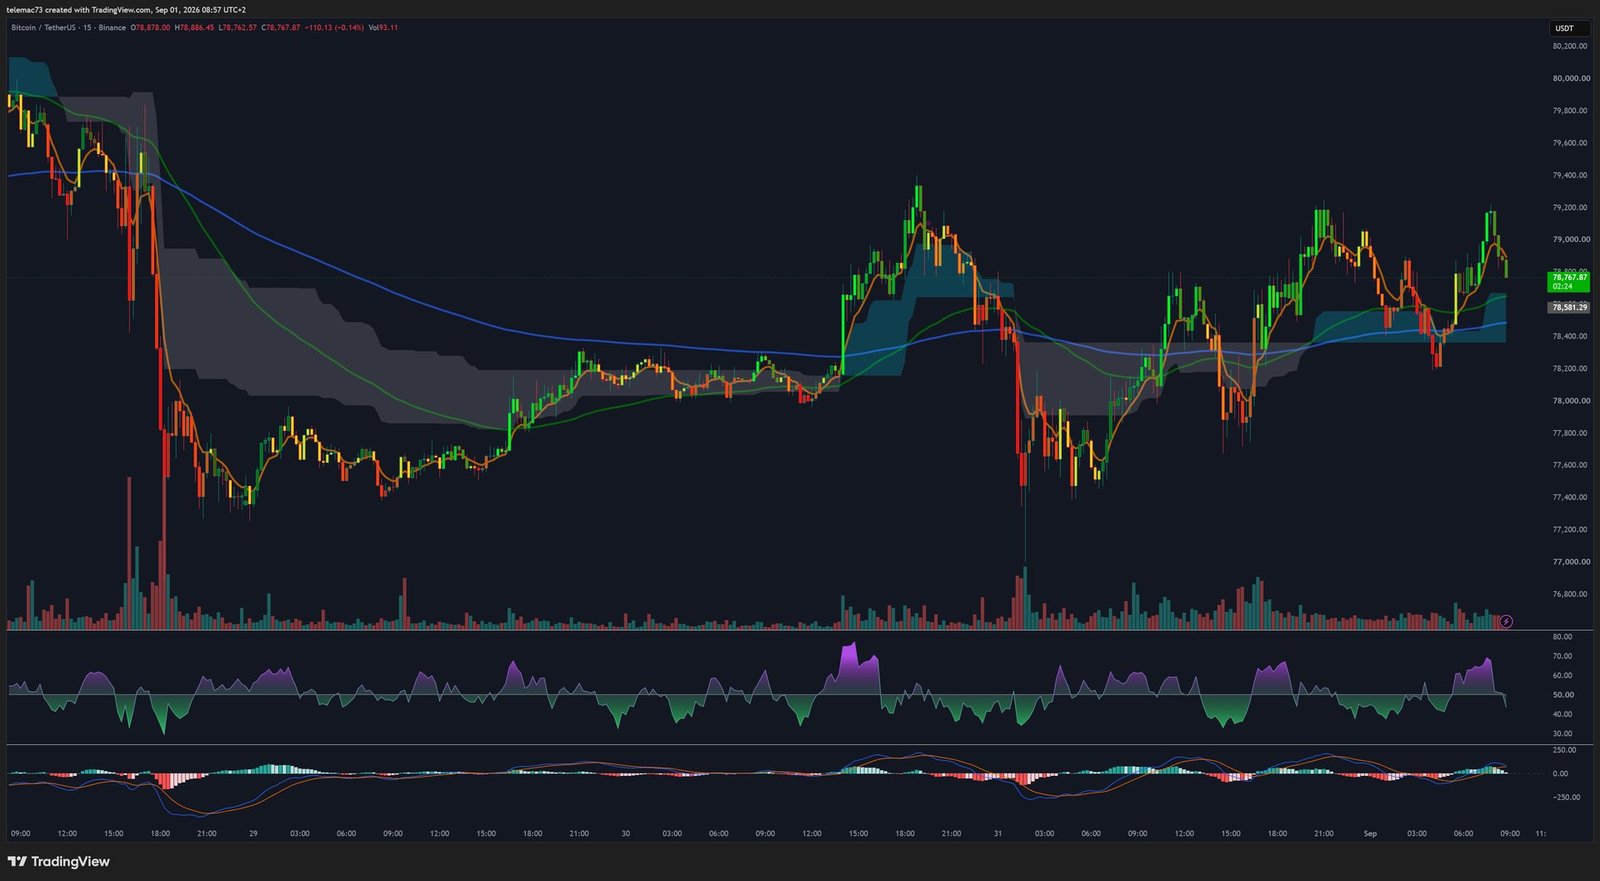
On an intraday scale, price is trading inside a symmetrical compression triangle, confined between $78,581 and $78,767 — a series of lower highs and higher lows reflecting extreme indecision. Oscillators lose all directional relevance in this environment: the M15 RSI whipsaws frantically around 50, while the MACD generates repeated false signals along the zero line.
A close below $77,600 would break the triangle’s support line and trigger a mechanical sell cascade toward $76,000. Conversely, a breakout above $79,200 would validate a bullish resolution and launch an assault on the $81,479 wall identified on the heatmap — provided it is confirmed by a volume spike and an intraday RSI push above 70, ruling out a bull-trap scenario.
Summary: the technical level matrix
| Category | Level (USDT) | Timeframe | Rationale |
|---|---|---|---|
| Macro target | > 100,000 | Structural | ETF and corporate treasury adoption, global liquidity expansion |
| Pivot resistance | 83,418 – 84,000 | Daily / Heatmap | 200-day MA, arbiter of the secular trend |
| Liquidation cluster | 81,479 – 82,000 | Heatmap / H4 | Danger zone: short-position liquidations |
| Current compression | 78,500 – 79,200 | M15 / H4 | Core of the symmetrical triangle |
| Continuation support | 77,000 – 77,500 | H4 / M15 | Lower boundary of the bull flag |
| Structural support | 72,000 – 74,000 | H4 | Tactical reload zone |
| Foundational accumulation | 60,000 – 64,000 | Daily | Origin of the rally, institutional acceptance |
| Deep support | 57,898 | Heatmap | Last visible line of defense |
Conclusions and strategic outlook
Bitcoin stands at a telling crossroads in its financial maturation. The structural absorption of more than 8% of supply by corporate treasuries, combined with “sticky” ETF inflows, has created an unprecedented fundamental safety net. Regulatory clarity, via MiCA in Europe and FINMA in Switzerland, has also removed much of the existential legal risk that once weighed on the asset.
On the technical side, the daily chart’s macro-bullish trend contrasts with real friction on intermediate timeframes, where momentum is cooling. Ultimately, the liquidity heatmap dictates the immediate timeline: the interaction between the M15 triangle compression and the $81,479 wall will be the defining directional event of the season. Should this barrier give way, the leverage accumulated by short sellers could trigger a chain liquidation event toward the $83,418 zone and beyond.
In the meantime, any pullback toward lower liquidity pockets ($74,000, then $64,000) should continue to be viewed by patient capital as a repositioning opportunity rather than a trend-reversal signal.
Disclaimer: This article is provided for informational and educational purposes only. It does not constitute investment advice, a recommendation to buy or sell, or a solicitation to engage in any financial transaction. Cryptoasset markets are highly volatile and involve the risk of capital loss. Always conduct your own research and consult a qualified financial advisor before making any investment decision.

