


As August 2026 draws to a close, Bitcoin (BTC) is navigating an unusually dense environment: central banks replaying the currency-debasement card, institutional adoption undergoing a structural reshuffle, a tightening Swiss regulatory framework that favors investors, and a particularly tense multi-timeframe technical setup. Having rebounded 41% from its July 1 low of $57,747 to a peak of $81,237.94 on August 25, the asset closed the month up roughly 28% — its strongest monthly performance since November 2024. This report offers a structured read of the current landscape, from macroeconomics down to order-book microstructure, across the daily, 4-hour and 15-minute timeframes.
The return of the “debasement trade” and lingering inflation pressure
The main catalyst behind the summer rebound is the re-emergence of the “debasement trade” — the strategy of seeking refuge in scarce assets as currencies lose purchasing power. Facing strain in the bond market, the U.S. Treasury, under Secretary Scott Bessent, launched large-scale purchases of long-dated bonds to cap yields ahead of the midterm elections. This debt monetization weakened the dollar and pushed institutional capital toward assets decoupled from fiat debasement risk: gold hit a three-month high, and Bitcoin followed a similar trajectory, further supported by persistent geopolitical tensions in the Middle East.
Inflation nonetheless remains a watch item. In the UK, the ONS reported a 2.8% rise in household costs for the year to June 2026, with particularly strong pressure on private renters (+3.0%). In the US, the Jackson Hole symposium and Fed Chair Kevin Warsh’s remarks drew heavy market attention, as PCE data show that 49% of the goods and services basket still posted annualized increases above 3% over the past six months — a level that, while below post-pandemic peaks, still justifies a cautious monetary stance and keeps demand alive for alternative stores of value.
Crypto vs. traditional equities: a more nuanced picture
A study by Taurex, comparing performance between end-2020 and August 12, 2026, tempers the narrative of Bitcoin as the ultimate outperformer. Over that period BTC is down 30% — its longest stretch of underperformance versus the S&P 500 in six years according to Glassnode — while defense and technology stocks posted striking gains.
| Asset / Company | Sector | Performance (end-2020 – Aug 2026) |
|---|---|---|
| Google (Alphabet) | Technology | +291.0% |
| Kratos Defense | Defense / Aerospace | +123.7% |
| RTX | Defense / Aerospace | +123.4% |
| Meta Platforms | Technology / Social | +112.1% |
| General Dynamics | Defense / Aerospace | +107.4% |
| AeroVironment | Defense / Aerospace | +94.2% |
| Bitcoin (BTC) | Digital assets | −30.0% |
This rotation of capital toward defense and technology reflects investors’ appetite for tangible cash flows in a geopolitically fragmented world, and is a reminder that Bitcoin still has to prove its utility beyond pure speculation.
Corporate treasuries, artificial intelligence and agentic payments
The phenomenon of listed companies accumulating Bitcoin on their balance sheets, long touted as a stock-price catalyst, has been severely tested. The combined market cap of the fifty largest BTC-holding companies fell from $150 billion in July 2025 to just $67 billion by mid-2026, with these firms turning net sellers in July. August’s rebound, however, revived optimism: MicroStrategy signaled a resumption of purchases after a two-month pause, while US spot Bitcoin and Ether ETFs attracted $1.75 billion in inflows for the week ending August 28 — including $314 million in a single day for Bitcoin.
Beyond asset holding, the industry is betting heavily on artificial intelligence to secure the ecosystem: exchange Bybit reports having averted close to $700 million in potential losses in the first half of the year through algorithms that rejected more than 30,000 fraudulent withdrawal requests. Visa and Mastercard, together with several fintech players, have also founded the Agentic Payments Alliance to standardize protocols allowing AI agents to autonomously transact via stablecoins. On the ground, South Africa illustrates genuine adoption: the number of merchants accepting crypto payments grew 51-fold in a single year, driven notably by the rand-pegged stablecoin ZARU.
Switzerland: FINMA Guidance 01/2026 strengthens institutional custody
Switzerland continues to cement its role as a regulatory benchmark, with the cantons of Zug and Zurich dominating the country’s crypto scene. On January 12, 2026, FINMA published Guidance 01/2026, redefining custody standards for crypto-based assets. The guidance requires strict client-by-client segregation: properly segregated crypto assets fall outside a custodian’s bankruptcy estate in the event of insolvency — a decisive legal safeguard for institutional investors. This “bankruptcy remoteness” requirement extends to foreign sub-custodians, who must be subject to equivalent prudential oversight, failing which enhanced capital requirements or explicit written client consent are required. The guidance also affects structured products and crypto ETPs, as well as algorithmic trading, now subject to mandatory circuit breakers during extreme volatility.
Market microstructure: what the order-book heatmap reveals
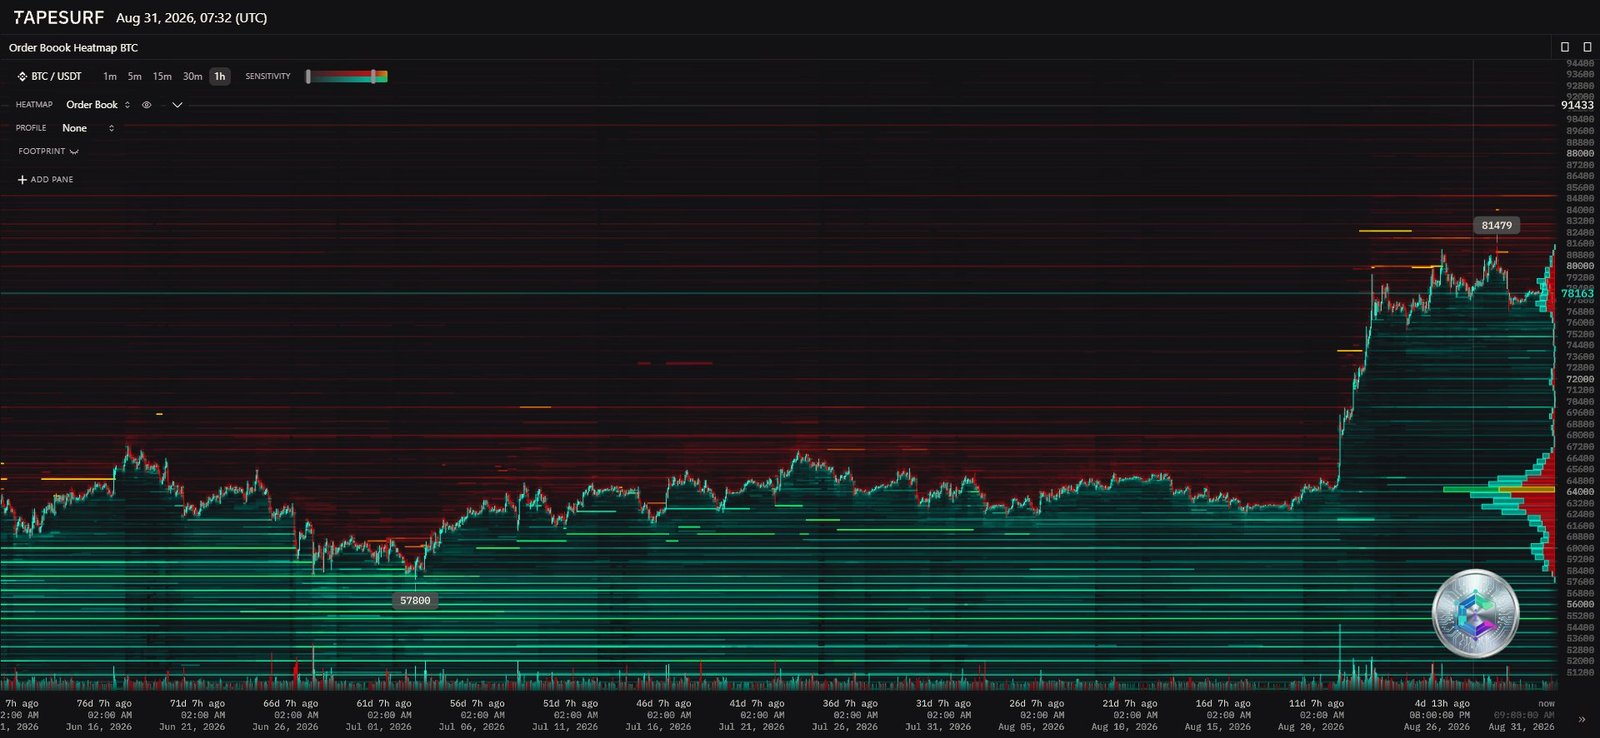
The order-book heatmap, a genuine X-ray of latent liquidity, reveals extreme polarization. On the ask side, an exceptionally dense red line sits at $81,479: this wall corresponds to a confluence of algorithmic profit-taking, options gamma hedging, and exits from positions opened near the previous all-time high of $126,198.07 in October 2025. The thickness and persistence of this line suggest genuine institutional resting orders rather than short-term spoofing, which explains the sharp rejection seen during the recent attempt to break above $81,000.
On the bid side, a notable concentration appears near $64,000, but the true structural floor sits at $57,800 — the low of July’s capitulation, where large holders appear to have parked dormant buy orders. In between, the $76,000 zone appears thin on resting liquidity, a gap that leaves room for liquidity sweeps capable of amplifying price swings and triggering cascading liquidations in derivatives markets.
Daily chart (1D): a V-bottom still seeking confirmation
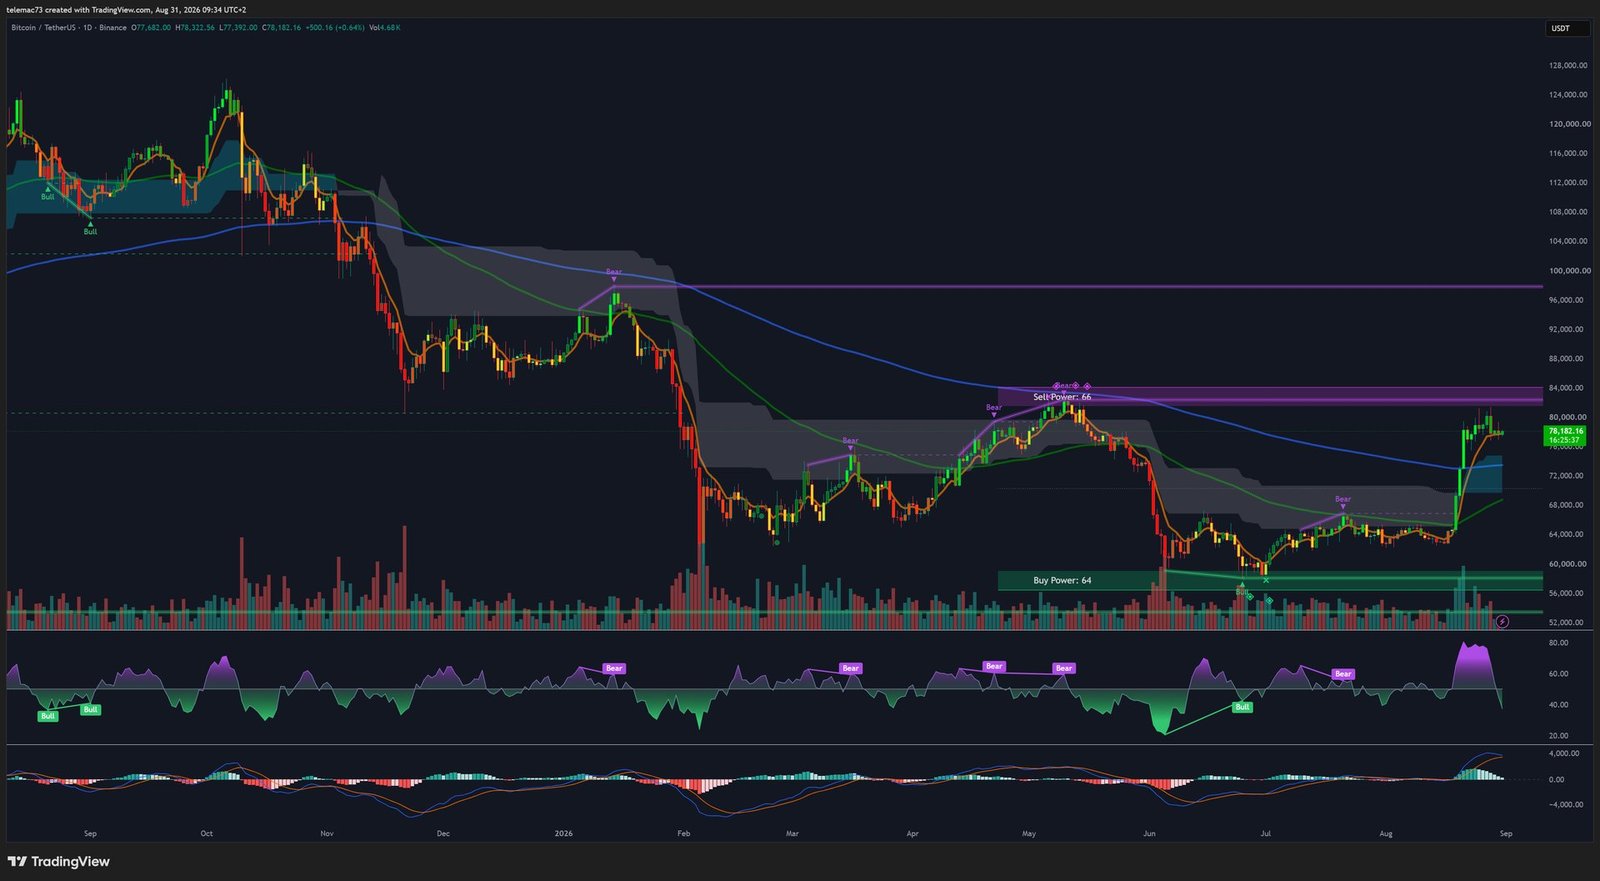
On the daily timeframe, price action forms a classic V-bottom, reflecting sellers’ failure to hold the line below $60,000. The decline from 2025’s highs ended in a “Buy Power” zone around $57,000, before an impulsive move carried price up to the “Sell Power” zone mapped near $81,000. The market is now attempting to print a slightly lower high, a sign of structural fragility unless $81,479 is retested and cleared; sustaining the bullish structure requires higher lows above the $57,000 base.
Moving averages illustrate this ongoing tug-of-war: price has broken above the long-term exponential moving average and started a Golden Cross, but the long average’s slope remains sluggish, a sign that the prior months’ bearish inertia hasn’t fully cleared. The 14-day RSI, after plunging into extreme oversold territory below 30 in July, pushed above overbought levels past 70 during the $81,000 peak before curling back toward its 50 midline — a logical cooling-off after a rally of more than 40%. The MACD confirms this read: its histogram, sharply positive in July, is now flattening as price approaches the $81,479 resistance.
4-hour chart: compression ahead of a decision
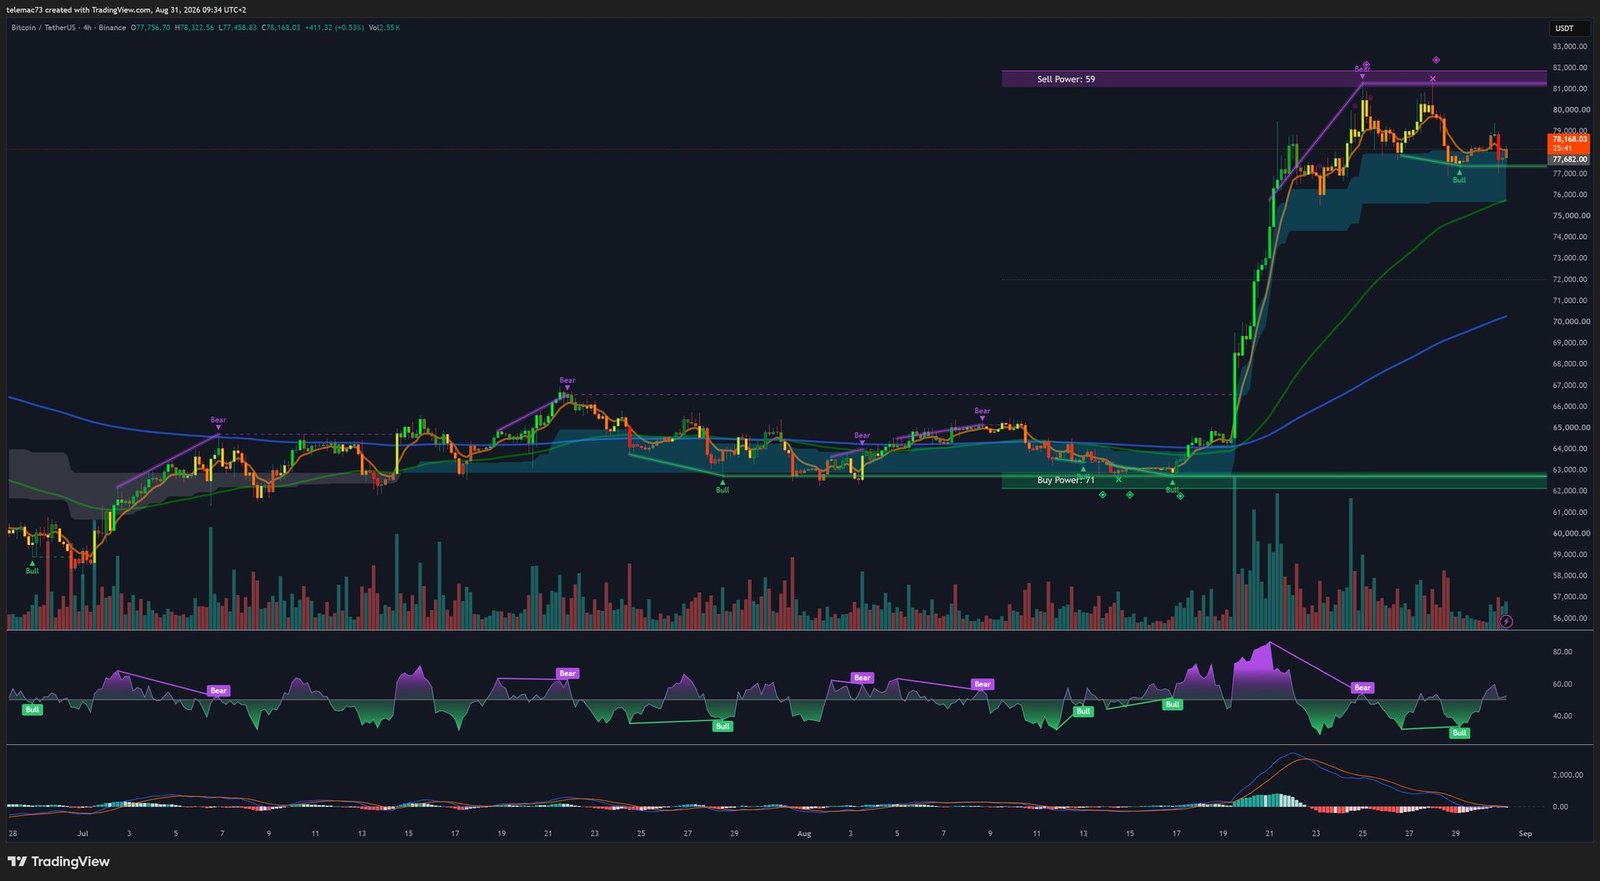
On the 4-hour timeframe, key for swing traders, price entered consolidation after the vertical run from $62,000. The current pattern oscillates between a complex bull flag and a symmetrical triangle, with lower highs compressed by a descending trendline. Price is riding the upper edge of a cloud-like support zone, whose defense is seen as vital for the short-term bullish case. The major pivot sits in the $76,000 range; a clean break below would open the door to the liquidity gap identified on the heatmap.
Momentum oscillators are flashing caution: the 4H RSI, after flirting with 85 during the $81,200 peak, now trades in a neutral 45–55 band, unable to bounce convincingly above 60. More concerning, the 4H MACD has confirmed a Death Cross, its histogram widening into negative territory — a divergence from the daily timeframe that points to algorithmic selling pressure and long-position liquidations on this scale.
15-minute chart: the mechanics of high-frequency trading
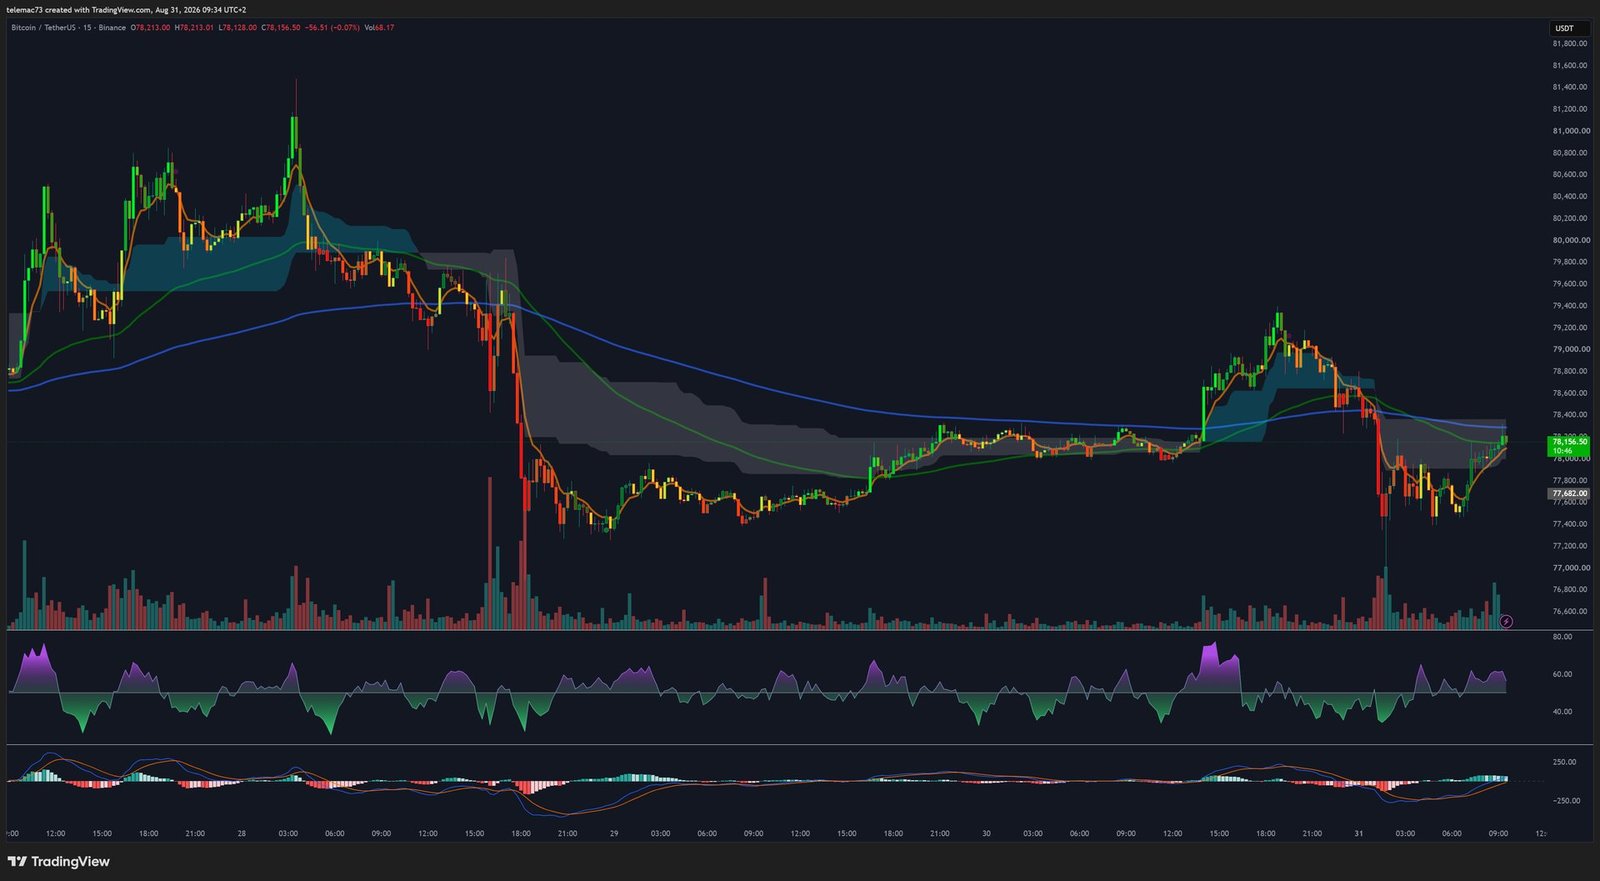
On the 15-minute chart, the market is trading in a choppy volatility regime that’s ill-suited to trend-following strategies. After a local high near $79,500, an abrupt reversal wiped out intermediate supports down toward $77,400, a move consistent with a classic stop-loss sweep. Price is now trying to stabilize inside a falling wedge, with short-term moving averages acting as dynamic resistance. The 15m RSI, which plunged below 25 during the drop to $77,400, mechanically bounced back toward 50, while the MACD keeps producing whipsaws around its zero line — together pointing to a market in wait-and-see mode, caught between the $81,479 sell wall and fear of a break below the $76,000 pivot.
Key technical levels at a glance
| Parameter | Chart read | Heatmap correlation |
|---|---|---|
| Ultimate resistance | ~$81,200 (Sell Power, 1D) | Ask wall at $81,479 |
| Major pivot | ~$76,000 (4H support) | Liquidity gap |
| Macro support | ~$57,000 (Buy Power, 1D) | Bid accumulation at $57,800 |
| Momentum | 4H MACD Death Cross, 1D RSI turning down | Market makers on standby |
| Price patterns | 15m wedge / 4H triangle / 1D V-bottom | Contraction before directional expansion |
Two scenarios heading into Q4
Bullish continuation scenario. If buyers defend the $76,000–$78,500 zone, the 4H compression triangle could build enough potential energy to trigger a bullish breakout, supported by continued Treasury bond purchases, still-healthy ETF flows, and FINMA’s protective custody framework. Clearing $81,479 could trigger a short squeeze, propelling Bitcoin into fresh price-discovery territory between $81,000 and $86,000, with the $126,198 all-time high as a further horizon should the momentum hold.
Retracement scenario. The fatigue signals building on the 4H momentum indicators (Death Cross, an RSI unable to bounce) shouldn’t be dismissed. If inflation forces central banks into a more restrictive stance than expected, risk appetite could dry up in favor of defense and technology equities. A structural close below $76,000 would invalidate the 4H bull flag and could trigger cascading liquidations down to a retest of the whale floor at $57,800.
Conclusion
Bitcoin sits at a genuine inflection point: real-world adoption keeps advancing (payments, AI integration, Switzerland’s protective regulatory framework), yet market microstructure reveals a decisive tug-of-war between inflationary macro conditions and institutional accumulation strength. How the current chart compression resolves — between the $81,479 wall and the $57,800 floor — will largely dictate the asset’s trajectory into the end of 2026.
Disclaimer: This article is provided strictly for educational and informational purposes. It does not constitute investment advice, a recommendation to buy or sell, nor a solicitation to trade digital assets. Cryptocurrencies are volatile, high-risk assets; always do your own research (DYOR) and consult a qualified financial advisor before making any investment decision.

