



As August 2026 draws to a close, Bitcoin is trading in a dense, nervy consolidation zone around $77,500. After flirting with the symbolic $80,000 threshold, the asset suffered a sharp technical and psychological rejection, the direct result of aggressive profit-taking against a structural resistance band between $80,000 and $82,000. This pullback is no isolated accident: it stems from the unwinding of leveraged derivatives positions and a sudden slowdown in spot ETF inflows.
This analysis offers a 360-degree view of the situation: the macroeconomic and institutional flows currently driving the market, the Swiss regulatory framework reshaping digital-asset custody, the liquidity mapping revealed by the order-book heatmap, and finally a multi-timeframe technical study (daily, 4-hour, 15-minute) that puts this move into context.
Institutional Flows: The ETF Shock
The macroeconomic backdrop remains defined by persistent inflationary pressure and growing distrust of fiat currency. Against this backdrop, gold and Bitcoin ETFs together pulled in roughly $7 billion in combined inflows over just five trading sessions — a record that reflects an institutional push to hedge against a perceived dollar crisis.
The initial breakout toward $80,000 was amplified by a classic short squeeze: short sellers, caught offside, were forced to buy back their positions in a hurry, fueling a self-reinforcing rally. US spot ETFs acted as a central catalyst during this phase, pulling in $1.92 billion in the breakout week alone — with standout days in which the IBIT ETF alone recorded up to $517 million in single-day inflows.
But the mechanism reversed abruptly. On August 29, 2026, US spot Bitcoin ETFs posted net outflows of $201.81 million in a single day, ending a nine-day consecutive inflow streak that had drawn more than $3 billion into the ecosystem. This “whiplash effect” coincides almost to the day with the technical rejection of price beneath the $80,000-$82,000 zone — a sign that institutional algorithms are actively taking profits rather than waiting for further fundamental confirmation.
For the uptrend to resume sustainably beyond all-time highs, so-called “crypto-native” demand and on-chain adoption will need to pick up the slack from institutional demand that remains too dependent on ETF flows.
Switzerland vs. the European Union: Two Regulatory Philosophies
Bitcoin’s resilience cannot be fully understood without examining the evolving legal framework governing its custody and institutional adoption. Two blocs stand in contrast: the European Union, with its prescriptive and harmonized MiCA regulation (EU 2023/1114), and Switzerland, which has opted for a principles-based approach rather than rigid rules — the FINMA token taxonomy of 2018, anti-money-laundering law, and the Distributed Ledger Technology (DLT) Act, in force since August 2021.
The cycle’s most consequential regulatory event remains FINMA’s publication, on January 12, 2026, of Guidance 01/2026 on the risks associated with the custody of crypto-based assets. The Swiss regulator clarified that banks may hold crypto-assets as segregable deposits protected in the event of bankruptcy — provided the assets remain available to clients at all times and are held in either individual custody or collective custody with flawless record-keeping. Conversely, holdings kept in an omnibus account without a register of each client’s fractional share receive no such protection in insolvency.
| Dimension | European Union (MiCA) | Switzerland (FINMA & DLT Act) |
|---|---|---|
| Legal form | Single regulation, directly applicable across 27 member states | FINMA taxonomy + AMLA + sector-specific DLT Act |
| Style | Prescriptive, harmonized | Principles-based, case-by-case analysis |
| Insolvency treatment | National frameworks under CASP prudential requirements | Clear statutory segregation guaranteed by the DLT Act |
| Custody delegation | Regulated for third parties within the EEA under MiCA passport | Permitted where supervision and bankruptcy protection are equivalent |
This segregation requirement is pushing wealth managers toward hybrid, highly regulated custody solutions, sidelining unsupervised players. Looking further ahead, the Swiss Federal Council opened a consultation (closing in February 2026) aimed at creating, by 2027, two new licensing categories: one for payment-instrument institutions (stablecoins) and another dedicated specifically to crypto-asset custody and trading.
What the Order-Book Heatmap Reveals
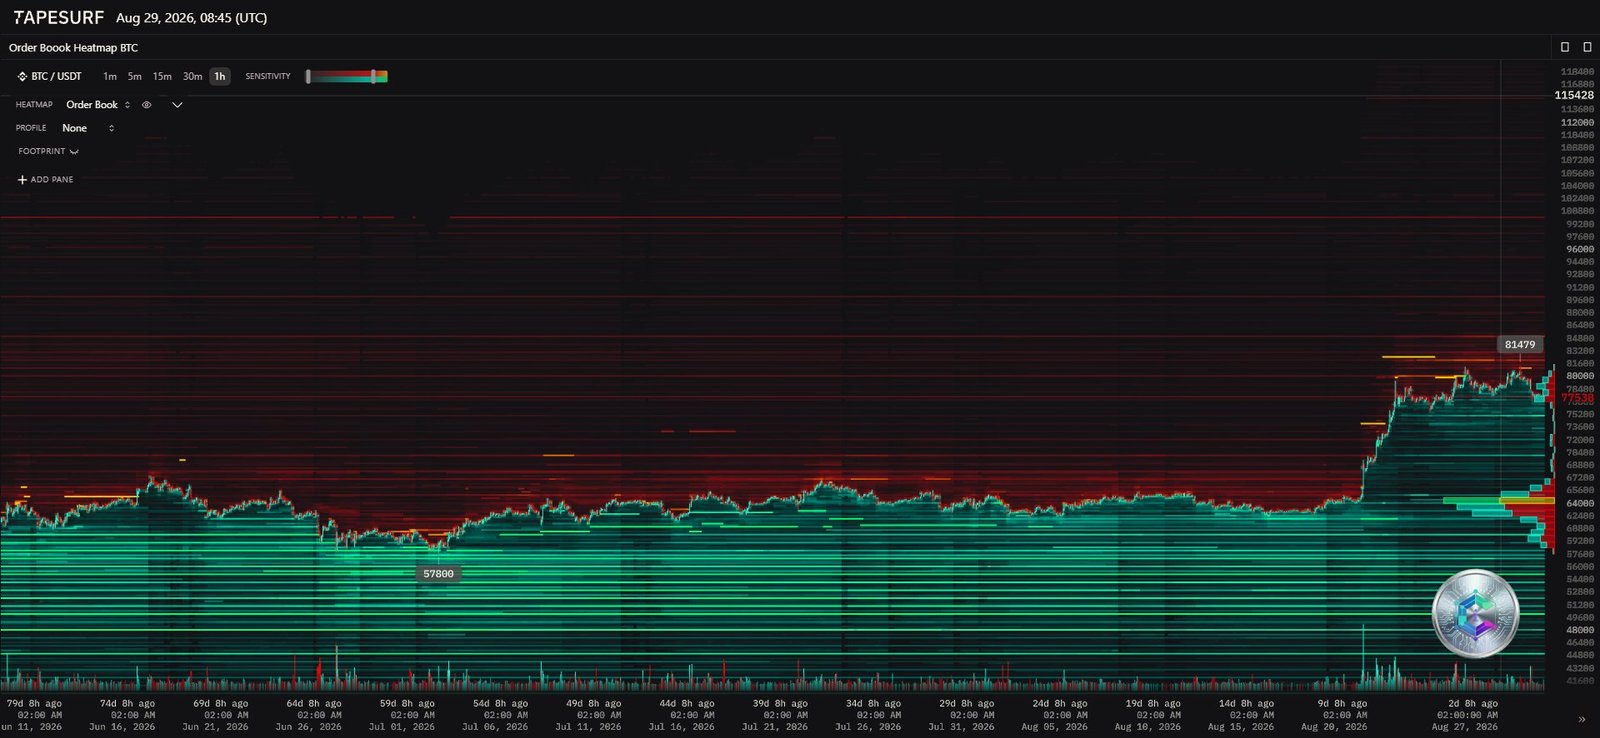
Even before looking at candlesticks, the order-book heatmap offers a valuable piece of information: where latent liquidity actually sits. In the upper strata, an exceptionally dense sell wall stands at $81,479, marked by intense, time-persistent red-orange lines — a signature of genuine institutional sellers rather than simple spoofing.
Until this wall is absorbed by sustained buying flows (ETFs, macro catalysts), any breakout attempt is likely to be repelled, generating rejection wicks on the upper candles. Conversely, the lower strata of the book show a solidly built support structure, with dense green bands spanning $57,000 to $64,000. Market makers and macro funds appear to view this range as a fair-value zone, justifying active accumulation.
This asymmetric map sums up the current situation well: deep downside risk is cushioned by robust latent demand, while immediate upside potential is capped by disciplined institutional supply.
Multi-Timeframe Technical Analysis
Daily Chart (1D): Bullish Macro Trend, Fading Momentum
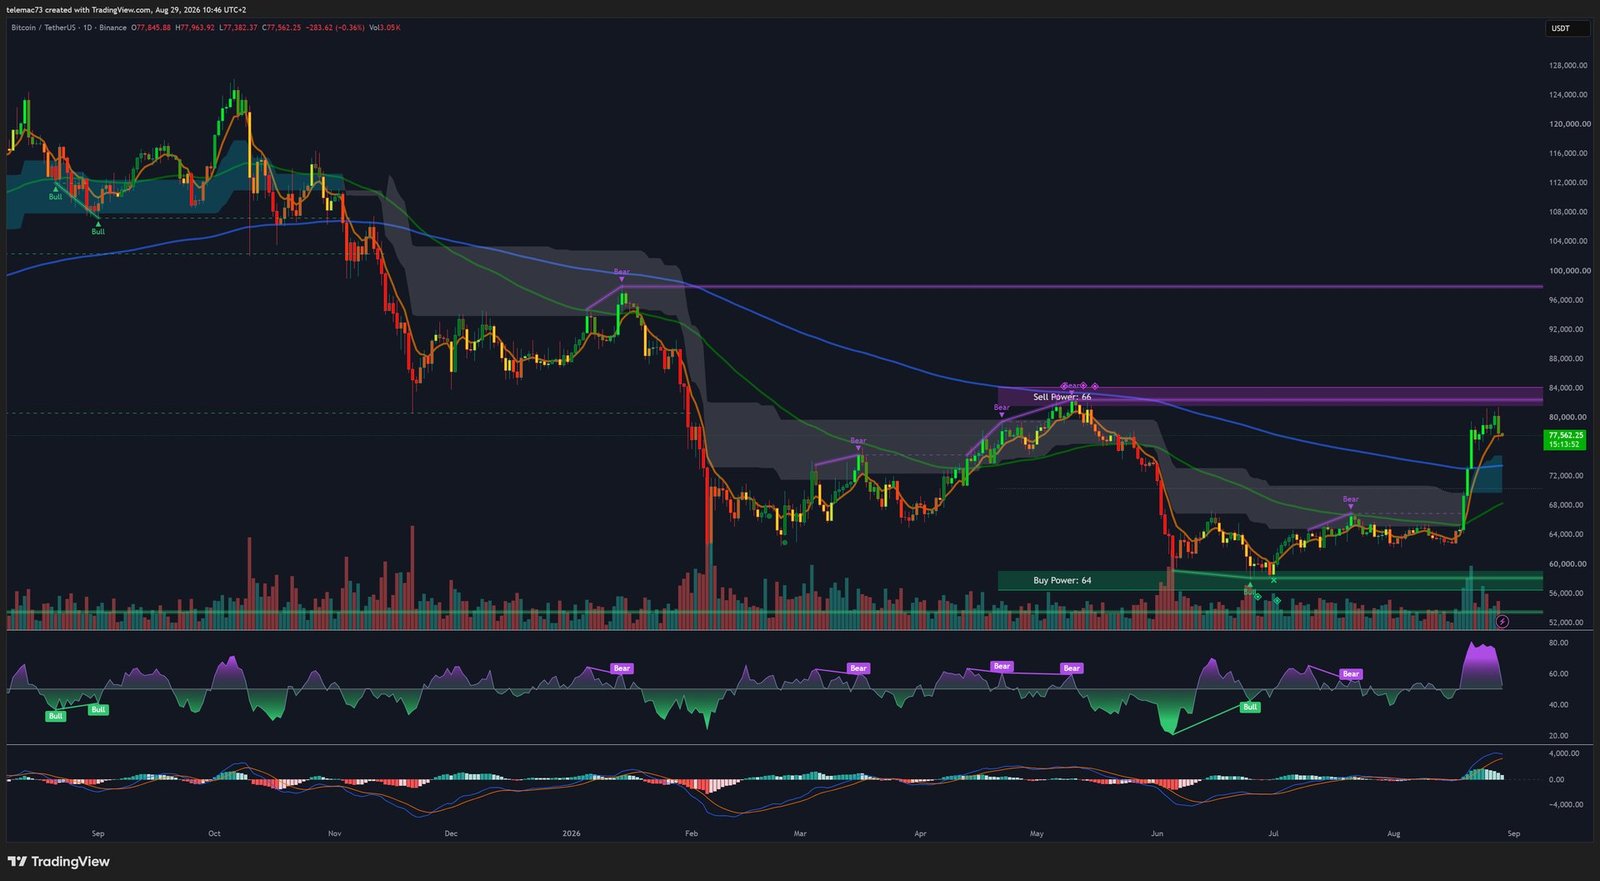
On the daily scale, Bitcoin is trading around $77,562, within an undeniably bullish long-term trend following an extended winter accumulation phase. A structural “Sell Power” resistance sits around $83,000, while a “Buy Power” pivot support appears near $58,000, reinforced by a confluence of indicators around $64,000.
The daily RSI, after a deep foray into overbought territory, is showing signs of cooling and a possible hidden bearish divergence: price is printing marginally higher highs while the oscillator is tracing lower highs. The MACD, whose histogram remains broadly positive, has flattened noticeably — a sign of fading directional acceleration, though no major bearish crossover has yet been formally confirmed.
4-Hour Chart (4H): Flag Consolidation, Confirmed Bearish MACD
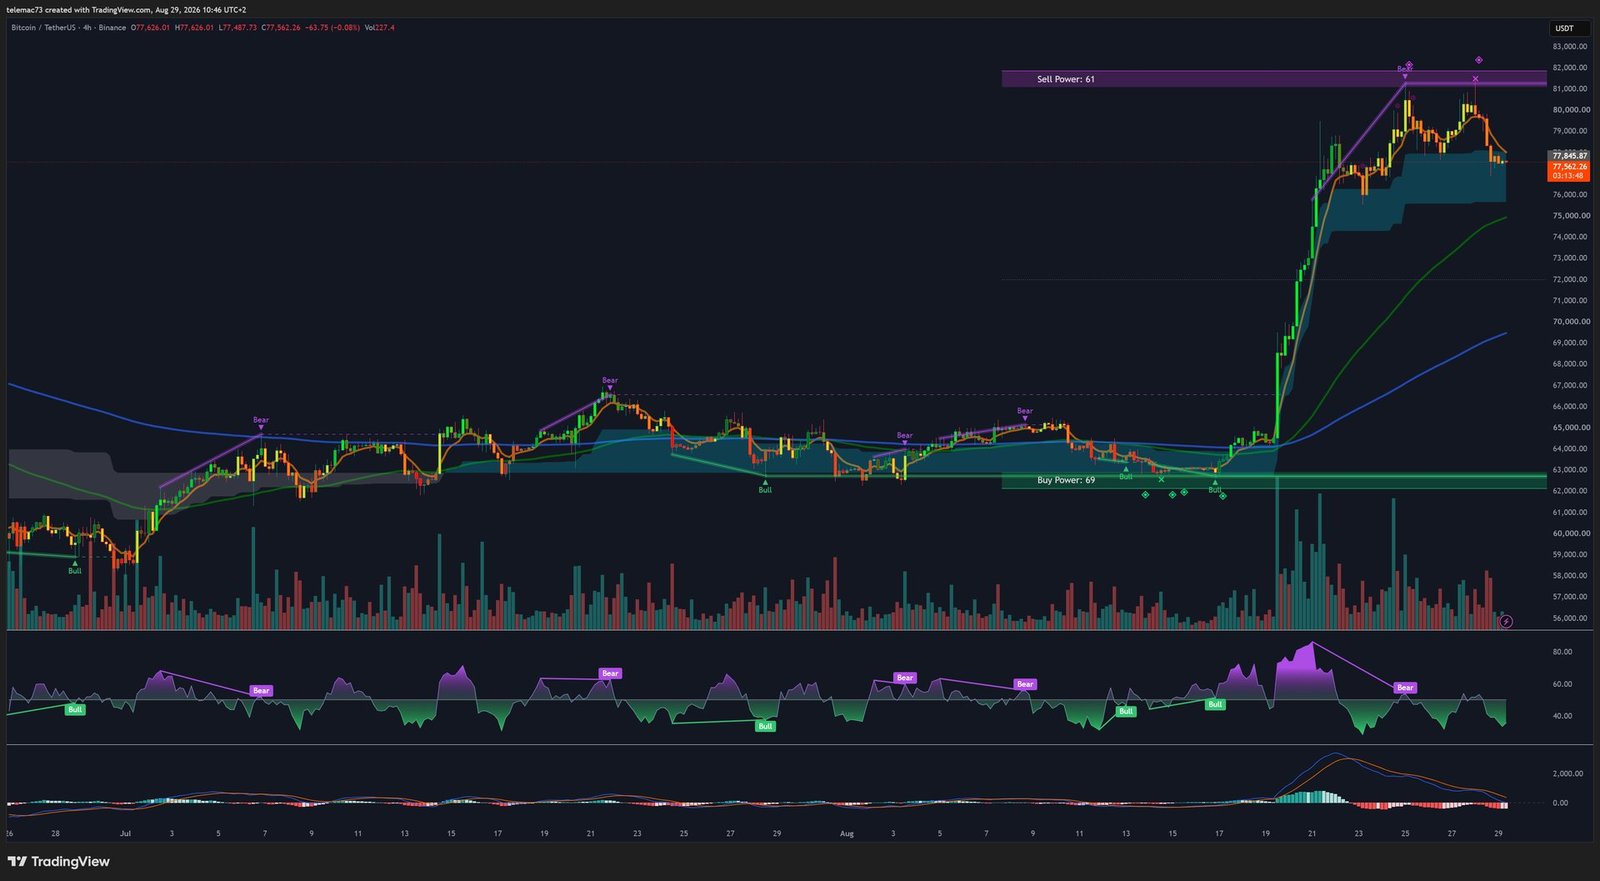
On this timeframe, favored by swing-trading funds, price staged a vertical impulse from $62,000 to local highs of $82,000 before giving way to the current consolidation. The structure resembles a bull flag or an asymmetric compression triangle, with intraday “Sell Power” resistance around $81,000 and institutional “Buy Power” support at $62,000.
The 4H RSI has slid back toward its neutral midline (50), reflecting a market catching its breath after the euphoria. More significantly, the 4H MACD has officially completed a bearish crossover (death cross), with the histogram now printing red continuously. This signal confirms that the current consolidation has a high probability of extending in time.
15-Minute Chart (15m): Extreme Oversold Conditions, Bounce Attempt
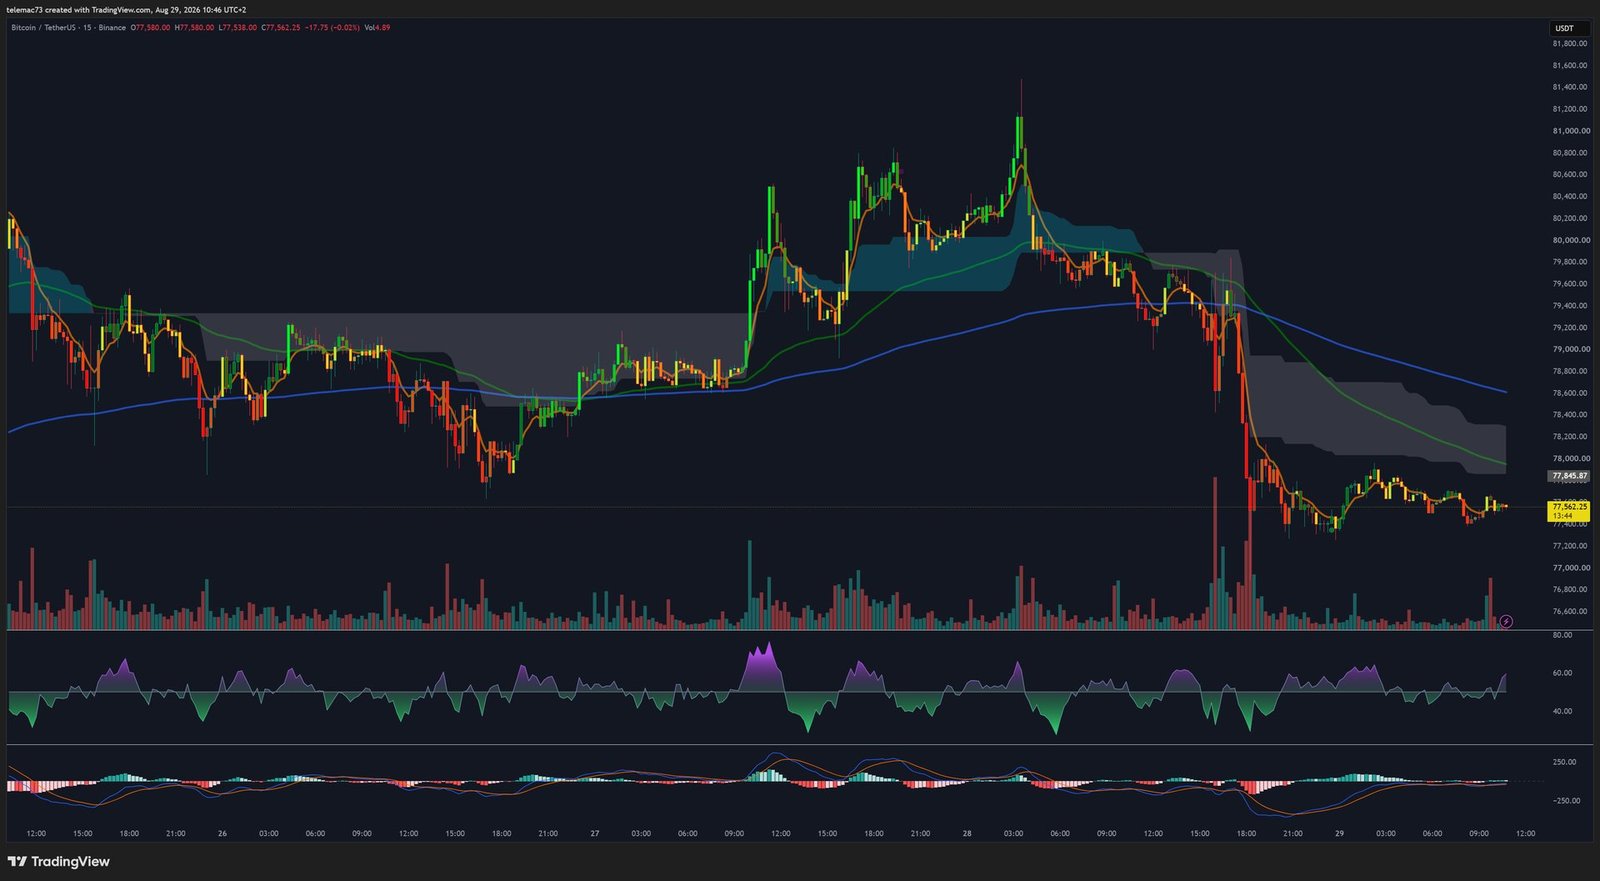
On the very short-term chart, the 15-minute timeframe illustrates the brutality of crypto market microstructure: a clean breakdown of a triangular compression zone, turning the former support into resistance, with a sequence of lower highs and lower lows typical of a short-term downtrend.
That said, the oscillators point to a possible reversal: the RSI has plunged into extreme oversold territory, well below the 30 threshold — a zone that has historically been fertile ground for mechanical bounces. The MACD, though deeply negative, shows a contracting histogram, suggesting selling pressure is running out of steam. A potential golden cross on this timeframe could trigger a relief rally, though it would immediately face resistance around $79,000.
Key Levels at a Glance
| Timeframe | Trend | Key Support | Key Resistance | RSI | MACD |
|---|---|---|---|---|---|
| Daily (1D) | Bullish (macro) | ~$64,000 | ~$83,000 | Overbought, latent bearish divergence | Bullish but fading momentum |
| 4-Hour (4H) | Consolidation (flag) | ~$68,000 | ~$81,000 | Neutral | Confirmed death cross |
| 15-Minute (15m) | Bearish (micro) | ~$77,000 | ~$79,000 | Extremely oversold | Contracting, bearish momentum fading |
Strategic Takeaway
Bitcoin has reached a decisive crossroads in its institutional maturation. The rejection beneath the $81,000-$82,000 resistance is no anomaly: it flows directly from moderating ETF flows and strategic profit-taking after a parabolic performance phase. The heatmap confirms the presence of a sell wall at $81,479 that will require fresh capital inflows to be overcome.
At the same time, the robustness of supports between $58,000 and $64,000 now rests on an increasingly solid regulatory foundation, with FINMA’s Guidance 01/2026 reinforcing institutional confidence by guaranteeing asset segregation. The confluence of a fading daily RSI and a confirmed bearish 4H MACD argues for an extended sideways consolidation while the market works off the excess leverage built up during the run to $80,000.
In the near-to-medium term, the outcome will hinge on the standoff between the $81,479 liquidity wall and institutional buying volume. A vigorous revival of macro demand for non-sovereign assets could gradually absorb this wall and reignite price discovery. Conversely, a prolonged failure to break through it would send price back toward the accumulation zones identified between $57,000 and $64,000.
Disclaimer: This article is intended strictly for educational and informational purposes. It does not constitute investment advice, a recommendation to buy or sell, nor a solicitation to trade digital assets. Cryptocurrency markets are highly volatile and involve a risk of capital loss. Do your own research (DYOR) and consult a licensed financial advisor before making any investment decision.

