


Ethereum just posted one of its most dramatic moves of the year: a near-20% surge in 48 hours, pushing price toward the $2,400 mark. Far from a random spike, this explosion sits at the intersection of three major forces — a historic monetary pivot from the US Federal Reserve, rapidly shifting on-chain fundamentals, and a technical structure methodically flipping from bearish to bullish. Here is the full picture, from the macro backdrop down to order-book microstructure.
The Fed pivot: the macro fuel behind the rally
Understanding ETH’s current dynamics requires looking back at the liquidity shock earlier this month. A confluence of disappointing US labor data, geopolitical tension, and a surprise rate hike from the Bank of Japan triggered a violent unwind of yen carry trades. Crypto markets, open 24/7, absorbed much of the resulting selling pressure, with the VIX volatility index spiking above 65%. Ethereum, a high-beta asset, shed more than 20% over the month as a result.
The turning point came at Jackson Hole, where Fed Chair Jerome Powell unambiguously signaled the start of a rate-cutting cycle, pointing to a softening labor market. Futures markets now price in, with near certainty, a cumulative 100 basis-point cut across the remaining FOMC meetings this year. Looser monetary policy mechanically reduces the appeal of the dollar and sovereign bonds, redirecting institutional capital toward risk assets — a historically favorable tailwind for Ethereum as the backbone of Web3 infrastructure and decentralized finance.
The political dimension adds another speculative layer, with recurring talk of a potential national strategic reserve in digital assets. Even if centered on Bitcoin, such a move would legitimize the broader asset class and could channel fresh capital into the Ethereum ecosystem.
On-chain fundamentals: between the Dencun effect and an institutional rush
The Dencun upgrade reshaped network economics by drastically cutting transaction costs for Layer-2 solutions like Optimism, Arbitrum, and Base. The direct consequence: mainnet fee revenue dropped, slowing ETH’s burn mechanism (EIP-1559) and making the asset mildly inflationary in the short term — a point closely watched as competing chains like Solana gain fee-generation ground.
Yet overall ecosystem activity shows no sign of fatigue. USDC-related volumes have jumped 400% since January, with August transfer volumes topping $1.1 trillion. Lending protocol Aave logged more than $6 billion in borrowing volume over the summer, with over 40,000 active borrowers — a record since 2022.
On the supply side, the market also had to absorb an idiosyncratic shock: Jump Trading unwinding positions, injecting roughly $470 million worth of ETH in a single weekend. That shock was largely offset by inflows into US spot Ethereum ETFs, with net inflows exceeding $114 million for the month according to CoinShares, alongside massive private accumulation — some entities now hold 4-5% of circulating supply via staking mechanisms. Such concentration reduces floating liquidity on exchanges, fertile ground for a short squeeze on any renewed upside impulse.
Reading the heatmap: where the real liquidity walls sit
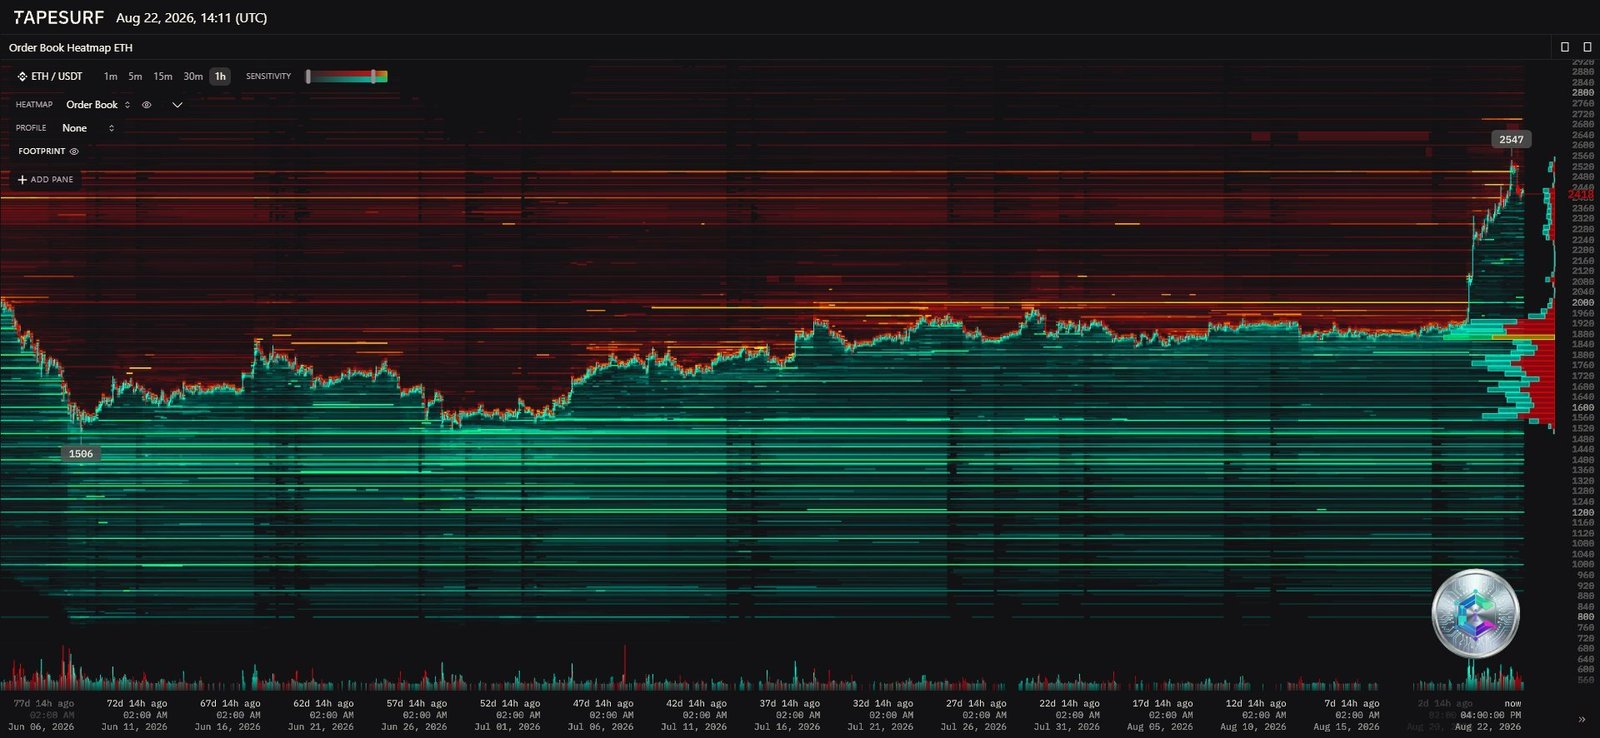
Order-book depth analysis (heatmap) offers valuable insight into market makers’ intentions. A massive buy wall sits around the $1,500 zone, where colossal limit orders clearly acted as a launchpad for the recent rebound. Conversely, a very dense sell wall thickens above $2,450 and especially around the psychological $2,500 threshold — a gravitational resistance that will need to be « consumed » by sustained market buying.
Between the two, a liquidity void identified around $1,900 explains the remarkable fluidity with which price traveled through that zone during its ascent: with no significant resting orders, algorithms exploit these low-resistance pockets to generate impulsive moves. At this stage, the market appears geared toward a liquidity sweep above $2,500, with a potential trigger of short sellers’ stop-losses fueling a squeeze effect.
Multi-timeframe technical analysis
Daily chart (1D): from bear to bull market
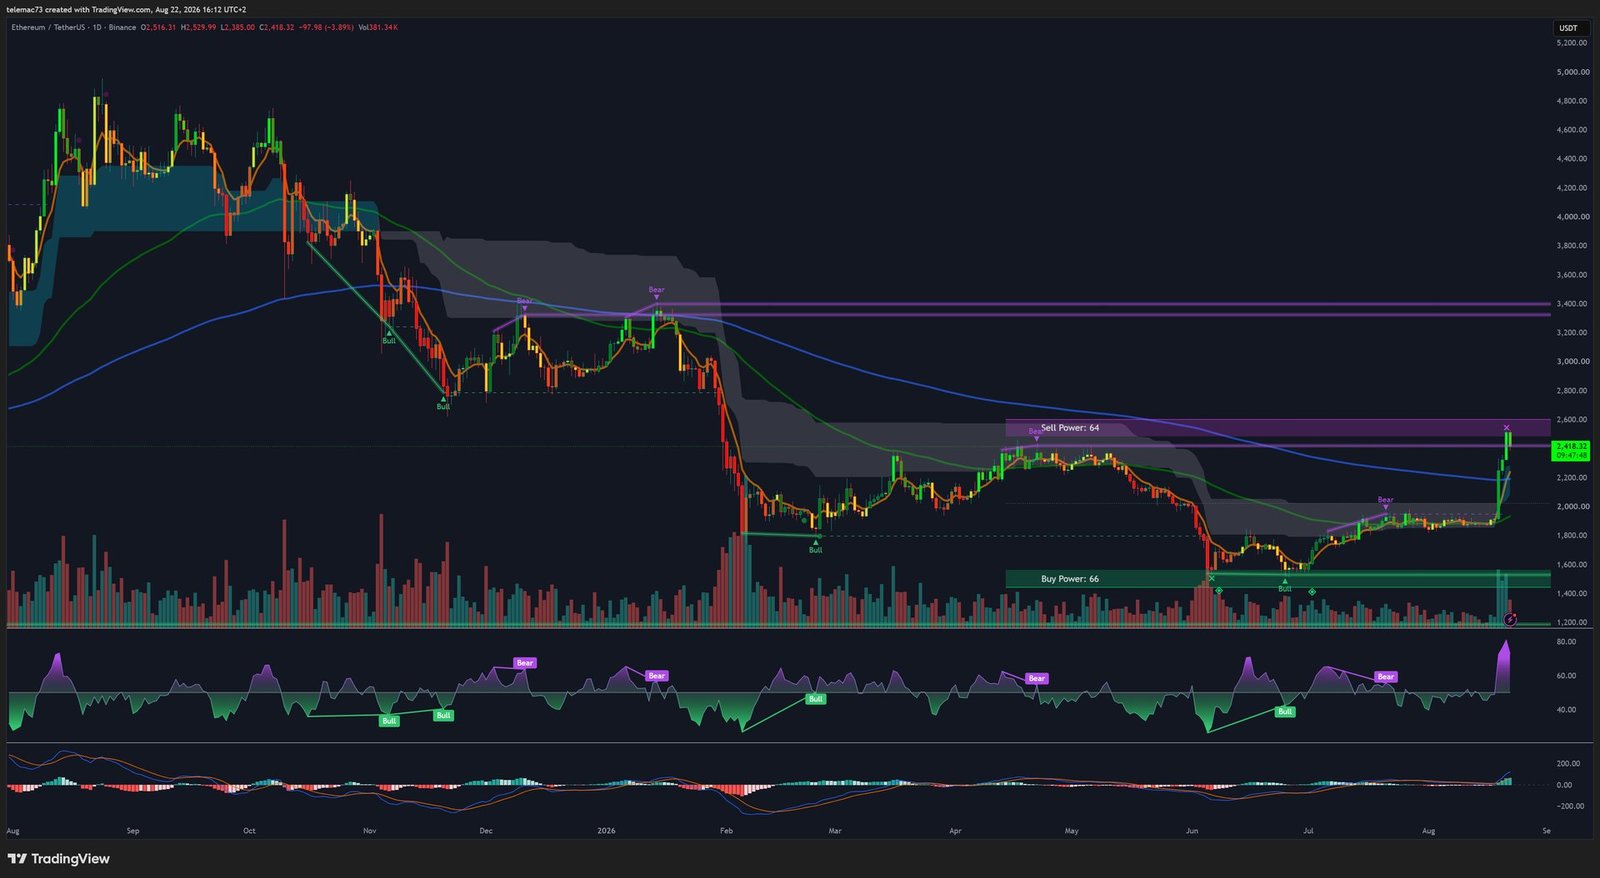
The daily chart shows an aggressive « V-bottom » off the historic support zone around $1,510, reflecting a final seller capitulation followed by absorption from smart money. Key structural levels to watch: critical support at $1,820, a new structural floor at $2,300, pivot resistance at $2,375, and a major target at $2,450.
The most significant development is the clean break above every exponential moving average: price now trades roughly 10% above the 200-day EMA ($2,128), officially marking the shift from a structural bear market to a bull market. The 50-day EMA’s trajectory toward the 200-day EMA even hints at a « Golden Cross » in the coming weeks — a signal heavily respected by institutional trading algorithms.
On momentum, the 14-day RSI peaked at 84.8, signaling a deeply overbought condition that argues for healthy consolidation rather than a sell signal. The MACD, with a histogram of +48.7, confirms exceptional bullish momentum and rules out any immediate bearish crossover risk.
4-hour chart (4H): a bull flag taking shape
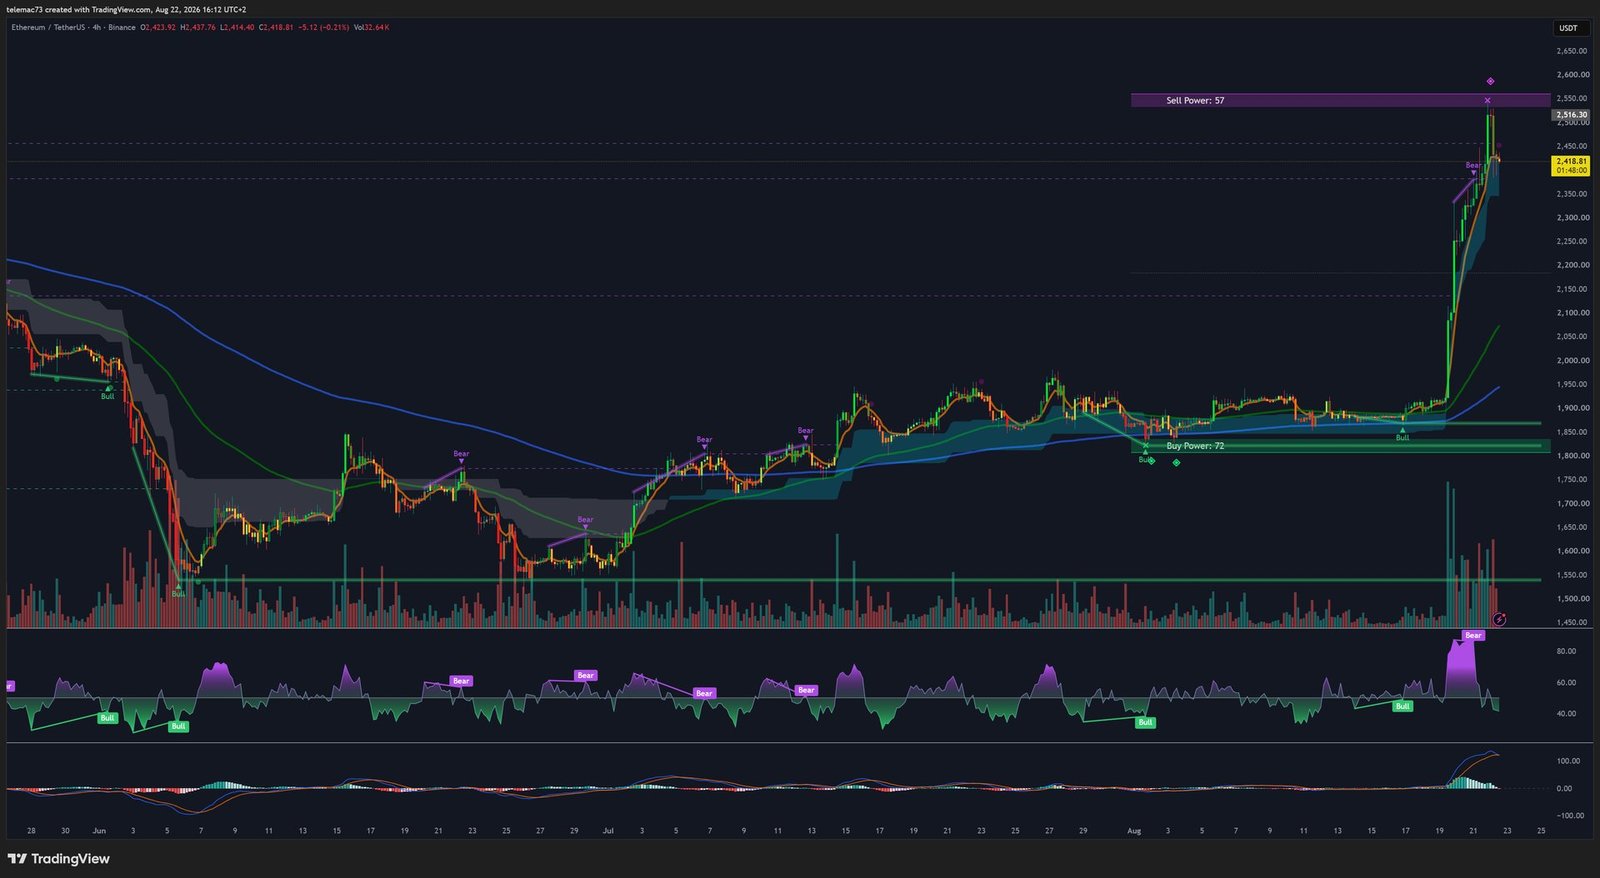
On this scale, the mechanics of the rally are clearly visible: strong buy power in the prior consolidation zone near $1,800, followed by a clean break of descending resistances. As price approached $2,550, sell power took over and volumes contracted — a typical breathing phase after a breakout.
Price is currently drawing the early stages of a bull flag, with a substantial flagpole (the vertical rally from $1,900). A resolution of this pattern on declining volume would validate a technical extension well beyond $2,800. RSI remains above 70 while the MACD histogram flattens without any significant price decline — a sign of healthy absorption of selling pressure. One caution flag: over $450 million in positions were liquidated across the network around Jackson Hole, with a notable share of overconfident long positions, a reminder of the persistent long-squeeze risk on this timeframe.
15-minute chart (15M): compression before the decision
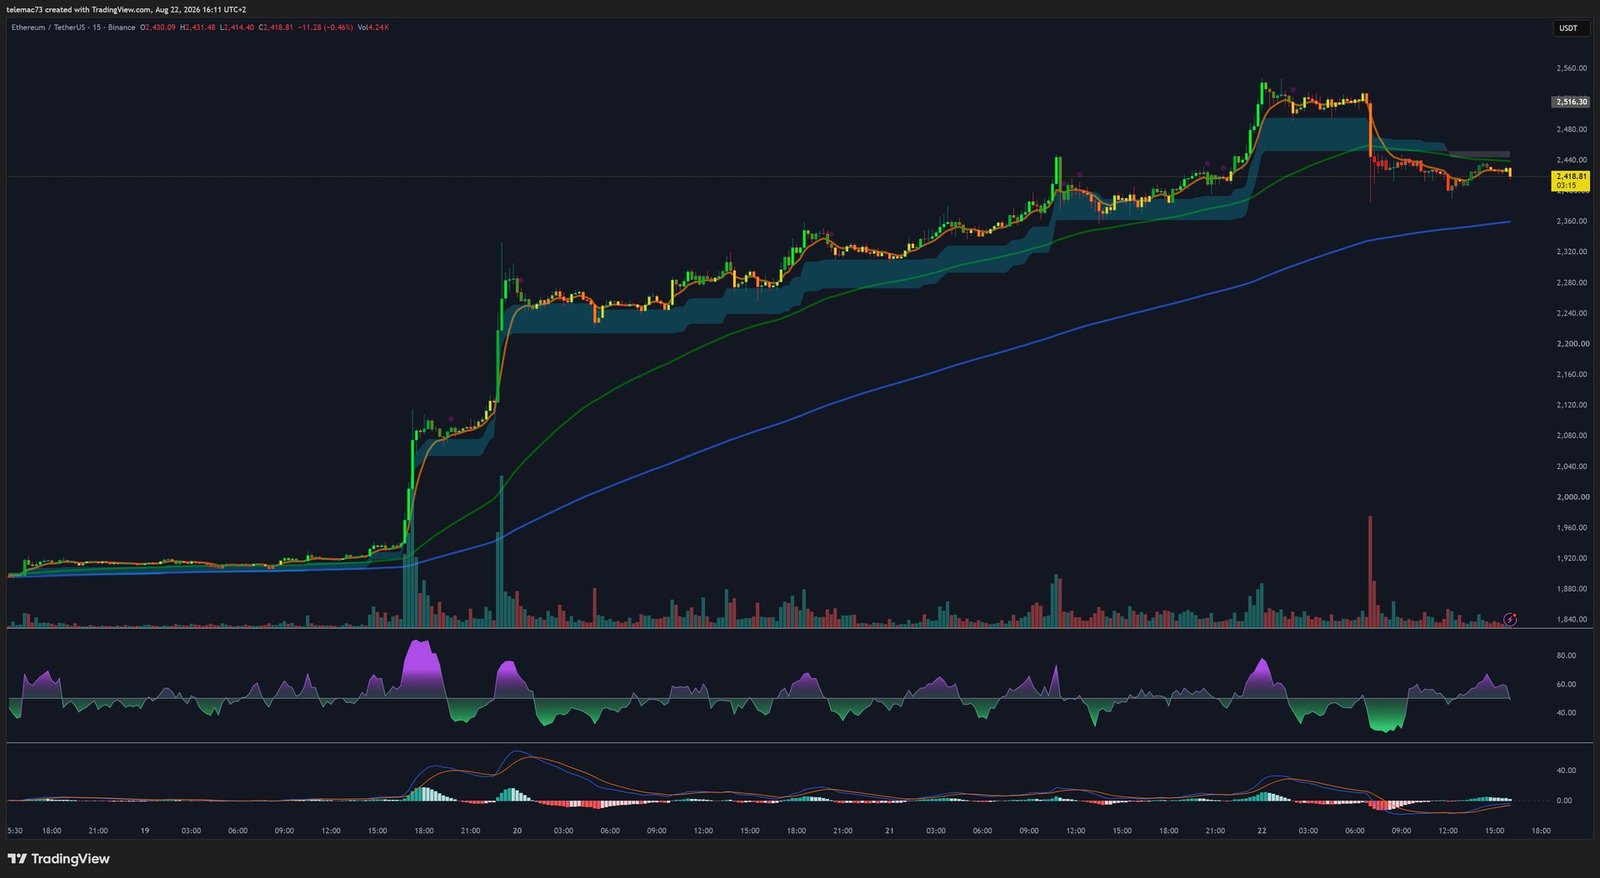
On the intraday scale, a symmetrical compression triangle has formed: lower highs capped by resistance near $2,450, and higher lows defending the $2,375 zone. This geometric compression signals an imminent breakout, and the broader bullish macro backdrop statistically favors an upside resolution. RSI, having returned to test its midline without meaningful loss of ground on price, is tracing a hidden bullish divergence — a resilience signal worth watching closely ahead of a break of the fast moving averages (EMA 20/50).
What history says: the statistics behind 15%+ daily gains
Analyst Jamie Coutts compiled every occurrence since 2018 where ETH posted a daily gain above 15% — the current move ranks 8th historically by that measure. Across the 16 completed cases, a clear pattern emerges: the longer the horizon, the stronger the odds of a positive outcome.
| Horizon | Probability of positive return | Average return observed |
|---|---|---|
| 30 days | 50% (8 of 16) | Sideways consolidation or moderate pullback |
| 90 days | 62.5% (10 of 16) | Gradual trend resumption |
| 180 days | 75% (12 of 16) | +59.3% on average |
Two scenarios from here
Base case — bullish continuation. This rests on the confluence of a dovish Fed, sustained ETF inflows, and a bullish-flag technical structure. A consolidation phase between $2,300 and the local high would allow the daily RSI to work off its overbought reading toward the 60 zone, before a break of the 15M/4H triangle reignites the push toward the $2,500 sell wall. Some models even point, on a much longer horizon, to an extension toward the 2021 highs.
Risk case — retracement and liquidity test. If buyers repeatedly fail to break decisively above $2,400, a classic retest toward the daily 200-EMA ($2,128) becomes likely again — retracing roughly 50% of the initial flagpole. Such a test would, in a rebound scenario, represent the year’s most attractive institutional buying opportunity. Conversely, a loss of the 200-EMA followed by a break below $2,000 would invalidate the bullish structure and turn the rally into a classic « bull trap. »
Ethereum sits at a genuine crossroads: a weekly close firmly established above $2,400, combined with the 200-EMA holding as support, would lay the groundwork for a new institutional super-cycle.
Disclaimer: This article is provided for informational and educational purposes only. It does not constitute investment advice, a recommendation to buy or sell, or a solicitation to trade digital assets. Cryptocurrency markets are highly volatile; do your own research and consult a qualified financial advisor before making any investment decision.

