


August 2026 — Bitcoin is navigating a particularly turbulent August, caught between conflicting institutional flows, persistent regulatory uncertainty in the United States, and a technical structure that leans decisively bearish. Currently trading around $63,970, the digital asset faces the worst seasonality of its annual calendar: since 2022, August has consistently posted negative returns, with a historical median of -7.87%.

A Growing Divide Between ETFs and Legacy Whales
The most revealing dynamic this month is the widening gap between two major categories of market participants. On one side, U.S. spot Bitcoin ETFs are showing remarkable resilience: the week ending August 7, 2026 saw net inflows of $853.54 million, their best weekly performance since April. BlackRock’s IBIT fund alone captured $693 million, roughly 81% of the total.
On the other side, this institutional demand is being absorbed by unexpected selling pressure. Strategy (formerly MicroStrategy) liquidated 1,690 BTC from its treasury in early August, a move formalized in an 8-K filing on August 10 that brought its balance down to 840,447 BTC while boosting its dollar reserves to $4.65 billion. This decision marks a notable departure from its historically strict hold policy and triggered an immediate shockwave across order books, pushing the price toward the $63,000 zone.
On-chain data confirms this shift: the net position of long-term holders dropped from 29,838 BTC on July 11 to just 15,766 BTC on July 26 — a 47% decline in accumulation. In other words, legacy holders are using fresh liquidity from ETFs to distribute their positions, creating a soft ceiling on price appreciation.
Macro Sensitivity Confirmed: The End of the “Digital Gold” Narrative
Bitcoin now shows a 94% correlation with the Russell 2000 ETF (IWM), evidence that institutional algorithms are treating it as a high-beta risk asset, extremely sensitive to global liquidity conditions. Upcoming U.S. Consumer Price Index (CPI) releases and JOLTS employment data will therefore be closely watched: a softer-than-expected inflation print could extend the precious metals rally into crypto, while a hawkish surprise would strengthen the dollar and trigger further profit-taking.
The CLARITY Act: U.S. Regulatory Gridlock Persists
The Digital Asset Market Clarity Act (H.R. 3633), designed to clarify the respective jurisdictions of the SEC and CFTC, remains stalled in the U.S. Senate. Passed by the House in July 2025, the bill hit a filibuster wall before the August 7, 2026 summer recess, largely due to ethics provisions barring senior federal officials from profiting off digital assets while in office. The vote has been pushed to September 14 — dangerously close to the November midterm elections.
As a direct result, prediction markets have sharply revised their expectations, with 2026 passage odds falling below 20% on Kalshi (down from 43% in late July). This legal vacuum keeps a regulatory risk premium in place, discouraging the most cautious institutional capital from entering at current prices.
By contrast, Switzerland continues to build its institutional lead through FINMA, which published a supervisory communication in January 2026 requiring full bankruptcy-remoteness protection for custodied crypto assets. This contrast is fueling a geographic arbitrage of institutional capital toward Europe, fragmenting global liquidity on unregulated exchanges in the process.
Order Book Analysis: A Deeply Asymmetric Market
The order book heatmap reveals a pronounced imbalance. Price is currently hovering around the Volume Profile’s Point of Control (POC) at $63,938, a fragile equilibrium zone between ETF demand and whale supply.
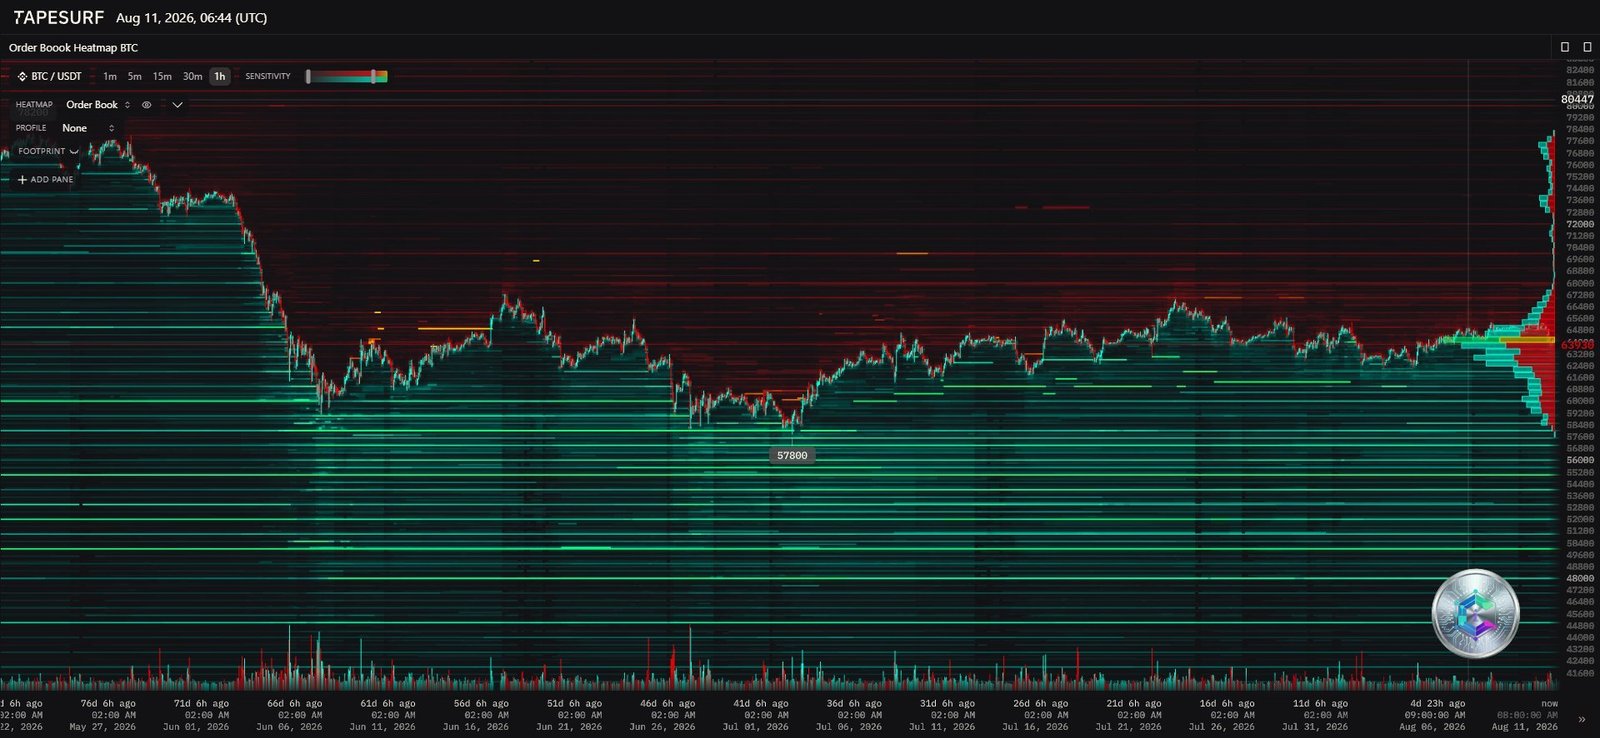
| Price Zone (USD) | Significance |
|---|---|
| 67,000 – 72,000 | Massive institutional sell wall |
| 65,000 | Psychological pivot, former support now resistance |
| 63,938 – 64,000 | Current equilibrium zone (POC) |
| 60,000 – 62,400 | Weak dynamic support, vulnerable |
| 57,500 | Major buy block, last line of defense |
| < 52,000 | Relative liquidity void, slippage risk |
The sell wall above $67,000 acts as a lid on any sustained bounce, confirming that legacy holders are actively distributing. The path of least resistance remains downward, with a likely liquidity-purge target near $57,500.
Multi-Timeframe Technical Analysis
Daily Chart: The Head-and-Shoulders Threat
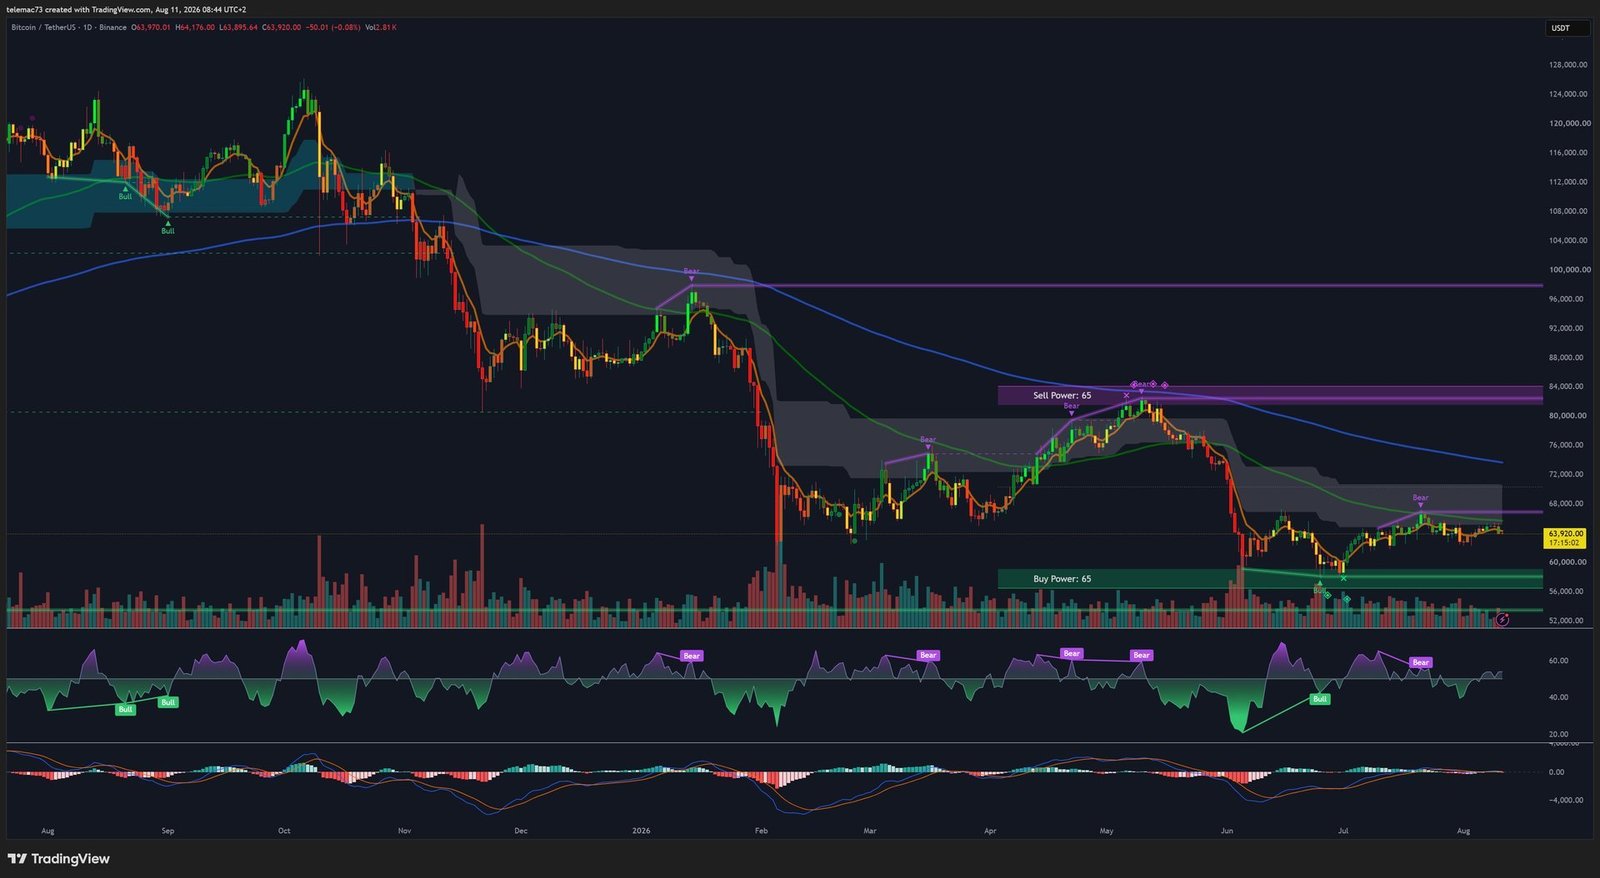
The daily chart is tracing a classic Head-and-Shoulders reversal structure. After a macro top near $84,000 (the head), price capitulated toward $56,000-$58,000 before forming the right shoulder around $67,000-$70,000 — on declining buy volume, a sign of fading demand. The neckline sits around $60,965: a confirmed daily close below this level would validate a theoretical target near $41,266. The daily RSI remains below neutral, with a persistent bearish divergence against price stabilization attempts.
4-Hour Chart: Compression Triangle Breaks Down
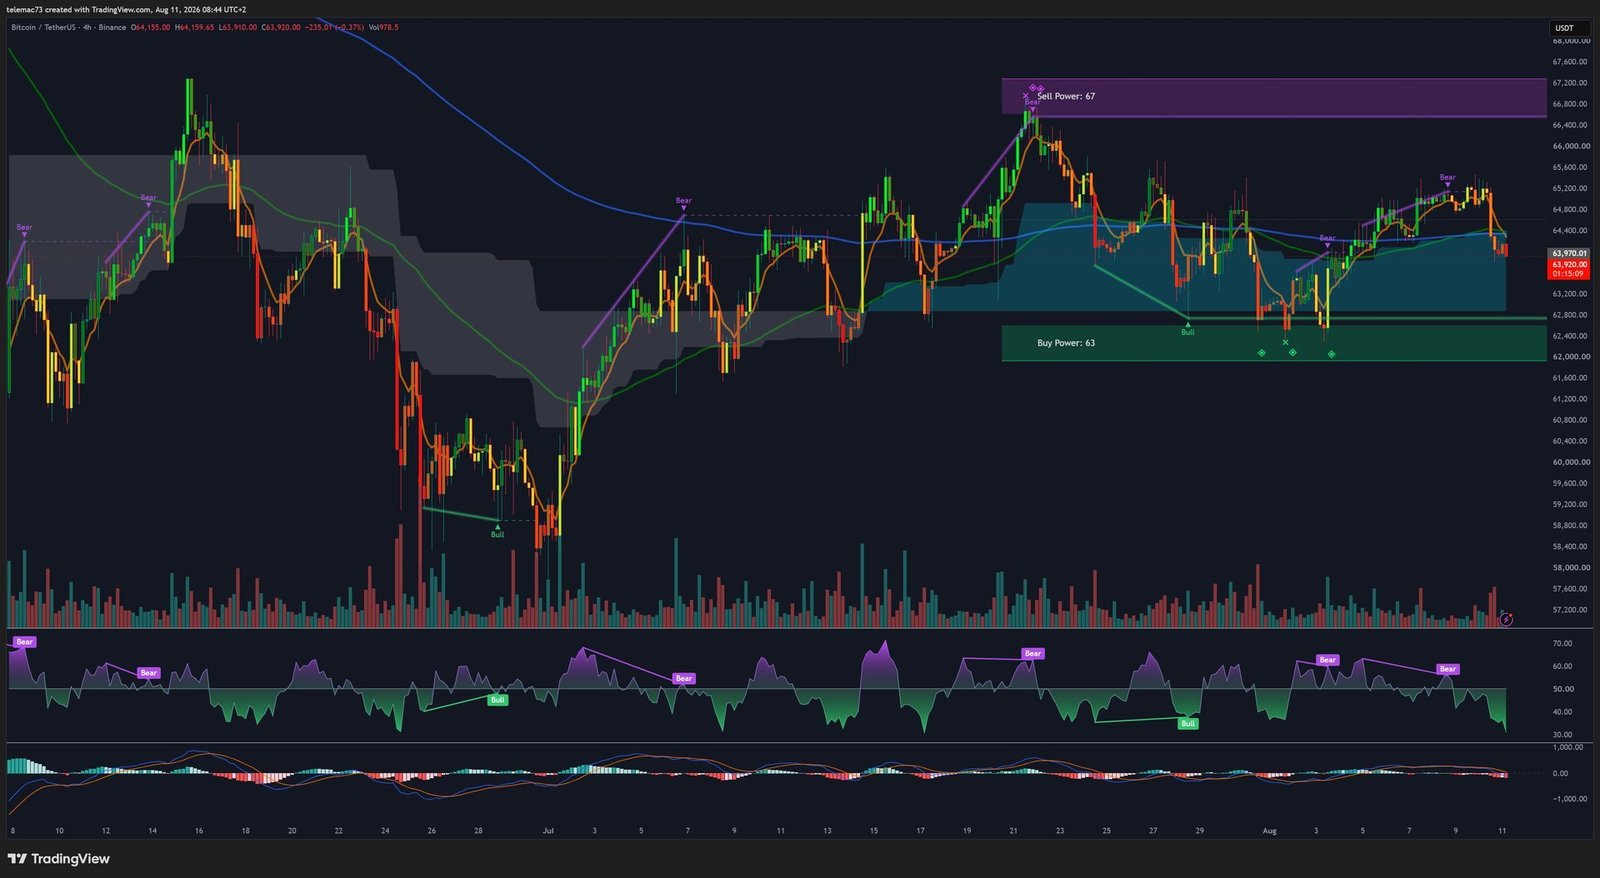
After weeks of compression between $62,400 and $67,200, the ascending triangle broke to the downside, turning what could have been a bull flag into a bearish continuation. A local Death Cross on the moving averages amplified the move, while the Ichimoku cloud rolls over bearish, adding dynamic resistance near $65,000.
15-Minute Chart: Extreme Oversold Conditions Post Flash-Crash
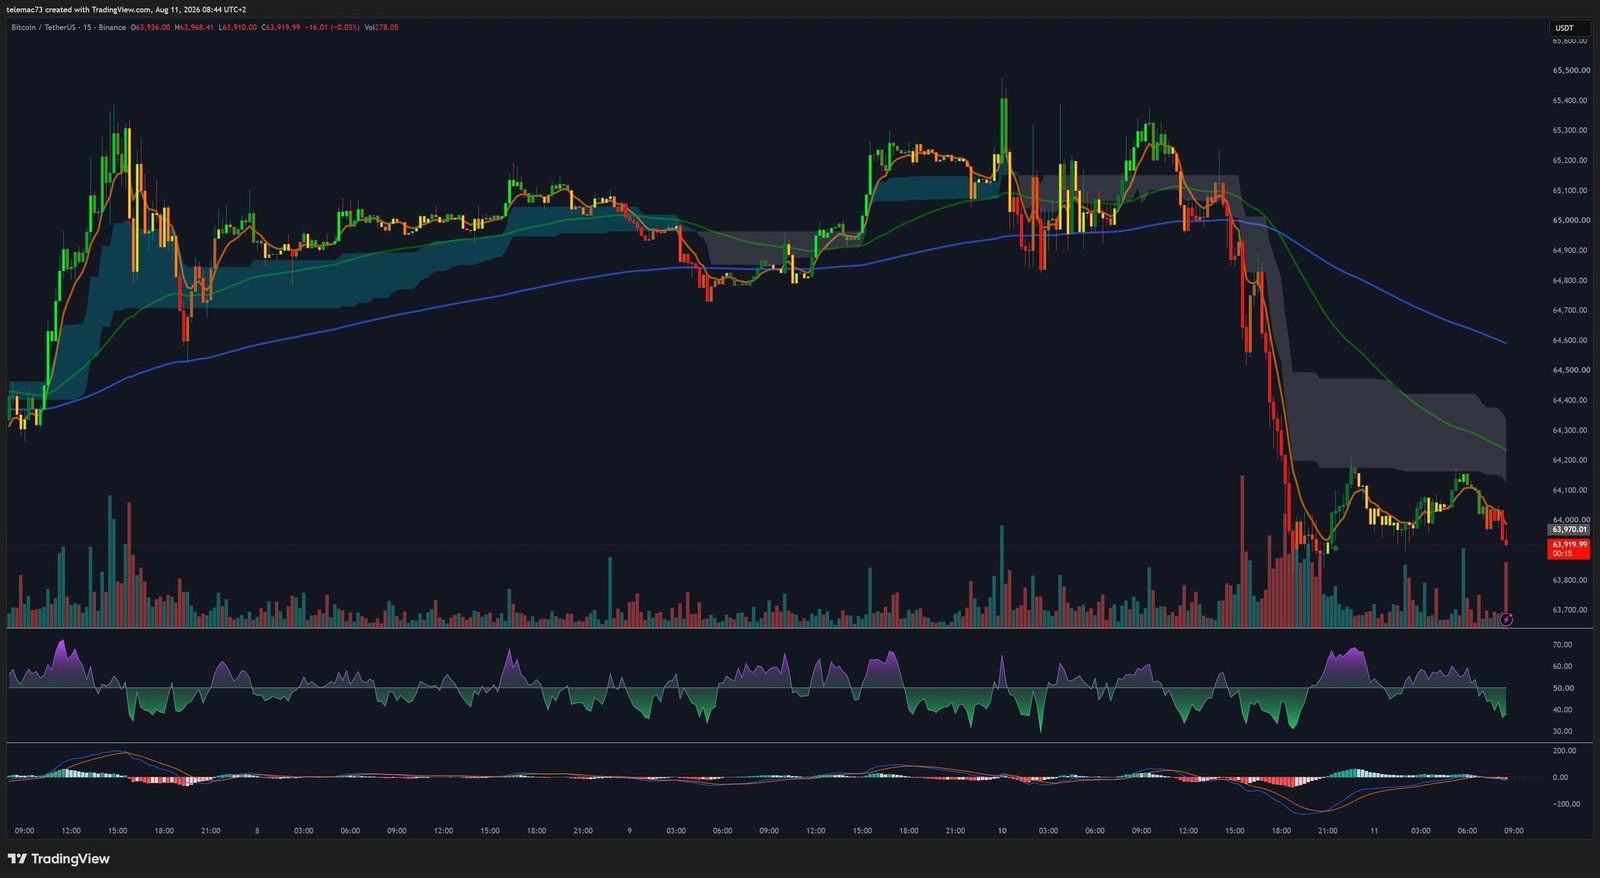
The short timeframe captures the violence of the August 10 institutional selloff: price pierced through its Ichimoku cloud to collapse below $64,000, on massive volume confirming genuine distribution rather than mere spoofing. The M15 RSI collapsed to around 15-20, an oversold reading that statistically calls for a technical bounce — though no reversal signal (Golden Cross) is yet visible on the MACD.
Key Levels Matrix
| Level (USD) | Category | Significance |
|---|---|---|
| 84,000 | Macro top | Invalidates the long-term bearish scenario |
| 67,200 | Major H4 resistance | Dominant sell wall, right shoulder |
| 65,000 | Psychological pivot | Immediate resistance on any bounce |
| 63,938 | Current price (POC) | Unstable equilibrium |
| 62,400 | H4 local support | Floor of the compression triangle |
| 60,965 | Critical structural support | Head-and-Shoulders neckline |
| 57,500 | Massive liquidity support | Institutional buy block, last resort |
| 41,266 | Theoretical bearish target | Projection if 60,965 breaks |
Conclusion
Bitcoin in August 2026 is locked in a war of attrition between passive ETF demand and the active distribution of corporate treasuries and legacy whales. Technically, the bearish resolution of the 4-hour triangle, combined with the looming daily Head-and-Shoulders structure, puts sellers firmly in control. The order book confirms this asymmetry, with an impenetrable wall above $67,000.
In the short term, extreme oversold conditions on the 15-minute chart could produce technical bounces, but these should be viewed as opportunities to reduce exposure rather than signs of a trend reversal. The $60,965 level will be decisive: holding it could allow for prolonged consolidation, while a breakdown would open the path toward $57,500, and potentially $41,266.
Disclaimer: This article is provided for educational and informational purposes only. It does not constitute investment advice or a recommendation to buy or sell any digital asset. Cryptocurrency markets are highly volatile and involve substantial risk of capital loss. Always conduct your own research and consult a licensed financial advisor before making any investment decisions.

