


As of August 10, 2026, Bitcoin (BTC) is trading in a pivotal consolidation zone between $64,000 and $65,000, with a market capitalization of roughly $1.3 trillion and a flat 24-hour move of +0.17%. This apparent calm masks a rare tug-of-war between voracious institutional demand — driven by spot ETF inflows — and systemic macroeconomic risks still weighing on overall sentiment. The Crypto Fear & Greed Index is stuck at 35, a persistent signal of caution among traders that stands in stark contrast to the euphoria seen across equity markets.
This analysis takes a multidimensional look at the market: the macroeconomic backdrop, institutional capital flows, liquidity microstructure via the TapeSurf heatmap, and finally a cross-timeframe technical study spanning the daily, 4-hour, and 15-minute charts.
The Macro Backdrop: The Strait of Hormuz Crisis and Global Inflation
Understanding Bitcoin’s current risk premium requires revisiting the extraordinary geopolitical context shaping 2026 monetary policy. Markets have been dominated since late February by the Strait of Hormuz crisis, a strategic chokepoint through which roughly a quarter of the world’s seaborne oil trade once flowed. The blockade imposed by Iran’s Revolutionary Guard Corps, following an aerial conflict involving the United States, Israel, and Iran, stranded nearly 20,000 sailors and 2,000 vessels, triggering the biggest oil shock since the 1970s, with Brent crude spiking to $126 a barrel in early March.
That energy spike reignited inflation fears and forced the U.S. Federal Reserve to keep rates elevated, draining liquidity available for risk assets. But early August marked a turning point: intense diplomatic negotiations between the U.S., Qatar, and Iran now point to an imminent reopening of the strait, with a Gulf official pegging the odds of a deal by mid-August at around 50%. Oil prices immediately dropped more than 4.5%, and markets now price a 56.7% probability of a Fed rate cut in September. That relief rally pushed the S&P 500 to a record high above $70 trillion in market cap, dragging Bitcoin along in its wake — correlation with the equity index now standing at 63%.
Institutional Capital Flows: The Quiet Absorption
U.S. spot Bitcoin ETFs are now the primary vector of demand. On August 4, these vehicles logged net inflows of more than $170 million in a single session, with $111.43 million of that flowing into BlackRock’s iShares Bitcoin Trust (IBIT) alone. That rebound followed $265 million in outflows on July 31, but the trend across four consecutive sessions confirms a reversal: roughly $745 million in cumulative net inflows, topped up by $381.6 million across the two sessions preceding August 10.
| Period | Vehicle | Net Flow | Implication |
|---|---|---|---|
| July 2026 | Spot Bitcoin ETFs (Total) | +$172.4M | Resilience after two months of losses |
| July 31, 2026 | Spot Bitcoin ETFs (Total) | -$265.4M | Tactical profit-taking |
| Aug 4, 2026 | Spot Bitcoin ETFs (Total) | +$170.0M | Absorption of selling pressure |
| Aug 4, 2026 | BlackRock IBIT | +$111.43M | Confirmed institutional leadership |
In a sign of sophistication rather than a loss of conviction, MicroStrategy sold 1,638 BTC for more than $105 million, bringing its cash reserve to $4 billion — a treasury move designed to secure its financial obligations without relying exclusively on BTC’s volatility. Notably, the market absorbed that sale without a meaningful correction, evidence of just how deep current liquidity runs.
On-chain, roughly 155,000 BTC (0.7% of circulating supply) has been firmly accumulated between $62,000 and $65,000, a behavior CryptoQuant describes as “absorption rather than capitulation.” In derivatives, open interest on futures fell from a peak of 776,000 BTC in early July to a healthier 740,000 BTC — a deleveraging trend that reduces the risk of cascading liquidations. The one blemish: a security flaw in the Coldcard wallet led to an estimated $88.6 million hack, reviving the debate over institutional custody versus self-custody.
Altcoins: Selective Rotation, Not a Broad Bull Market
Ethereum remains below the psychological $2,000 mark ($1,898–$1,915), trading at less than 40% of its August 2025 all-time high, despite solid spot ETF inflows ($365 million in July). The dispersion in performance across other assets confirms that liquidity remains selective rather than broad-based:
| Asset | Recent Performance | Observation |
|---|---|---|
| Cardano (ADA) | +10.51% to +14.00% | Outperformance tied to capital rotation |
| Binance Coin (BNB) | +1.27% to +16.46% | Strong rally over the week |
| Solana (SOL) | -3.00% to +16.46% | Extreme volatility |
| Dogecoin (DOGE) | -3.00% to +16.46% | Sensitive to retail liquidity |
| XRP | -2.68% to -12.64% | Persistent underperformance |
| Tron (TRX) | -0.03% to -12.64% | Relative weakness |
The TapeSurf Heatmap: A Glass Ceiling Against a Granite Floor
Order book analysis via the TapeSurf heatmap offers a precise X-ray of BTC/USDT’s current liquidity structure, with price hovering around $65,244.
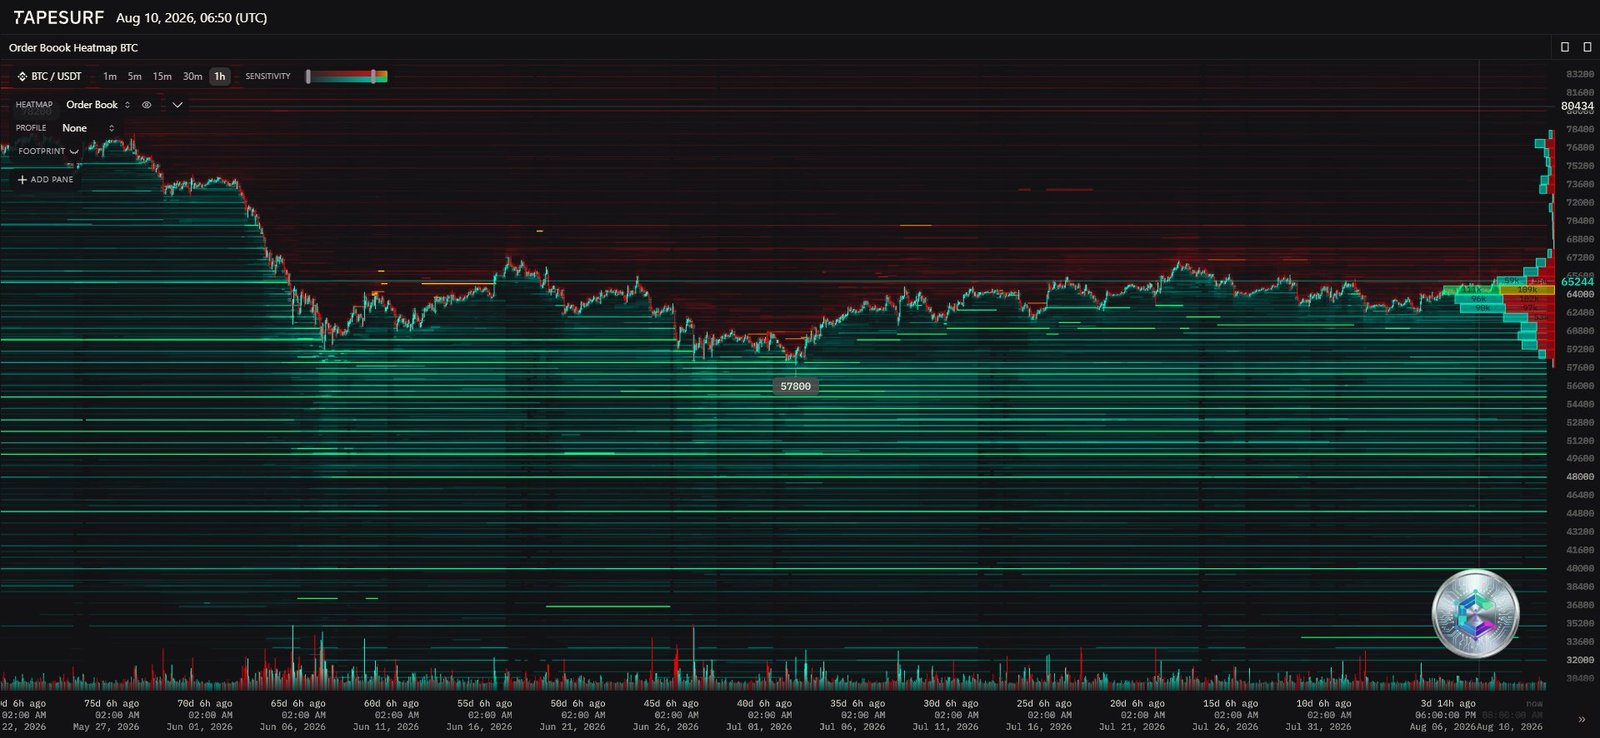
Above current price, a massive stack of sell orders (ask) thickens dramatically starting at $65,500 and extends up to $67,000. That wall represents tens of thousands of BTC placed by institutions, miners looking to cover operating costs, or algorithms programmed to sell rallies. Below current price, dense and continuous buy orders (bid) thicken from $64,000 onward, forming a particularly solid floor between $62,000 and $62,500 — a picture that visually confirms the on-chain accumulation of the 155,000 BTC mentioned above.
This squeeze between the red ceiling and the green floor is the essence of a volatility compression. Historically, this kind of setup precedes an explosive move once one of the two walls gives way under pressure, triggering a cascade of liquidations in the direction of the break.
Multi-Timeframe Reading: Daily, 4-Hour, 15-Minute
Daily Timeframe (1D): A Bear Market Exit in Progress
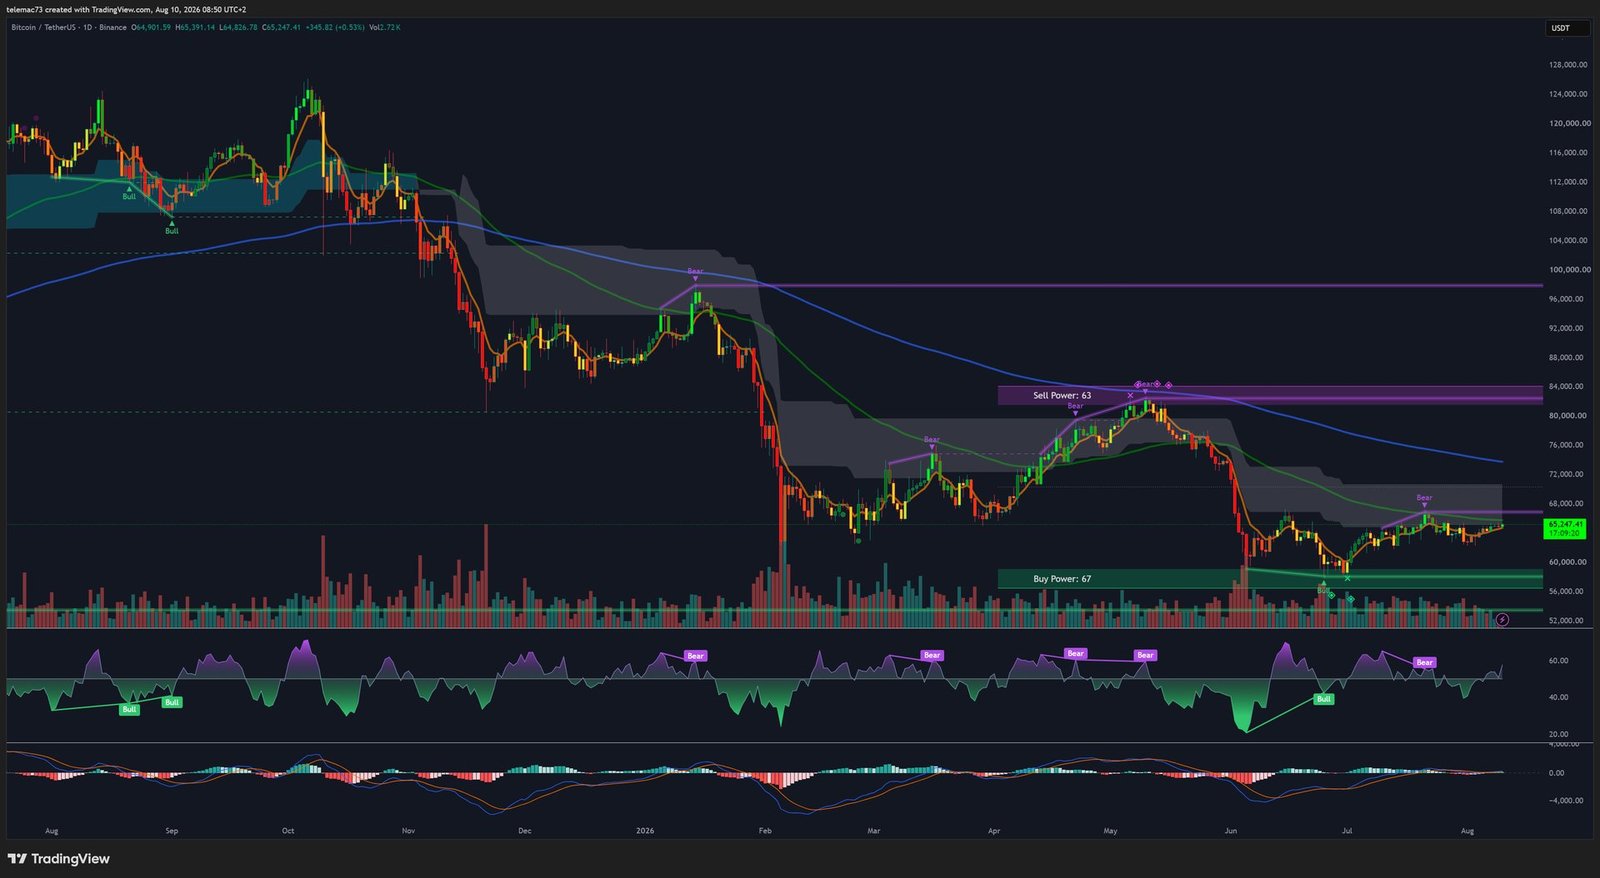
Bitcoin is still trading nearly 50% below its all-time high of $126,198 set in October 2025, in what looks like a long extraction from a bear market into a broad accumulation range. The critical pivot level is the 21-day simple moving average at $64,388, acting as a floatation line between bullish and bearish momentum. Holding above this average confirms buyers retain the directional edge.
On the MACD, the line remains in negative territory — a holdover from the prior bear market — but the histogram, increasingly small and green, points to fading medium-term sell pressure. The daily RSI hovers around 50, showing neither overheating nor panic, leaving substantial room to run should a bullish catalyst materialize.
4-Hour Timeframe: Compression Triangle and Order Blocks
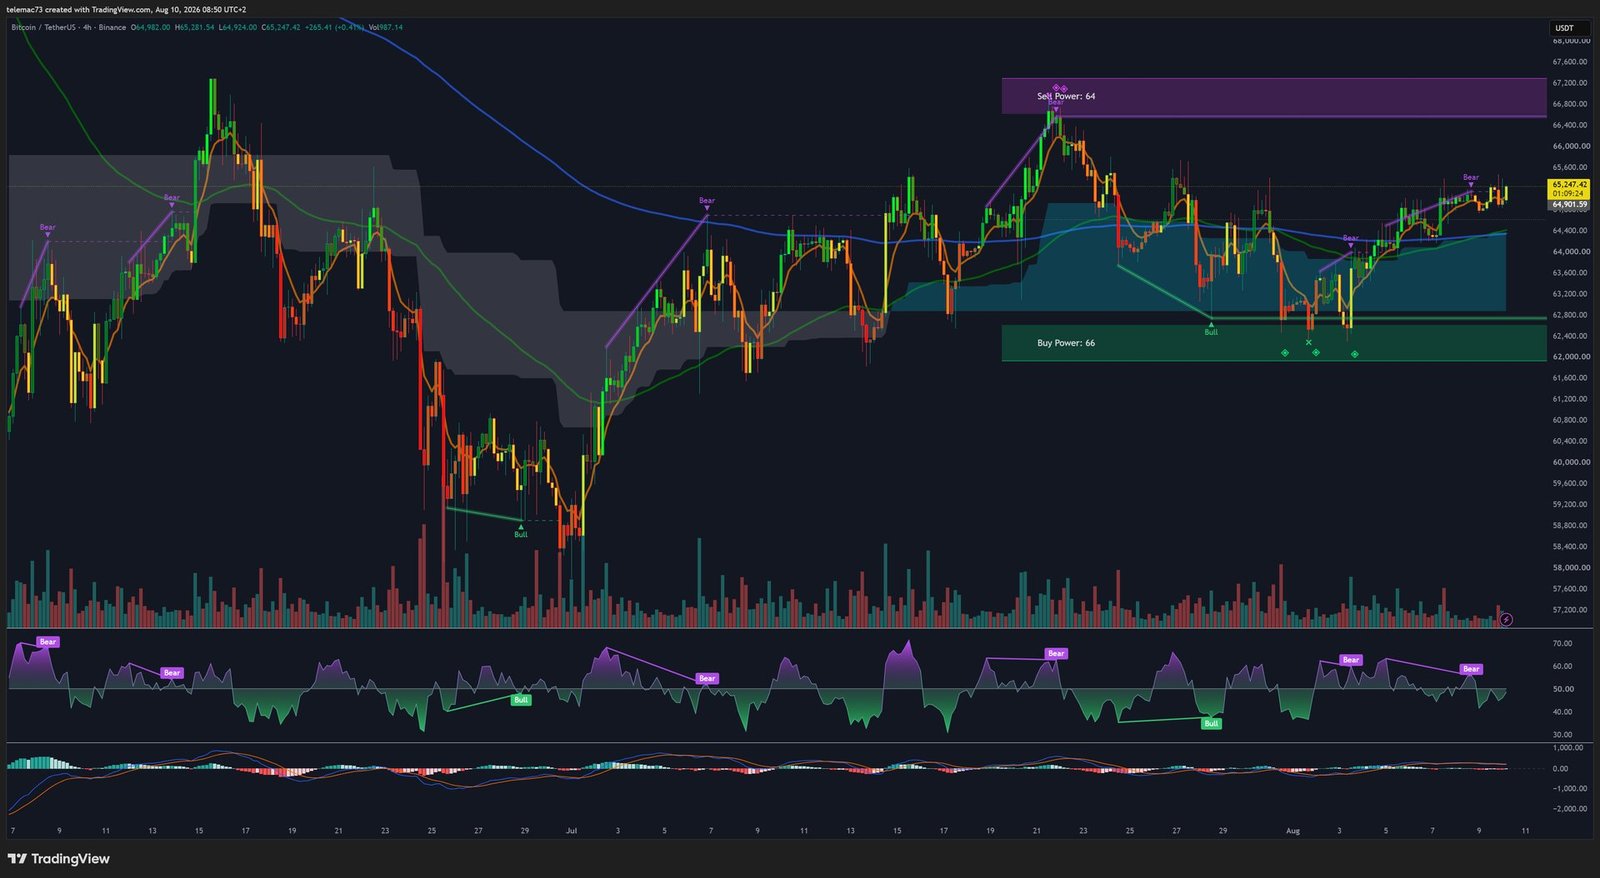
After an impulsive move off the $58,000 lows, price is consolidating into successive higher lows within a large bull flag, or symmetrical continuation triangle. A resistance zone (“Sell Power”) caps price action between $65,500 and $67,000, while a support zone (“Buy Power”) below $63,000 acts as a magnet for buying liquidity. Moving averages here are heavily intertwined, generating erratic bullish and bearish crossovers that lose predictive value in this compression regime. The 4H RSI is rhythmically sweeping the neutral 40–60 zone — the real resolution will come once it breaks out with force, echoing a decisive break of the triangle.
15-Minute Timeframe: Microstructure and Stop Hunting
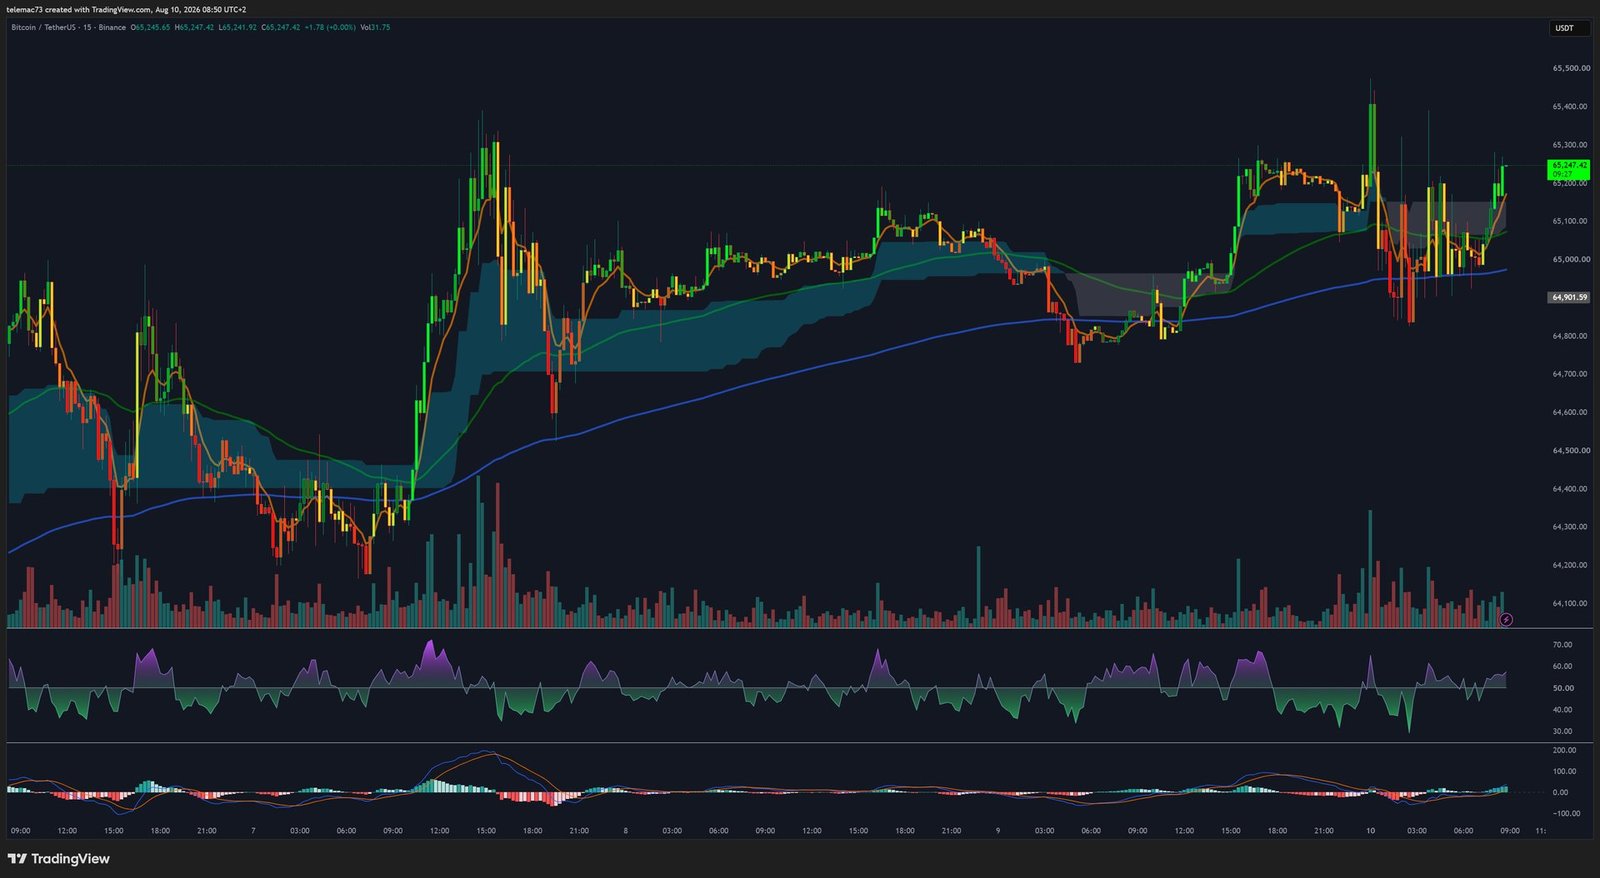
On this timeframe, favored by high-frequency traders, price action is fragmented by a lack of discretionary participation against arbitrage bots. Price swings violently inside a narrow band, between a dynamic support near $64,900 and resistance around $65,300. Long wicks on either side of candles betray stop-hunting operations, where liquidity is deliberately targeted at the extremes of the intraday range before a sharp snap back to the mean. The 15M RSI, oscillating between peaks near 80 and troughs below 20, confirms the absence of any short-term trend and favors mean-reversion scalping strategies.
Key Level Summary
| BTC Price (USDT) | Classification | Timeframe | Characteristics |
|---|---|---|---|
| $67,000 – $68,000 | Macro resistance | 1D | Prior structural high; a break signals price discovery |
| $65,500 – $65,600 | Intermediate resistance | 4H | “Sell Power” block, ask wall on the heatmap |
| $65,000 – $65,300 | Intraday resistance | 15M | Short-term distribution zone |
| $64,388 | Central pivot | 1D / 4H | 21-day SMA, directional floatation line |
| $64,000 | Psychological support | Multi | Defended by ETF liquidity inflows |
| $63,000 – $63,125 | Intermediate support | 4H | “Buy Power” block |
| $62,000 – $62,500 | Macro support | 1D | Floor of on-chain accumulation (155k BTC) |
Conclusion: A Compression That Calls for Patience
Institutional liquidity structure has rarely looked this resilient: despite MicroStrategy’s strategic profit-taking, U.S. ETFs are more than absorbing local selling pressure, while the derivatives market cleans itself up and on-chain accumulation continues without any sign of capitulation. Bitcoin’s short-term directional fate, however, still hinges on the resolution of the Strait of Hormuz crisis: a confirmed de-escalation would defuse the risk of global stagflation and give the Fed the room it needs to cut rates as early as September.
Technically, Bitcoin is locked inside an extremely tight volatility compression triangle, boxed in by a distribution wall at $65,600 and an accumulation floor at $62,000. A converging daily MACD and a neutralized RSI suggest a violent expansion in variance is imminent. Professional discipline in this environment means avoiding aggressive bets inside the range — particularly given the erratic moves on the 15-minute chart — and waiting for either a firm daily close above $65,600 confirmed by volume, or a loss of the 21-day SMA at $64,388, before committing to a directional position.
Disclaimer: This article is provided strictly for educational and informational purposes. It does not constitute investment advice, a recommendation to buy or sell, or a financial solicitation of any kind. Cryptocurrency markets are highly volatile and carry a risk of capital loss. Always do your own research (DYOR) and consult a licensed financial advisor before making any investment decision.

