


On August 7, 2026, Bitcoin is trading in an unusually tight corridor, oscillating between $64,137 and $64,842, unable for three consecutive weeks to break above its 50-day moving average. This technical paralysis is only the visible tip of the iceberg: the US labor market, a wave of protocol forks, and a string of security incidents are converging into an explosive setup. Here is the full anatomy of this compression, scale by scale.

The Sword of Damocles: the US NFP Report
This Friday, August 7, 2026, at 12:30 UTC, the Bureau of Labor Statistics releases the July Non-Farm Payrolls (NFP) report — the key gauge the Federal Reserve uses to calibrate rate policy. The nervousness is justified: June’s report delivered a shock with just 57,000 jobs added, far below the 110,000 consensus, alongside downward revisions of 74,000 jobs for April and May. Leading indicators (ADP at 44,000, ISM services contracting to 47.4) paint a picture of a possible hard landing.
For July, consensus expects 80,000 to 97,500 new jobs and unemployment holding at 4.2%. Two scenarios are in play:
- NFP below 70,000: bets on a September Fed rate cut (already priced at a 59% probability) would strengthen sharply, weakening the dollar and bond yields. A short squeeze could then shatter the $64,587 resistance.
- NFP above 120,000: labor market resilience would revive inflation fears and a prolonged restrictive policy, threatening to break the $63,898 support.
By comparison, Swiss non-farm employment rose 0.5% in Q1 2026 to reach 5.537 million jobs — a diametrically opposite trajectory that highlights the transatlantic macroeconomic divergence and, for some investors, reinforces the case for Bitcoin as a hedge against fiat currency debasement.
The August 2026 Protocol Fork Storm
The Bitcoin network has seen no consensus change since Taproot’s activation in November 2021. That calm is about to end, with two major events scheduled this month.
BIP-110: the most contested soft fork since the Blocksize Wars
Framed as a remedy for the “spam” of Ordinals inscriptions, BRC-20 tokens, and Runes, BIP-110 (also known as RDTS) imposes seven strict restrictions on transaction data usage, including a hard cap of 83 bytes on OP_RETURN outputs. The mandatory signaling window runs from August 7-9, 2026, with a potential activation in early September.
The 55% miner activation threshold, combined with a signaling rate struggling to exceed 1%, makes a chain split highly likely. Influential institutional voices, including Strategy’s Michael Saylor (holding more than 845,000 BTC), have come out strongly against the proposal, arguing it undermines the network’s neutrality. For custodians, the lack of replay protection represents a major operational risk.
The eCash hard fork and the covenants debate
Led by developer Paul Sztorc, the eCash hard fork is scheduled around August 21, 2026 (block 964,000) and introduces Drivechains (BIP 300/301) to enable decentralized sidechains, with a 1:1 airdrop for Bitcoin holders. Conceptually less contentious than BIP-110, it still raises accounting and tax questions for regulated institutions.
Looking further out, two structural debates loom: programmability via covenants (OP_CTV, OP_CAT), and the quantum computing threat — a March 2026 Google Quantum AI report revised down the resources needed to break Bitcoin’s ECDSA cryptography, accelerating the urgency of a post-quantum migration (BIP-360).
Regulatory Environment and Security: Trust Under Pressure
In the US, the Digital Asset Market Clarity Act faces pushback from states — New York’s Attorney General has opposed what she views as a federal overreach into local regulatory authority. In France, Bull Bitcoin has filed a legal challenge against the surveillance rules of the DAC8 directive.
On the security front, an exploit targeting the shared memory (mempool) of Coldcard hardware wallets siphoned roughly $120 million, triggering a wave of transfers from self-custody into spot Bitcoin ETFs — a stark reminder of self-custody risk, despite the manufacturer’s rapid firmware fix.
Multi-Timeframe Technical Analysis
Daily: the institutional wall at $64,587
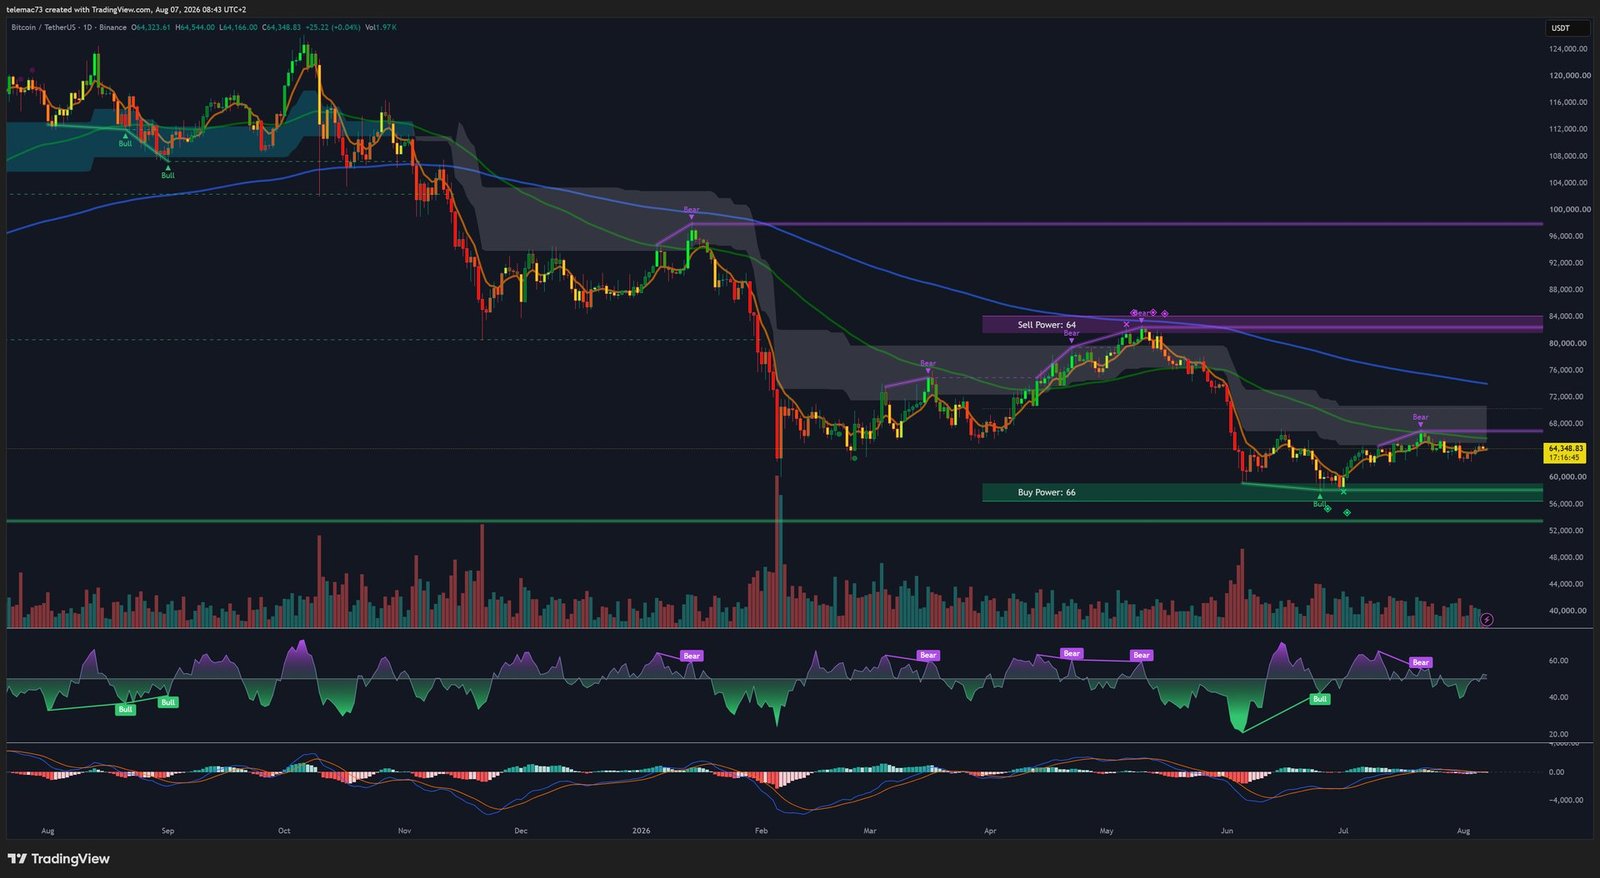
Price closed at $64,315 after touching $64,137 on August 5, with the moving-average order (price < SMA 50 < SMA 100 < SMA 200) confirming a medium-term downtrend, far from the October 2025 all-time high of $126,198. The RSI remains stuck below 40 and the MACD refuses any bullish crossover, denying the market the fuel needed to break through resistance.
4-hour: the compression triangle
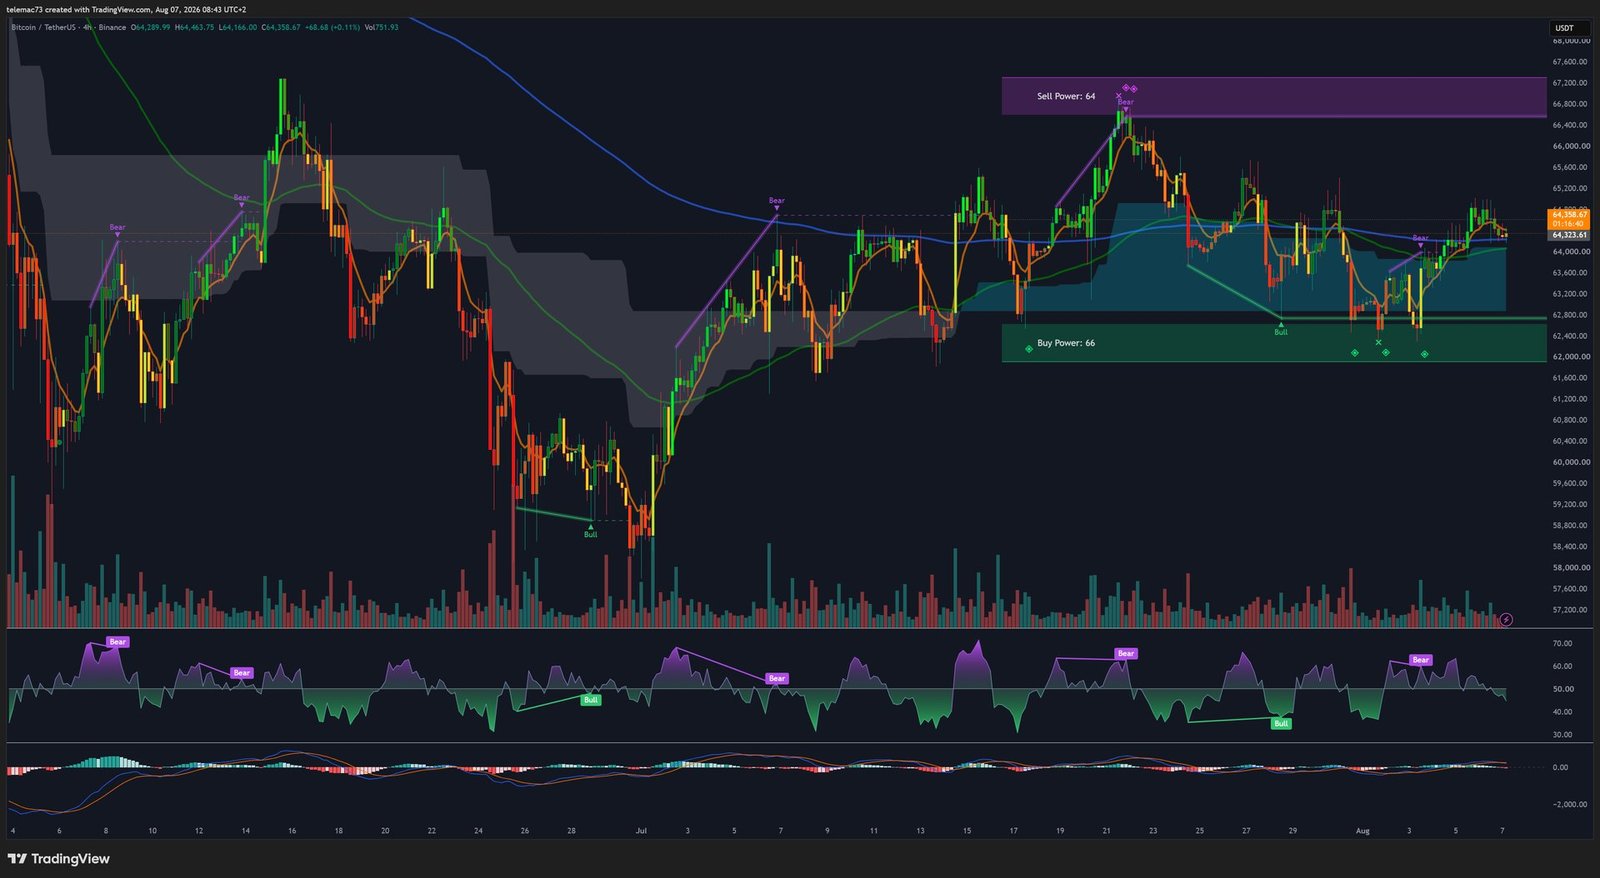
Between the dynamic support at $63,943 (20-period SMA on the 4H) and resistance at $64,587, a classic asymmetric compression triangle has formed — a textbook build-up of kinetic energy ahead of a volatility explosion. Bull-flag attempts keep failing on weak volume, while repeated whipsaws between the 50 EMA and 200 EMA trap trend-following strategies.
15-minute: mean reversion and stop-hunting
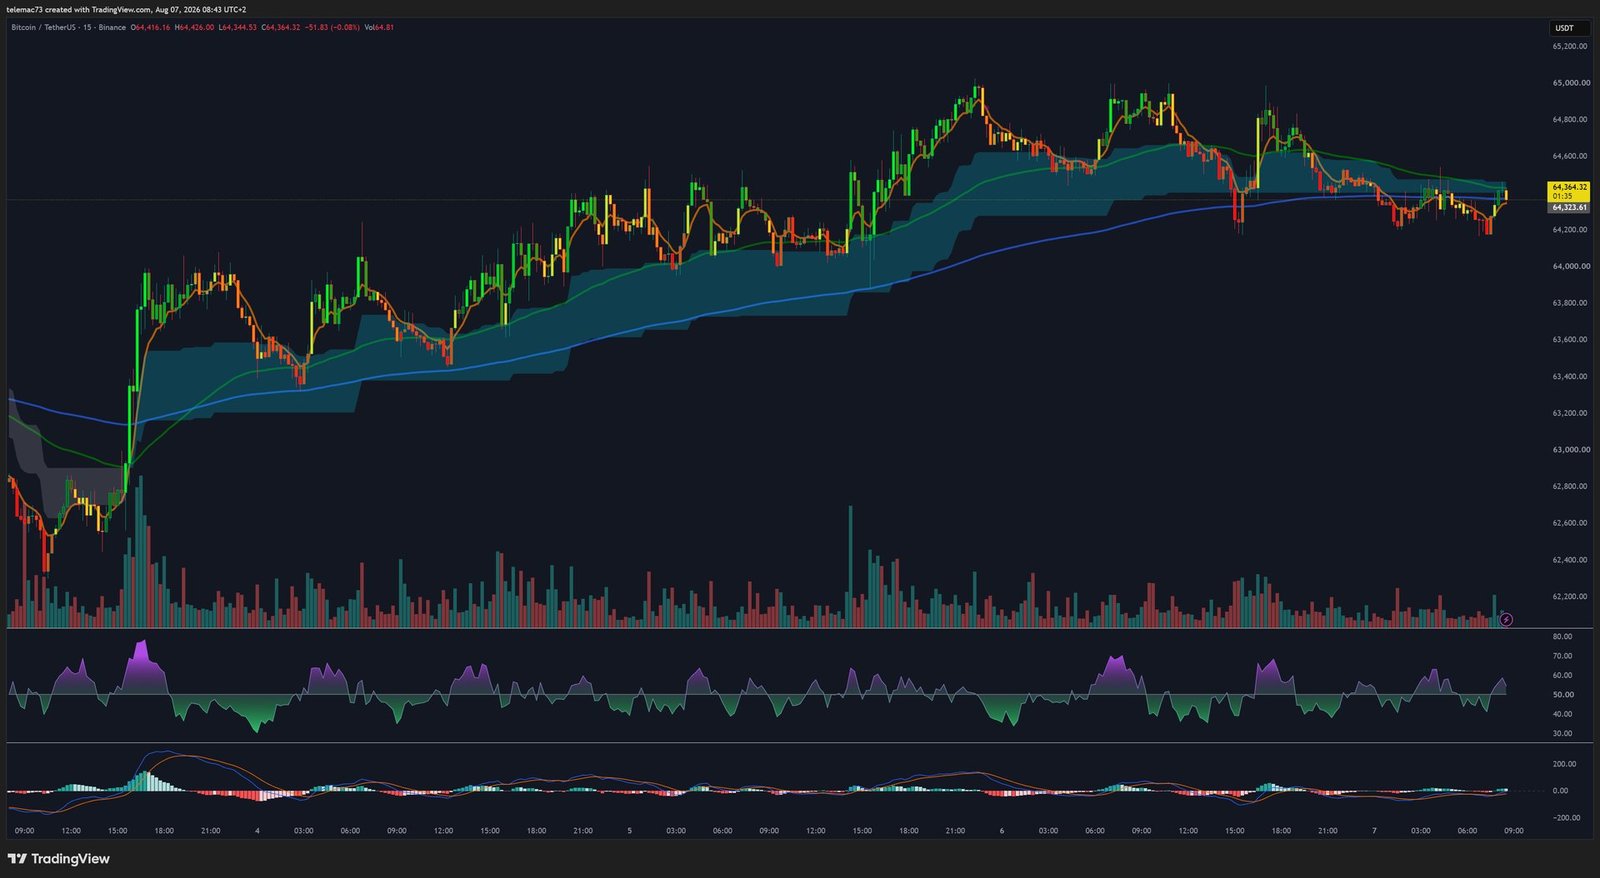
On this timeframe, the market follows a textbook mean-reversion pattern: liquidity sweeps below $64,000 trigger stop-losses right before an immediate reversal, with the RSI plunging below 20 in extreme oversold territory and above 75 in overbought near $64,500.
Order Book Heatmap: Where the Real Liquidity Hides
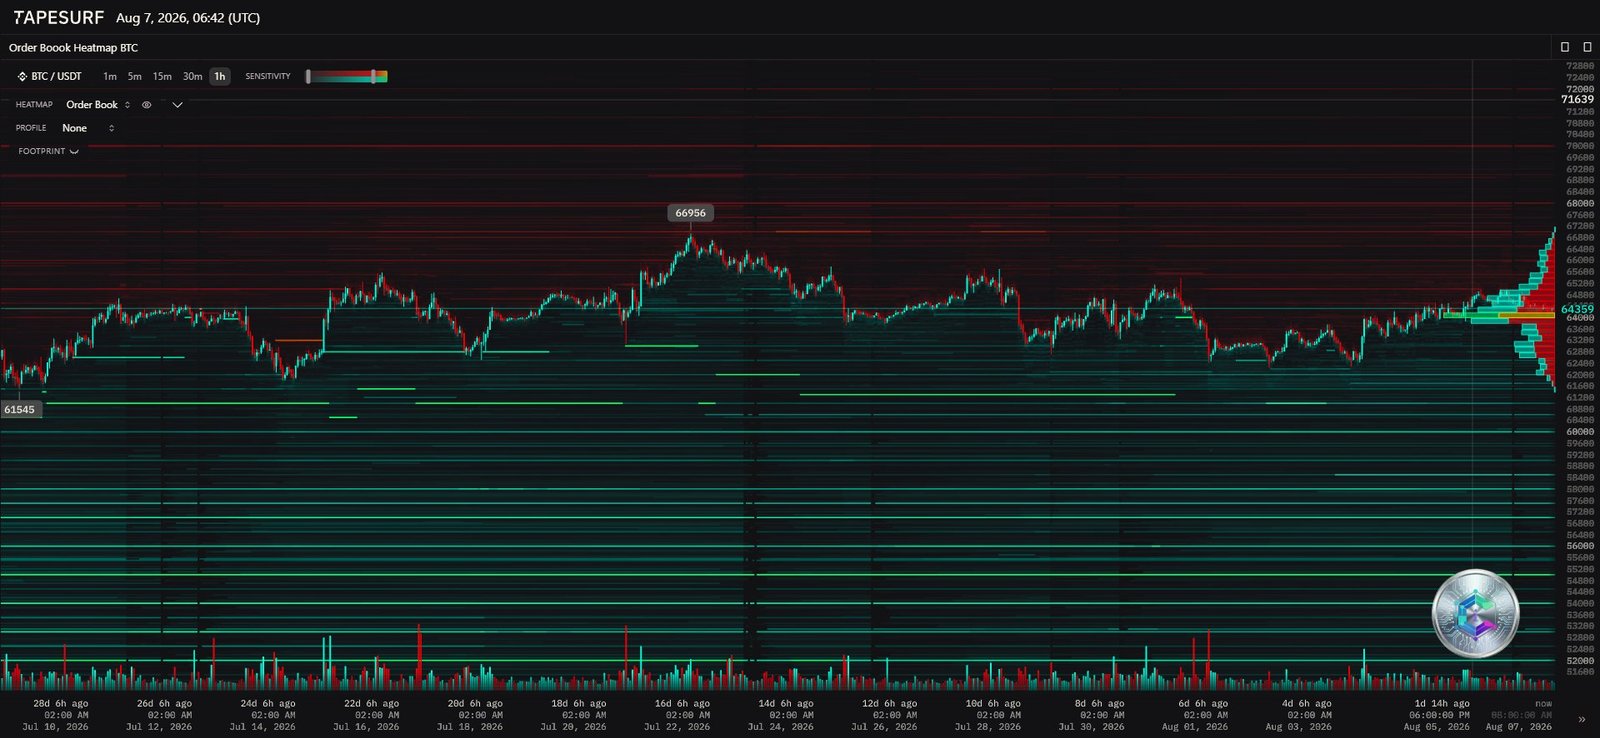
The BTC/USDT order book heatmap reveals a massive sell wall between $64,587 and $65,000, coinciding exactly with the 50-day SMA — a zone where institutions and miners have stacked thousands of bitcoins for sale. On the buy side, a first pocket of moderate liquidity sits near $63,898, while the true bastion of demand lies around $62,662. Spoofing activity around the $64,137 pivot also fuels the false signals seen on shorter timeframes.
Key Price Level Matrix
| Level | Price (USD) | Rationale |
|---|---|---|
| Macro resistance (R3) | $72,569 | 200-day SMA — secular bull market validation |
| Structural resistance (R2) | $67,025 | 100-day SMA |
| Critical resistance (R1) | $64,587 | 50-day SMA + sell wall on the heatmap |
| Central pivot (P) | $64,137 | Center of the compression triangle |
| Dynamic support (S1) | $63,943 | 20-period SMA on the 4H |
| Breakdown support (S2) | $63,898 | Lower bound of the current range |
| Accumulation zone (S3) | $62,662 | Buy-side liquidity cluster on the heatmap |
| Psychological abyss (S4) | Below $60,000 | Exposes the 2024 bottom in a capitulation scenario |
Conclusion: Two Catalysts, One Imminent Resolution
Bitcoin is caught in a vice between an undeniable technical resistance at $64,587 and a fragile support at $63,898. On a purely quantitative basis, the bearish moving-average alignment and the heatmap’s topography suggest the path of least resistance still points down. But the resolution of this Gordian knot will likely be dictated less by order-book math than by external shocks: a disappointing NFP could catalyze a push toward $66,000, while a resilient labor market would open the door to $62,662 or lower.
Over the medium term, the real risk sits at the heart of the protocol itself: a disorderly split around BIP-110 or eCash could introduce an unprecedented fundamental risk premium, well beyond typical market cycles.
Disclaimer: This article is provided for strictly educational and informational purposes. It does not constitute investment advice, a recommendation to buy or sell, or a solicitation of any kind. Cryptocurrency markets are highly volatile and carry significant risk of capital loss. Always do your own research and consult a qualified financial advisor before making any investment decision.

