


Bitcoin is going through a phase of structural mutation this August 2026. Trading in a tight range between $61,000 and $65,000, the asset reflects a definitive transition: from a market once dictated by retail speculation and halving cycles, to an arena now dominated by institutional flows, global macro liquidity, and complex derivative products. Quantitative analysts have dubbed this regime the “Lazy Bear”: a slow bleed, an exhausting sideways grind driven not by an ecosystem collapse, but by behavioral fatigue and restrictive liquidity conditions.
This analysis combines a multi-timeframe chart reading (15-minute, 4-hour, daily), an examination of the order book heatmap, and an integration of recent macroeconomic variables, aiming to go beyond a simple indicator reading to understand the underlying mechanics of capital flows.
Macro backdrop: the Fed at the center of the equation
As a high-beta asset, Bitcoin’s behavior remains tightly correlated with global liquidity conditions. Following its late-July meeting, the FOMC held its target rate range at 3.50%-3.75%. But persistently “sticky” underlying inflation has forced markets to price in a rising probability — estimated between 65% and 82% according to rate-derivative models — of a further hike as early as September.
This more restrictive tilt is being fueled by a simultaneous diesel price shock, with U.S. retail prices above $5.13 per gallon, and by massive AI-infrastructure capital expenditure that is artificially propping up aggregate demand. In this environment, liquidity is tightening, directly penalizing assets at the far end of the risk spectrum, such as Bitcoin.
The 10-year Treasury Inflation-Protected Securities (TIPS) real yield remains the ultimate gauge of capital’s opportunity cost. Historically, Bitcoin has delivered its strongest performances when real rates were negative. In early August 2026, this yield crossed into dangerous territory at 2.46%, threatening to settle durably above the critical 2.50% threshold — a level institutional quant models treat as the breaking point for constructive bullish outlooks.
Add to this a set of exogenous factors: persistent geopolitical tensions between the United States, Israel, and Iran, a joint Japan-U.S. intervention to support the yen, and a stalled CLARITY Act in the U.S. Senate, with prediction markets now pricing only a 27% chance of passage in 2026. This regulatory uncertainty is prolonging the wait-and-see stance of major institutional capital.
Market structure: the spot-derivatives fracture
The Bitcoin market is currently torn between hesitant institutional supply on the spot side and excess speculative leverage on derivatives. On July 31, 2026, U.S. spot ETFs recorded a combined net outflow of $265 million, with BlackRock’s IBIT leading redemptions at $123 million. This move is part of a 12-day consecutive redemption streak totaling more than $3.58 billion — the longest capital bleed since these products launched.
Paradoxically, despite this spot-side erosion, futures open interest has climbed back to nearly $22.25 billion, its highest level in two months. Funding rates remain positive, between 4.5% and 6.7% annualized, meaning leveraged buyers are continuously paying a premium to short sellers to hold their long positions. Historically, this combination of negative spot flows and positive directional leverage resolves through a cascade of liquidations.
On-chain analysis pits two structural levels against each other. The Short-Term Holder Realized Price (STH-RP) sits between $67,900 and $68,500 — a genuine Maginot line where recently onboarded holders, currently underwater, rush to sell as soon as price approaches. At the other end of the spectrum, the network’s Realized Price hovers around $53,200 to $54,000, acting as the ultimate structural floor where strategic institutional capital has historically executed its deepest reallocations.
The order book heatmap: two walls, one air pocket
Liquidity mapping reveals extremely asymmetric stratifications. On the upper side, a massive supply wall sits at $66,956 — a concentration of resting sell orders that aligns precisely with the on-chain STH-RP. This ceiling functions as a volatility-suppression mechanism, absorbing all retail buying pressure.
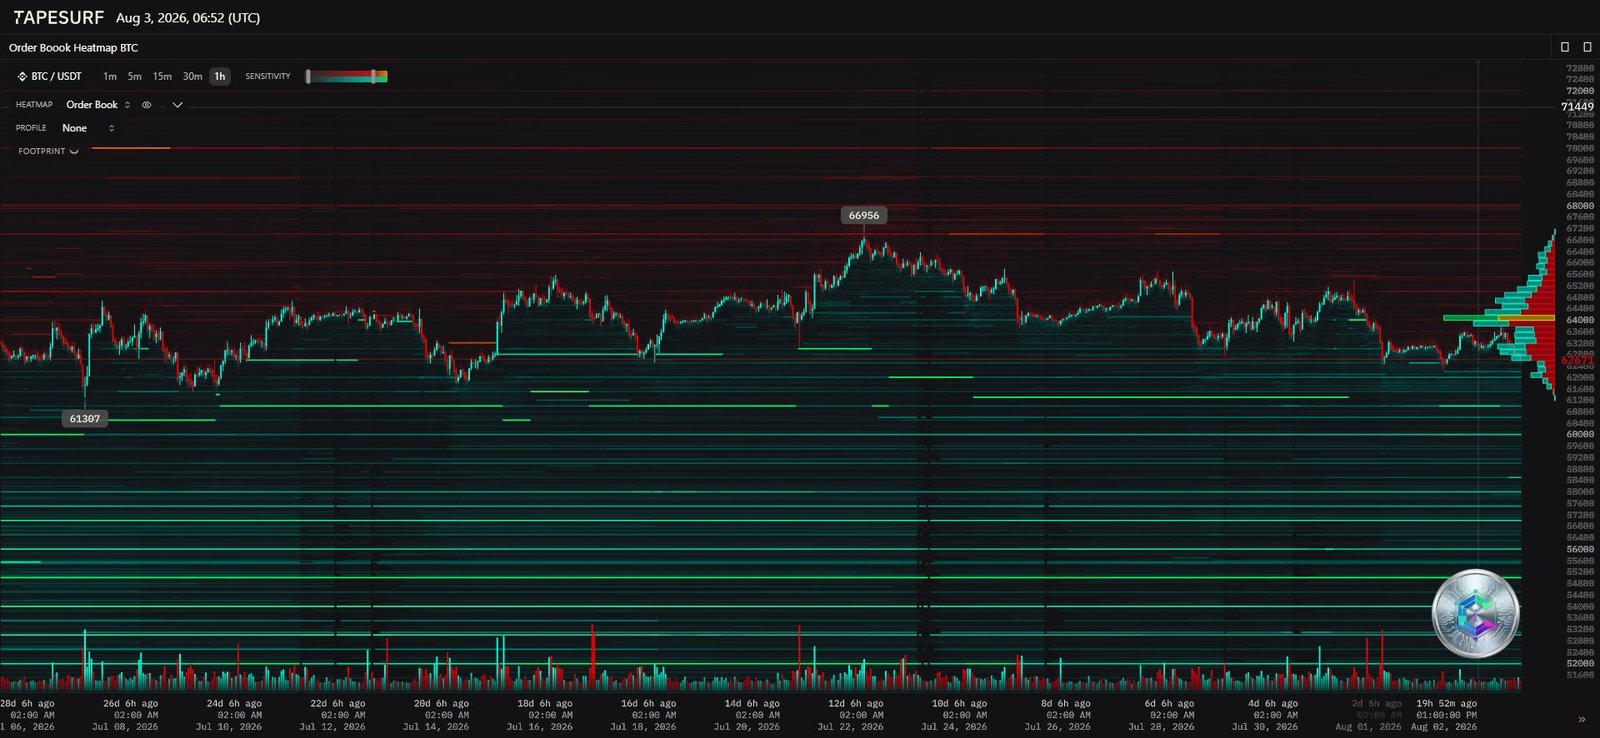
Below the current price, buy-side structure is more diffuse, signaling a lack of conviction among passive buyers. A clearly defined green line nonetheless stands out at $61,307, the last line of defense before a severe technical breakdown. Between this level and the current price lies a genuine “air pocket”: should this support give way, stop-loss orders from long traders clustered below $61,000 would trigger in a cascade. External liquidation maps confirm this reading, with a bearish liquidation cluster concentrated around $62,000 and a potential bullish cluster near $65,000-$66,000 in the event of a short squeeze.
Multi-timeframe technical reading
Daily chart: a reversal pattern under construction
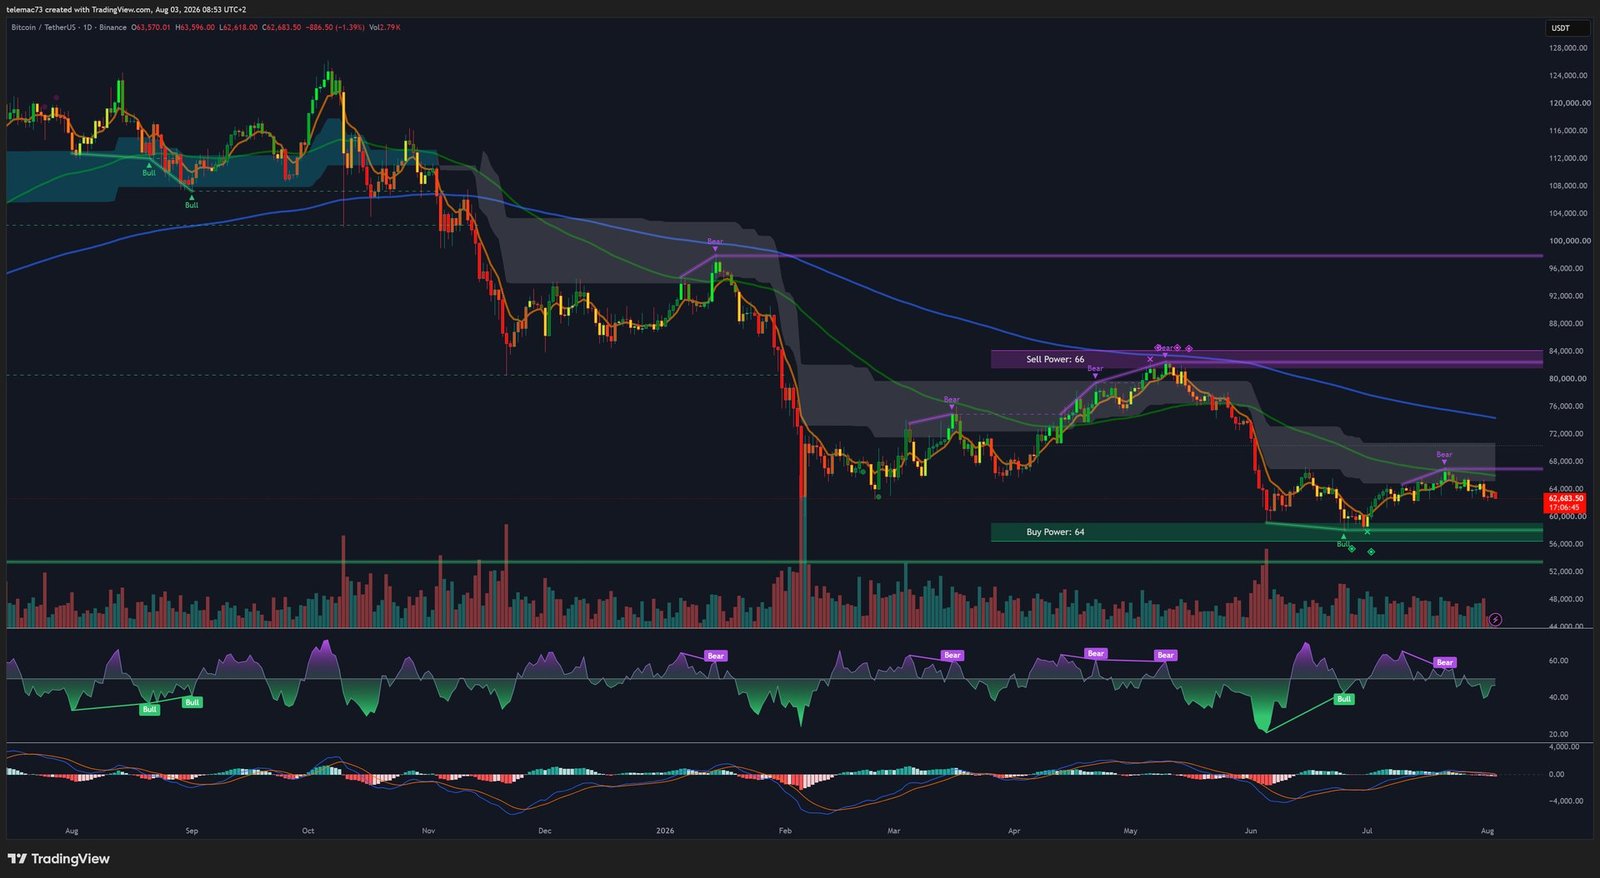
Since the October 2025 all-time high, price action has traced a sequence of lower highs and lower lows, sketching out a Head-and-Shoulders pattern whose neckline rests precariously on $61,000. A confirmed daily-close breakdown would project a technical target that strikingly aligns with the Realized Price zone near $54,000. Price trades below its fast and slow moving averages, both curving lower — a classic prelude to the feared Death Cross, closely watched by trend-following algorithms.
4-hour chart: compression and bear flags
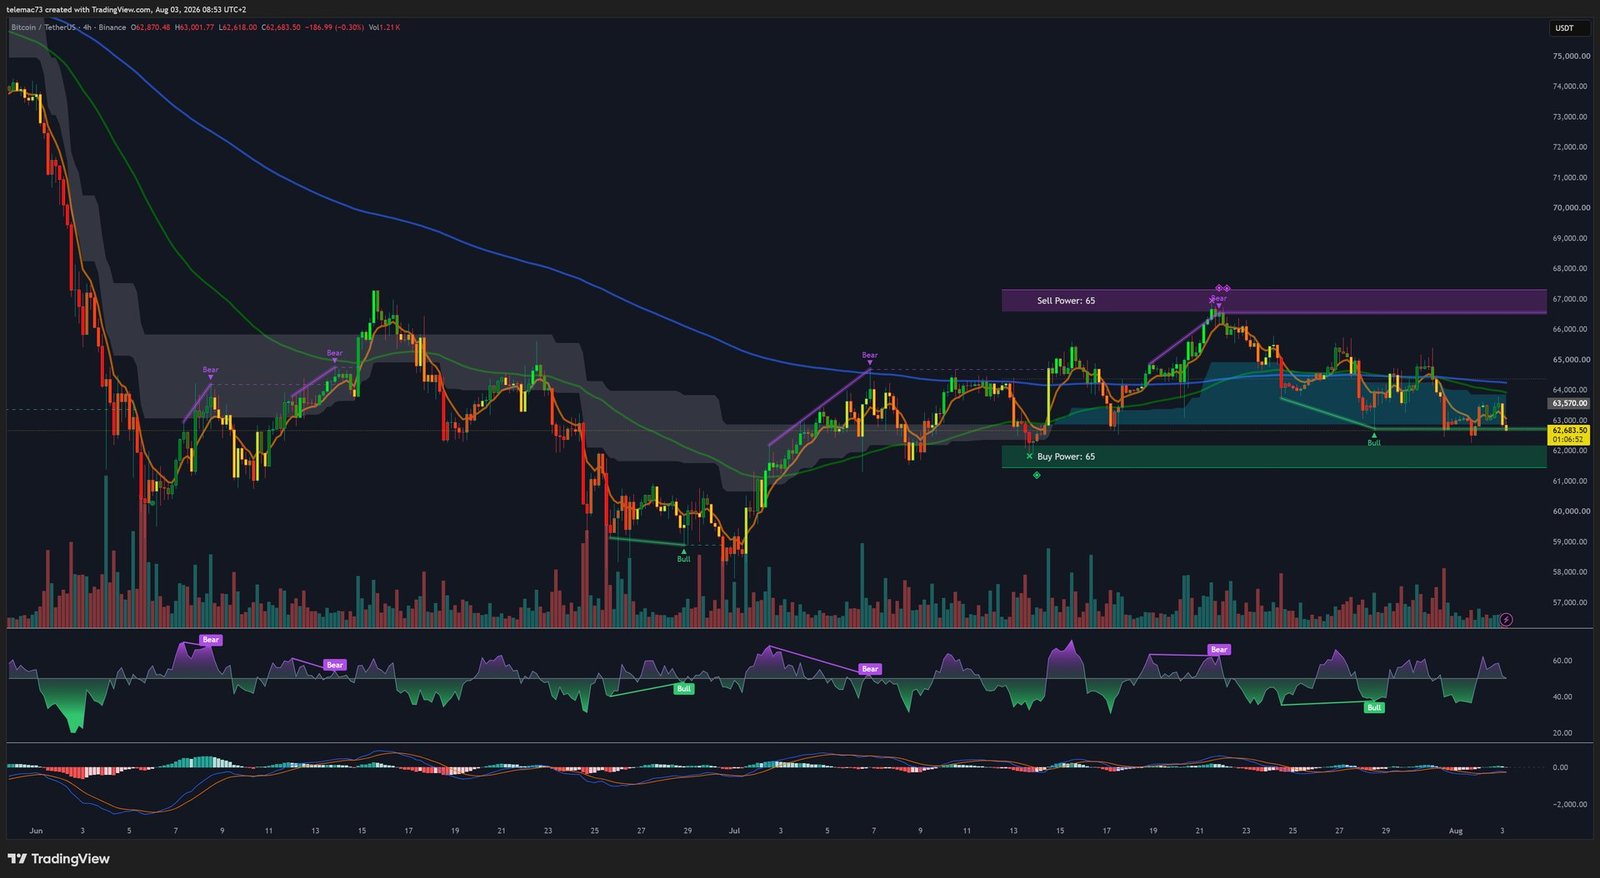
On the H4 timeframe, the market has strung together bear flags since rejecting the $67,000 ceiling, with steadily declining volume. The asset trades in the lower half of its dynamic bands, with the median pivot near $63,886 — until this level is firmly reclaimed, buyers remain on the defensive. The upper band ($65,284) marks short-term volatility resistance, while the lower band ($62,489) remains under constant pressure. The Chaikin Money Flow, deep in negative territory, confirms that capital keeps exiting the asset on every rebound attempt.
15-minute chart: stop-hunt territory
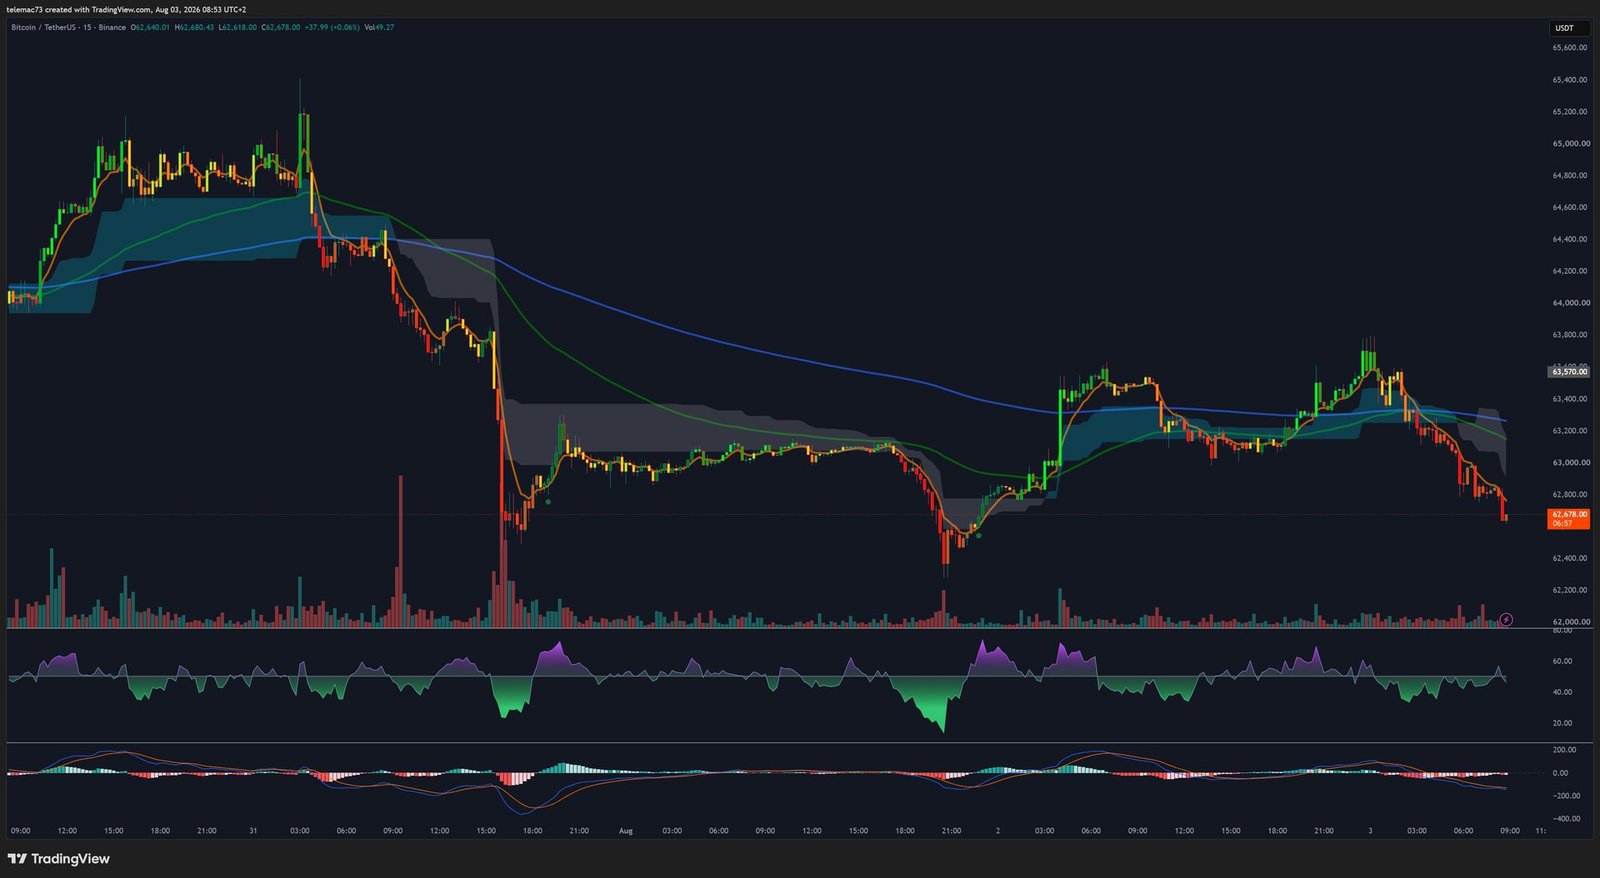
At this resolution, price action is choppy, with long wicks reflecting waves of liquidations. Historically thinner August summer volumes make it easier for large players to engineer fakeouts on the very short term. RSI regularly plunges into extreme oversold territory, generating corrective bounces that lack real follow-through and get sold into as soon as price approaches the smoothed moving average near $63,500. The M15 market remains under the near-total control of sellers.
Key level reference grid
| Level ($) | Nature | Significance |
|---|---|---|
| ~68,500 | Ultimate resistance | STH-RP — a breakout here would invalidate the bearish bias |
| 66,956 – 67,000 | Supply wall | Maximum resting sell cluster (heatmap) |
| 65,284 | Volatility resistance | Upper H4 Bollinger Band |
| 63,886 – 64,000 | Equilibrium pivot | H4 Bollinger midline |
| 62,489 | Compression support | Lower H4 Bollinger Band |
| 61,000 – 61,307 | Ultimate short-term demand | Daily H&S neckline / green heatmap cluster |
| 60,000 | Psychological rampart | Retail stop-loss concentration |
| 53,200 – 56,000 | Macro floor | Realized Price — capitulation zone |
Three probability-weighted scenarios
Main scenario — “Lazy Bear” consolidation (probability: 55%)
Opposing forces balance out into a prolonged stagnation. The restrictive macro backdrop caps any bullish impulse, while the liquidity cushion around $61,307 absorbs incremental selling pressure. Bitcoin settles into a constrained range between $61,000 and $65,000, slowly bleeding out excess open interest via funding fees rather than through explosive liquidations. This consolidation could last several weeks, pending a decisive catalyst such as mid-August CPI data or FOMC minutes.
Bearish scenario — Capitulation (probability: 30%)
A major macro shock — an unexpectedly strong jobs report or a major oil-related geopolitical shock — could trigger a global risk-off event. ETFs would suffer fresh massive redemptions, the $61,000 neckline would give way, triggering a stop hunt that would liquidate the accumulated open interest in a chain reaction. Price would then plunge through $60,000 in cascading fashion toward the historical capitulation zone between $53,200 and $56,000, where “value”-style institutional flows would historically step back in with force.
Bullish scenario — Unexpected liquidity shock (probability: 15%)
This minority scenario requires a catalyst large enough — a surprisingly weak macro print or a surprise legislative breakthrough — to force a massive short-covering event. Price would need to swallow, in one or two high-volume H4 candles, the $64,000 pivot and then the $65,284 resistance, fully absorb the $66,956 wall, and close a daily session above the $68,500 STH-RP. If this sequence materializes, the Head-and-Shoulders structure would be invalidated, opening a path toward $70,000 and beyond.
Conclusion
This three-dimensional study of Bitcoin in August 2026 — order book microstructure, multi-timeframe technical geometry, and monetary policy variables — paints the picture of a market in prolonged convalescence. The era when Bitcoin could insulate itself from traditional credit-tightening cycles appears to be over: its status as an institutionalized asset now ties it firmly to real bond yield fluctuations and the risk arbitrage decisions of global portfolio managers.
As long as this asymmetry persists — elevated derivatives leverage within a spot market experiencing capital outflows — Bitcoin’s resilience will keep being tested. The most rigorous approach is to favor defensive risk management over hope for an imminent bullish breakout, keeping both possible outcomes in mind: a purge toward fundamental levels below $56,000, or a clear bullish validation above $68,500.
Disclaimer: this article is published for educational and informational purposes only. It does not constitute financial advice, an investment recommendation, or a solicitation to buy or sell digital assets. Cryptocurrency markets are highly volatile and carry significant risk of capital loss. Always do your own research (DYOR) and consult a licensed financial advisor before making any investment decision.

