


In August 2026, Bitcoin is navigating a rare structural transition: a near-perfect technical compression overlaps with a deep split between short-term signals and long-term fundamentals. The asset is trading around a central pivot of $63,494, caught between accelerating institutionalization — driven by ETFs and pioneering Swiss regulation — and a clear cooling of immediate speculative demand.
This analysis cross-references multiple timeframes (15-minute, 4-hour, daily), order book liquidity via the heatmap, derivatives positioning, the macroeconomic backdrop, and on-chain fundamentals to map out the risks and opportunities currently shaping the Bitcoin market.
Multi-timeframe technical structure: compression before the break
Breaking down price action across multiple timeframes separates microstructural noise from the underlying trend. The combined daily, 4-hour, and 15-minute charts reveal a compression pattern within a market searching for its next directional catalyst.
Daily chart: a bearish-biased consolidation
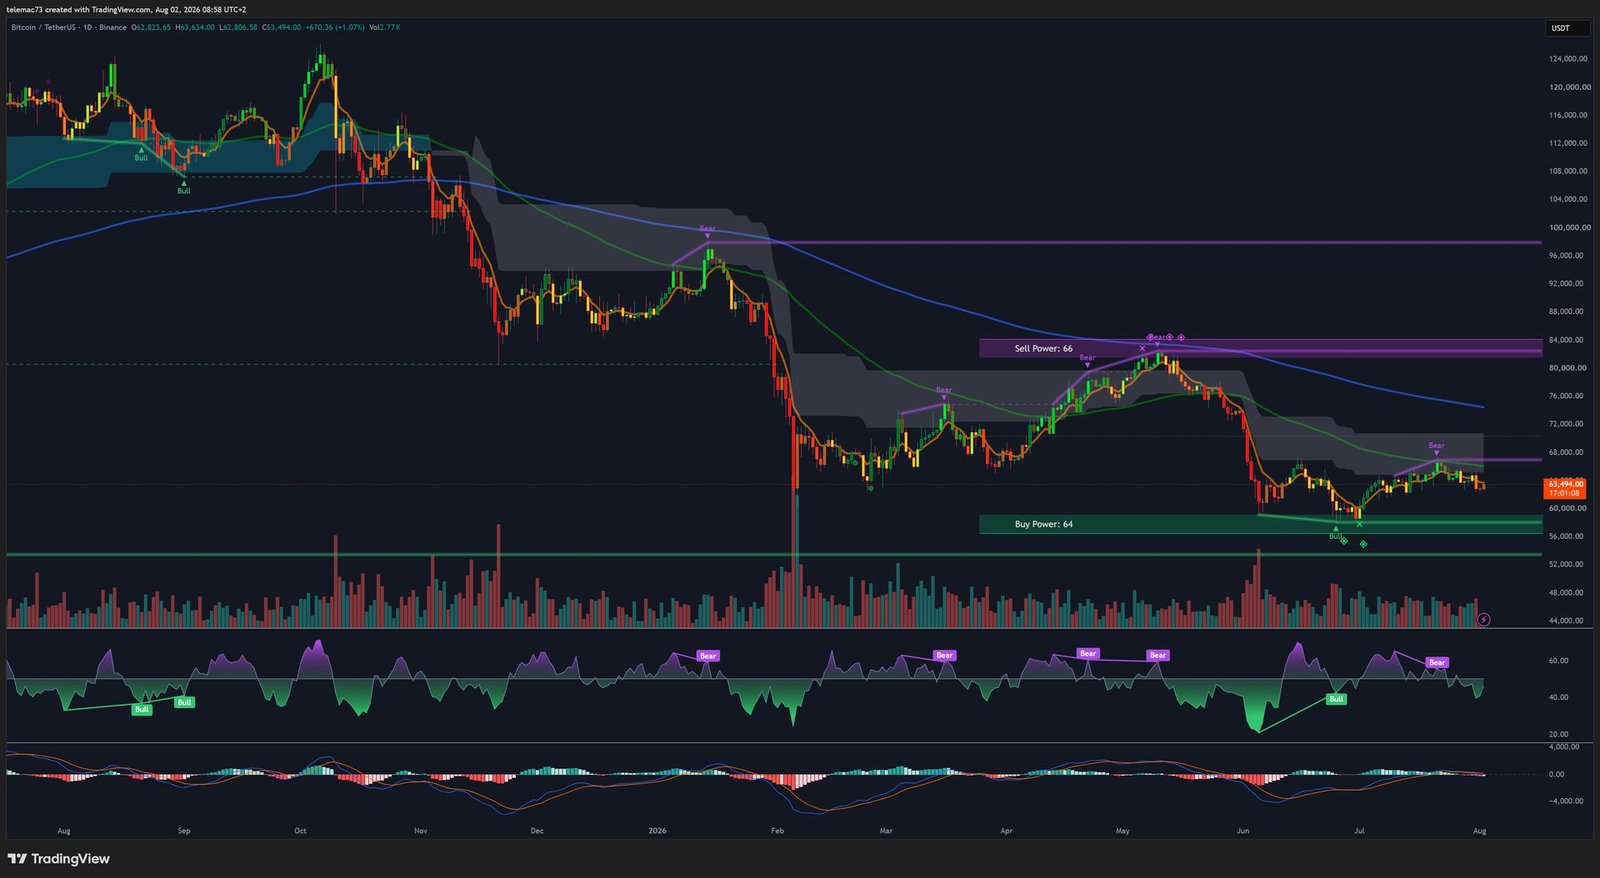
On the daily timeframe, Bitcoin remains locked in a bearish-biased sideways consolidation following its late-2025 all-time high. Price is capped beneath a ribbon of moving averages acting as dynamic resistance, led by the 50-day average, keeping the asset in a technically degraded environment.
The most closely watched setup remains a prolonged head-and-shoulders formation, with a neckline sitting around $53,000. A confirmed daily close below this level would open the door to a theoretical target near $41,266. For now, price is trading well above that danger zone, with intermediate support at $60,965 separating a normal range-bound phase from genuine technical distress. On the upside, structural resistance sits at $66,885; only a break followed by reclaiming $82,931 would formally invalidate the long-term bearish structure.
Momentum indicators confirm this apathy: the RSI hovers around the neutral 50 zone, showing neither oversold capitulation nor speculative overbought conditions, while the MACD flattens near its zero line. Persistently declining volume — especially on bounces toward the right shoulder of the pattern — is a classic sign of buyer exhaustion.
4-hour chart: compression ahead of a decision
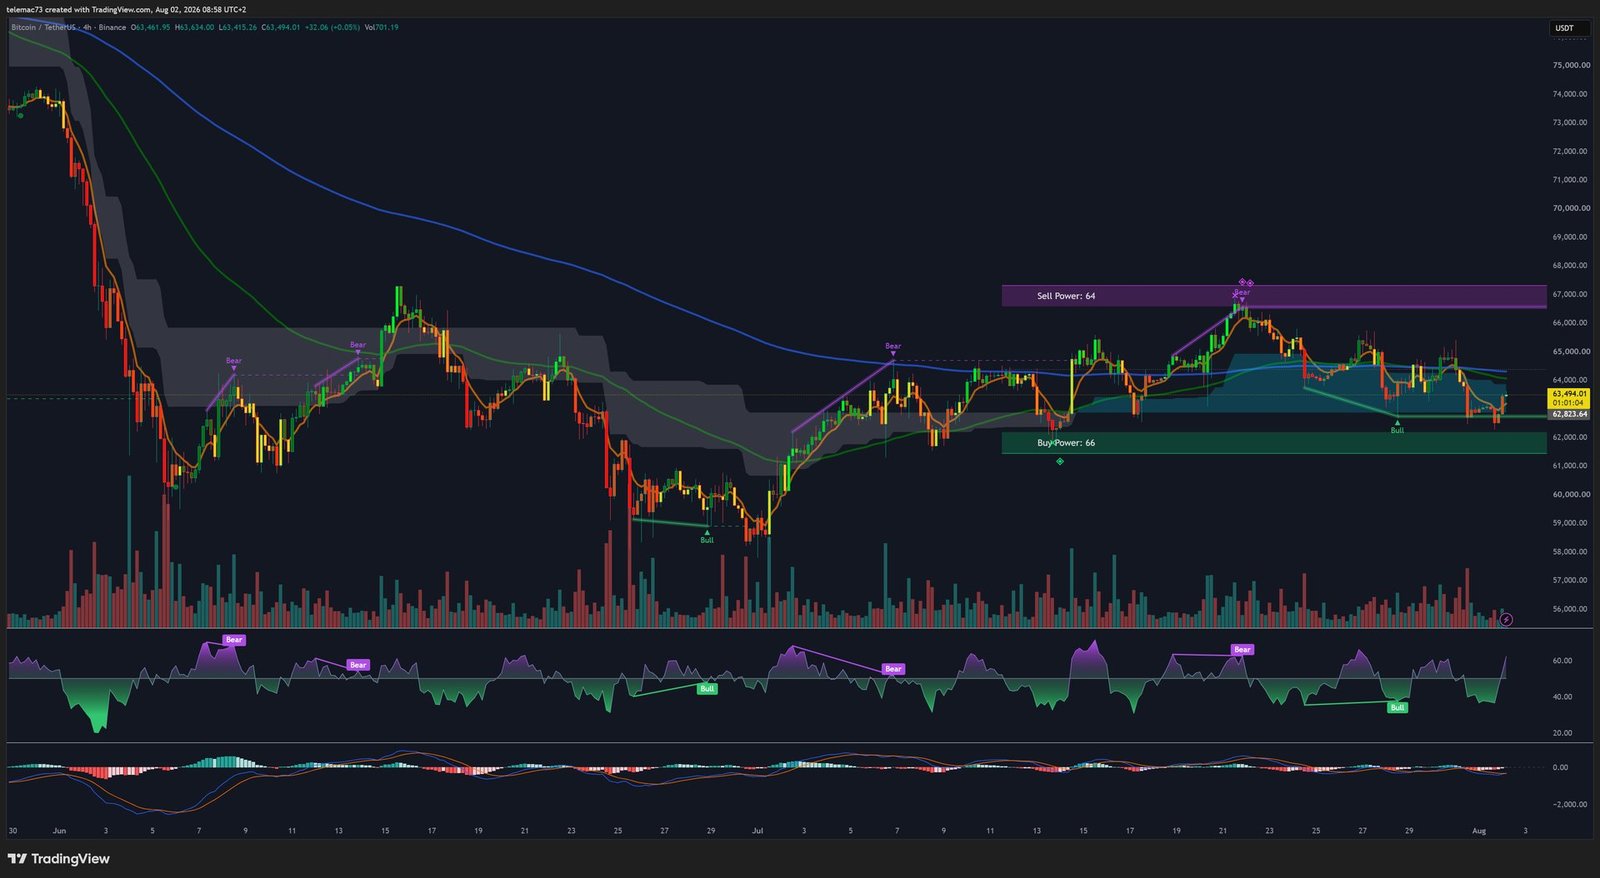
The 4-hour timeframe offers an ideal resolution for observing the current trading range, roughly bounded between $61,000 and $67,000. The upper resistance band, recently tested and rejected near $67,000, pushed price back toward the lower edge of the channel. A compression pattern is clearly forming: a bear pennant, or a small consolidation triangle, typically signaling a pause before a possible continuation of the short-term downtrend, with oscillations tightening around the $63,494 pivot.
On the indicator side, the picture remains precarious: the RSI dipped into oversold territory before attempting a modest technical bounce, while the MACD confirmed a bearish crossover (death cross), with the histogram slipping back into negative territory. Intermediate momentum therefore remains firmly in sellers’ hands, targeting the buy-liquidity zone near $61,300.
15-minute chart: the mechanics of microstructure
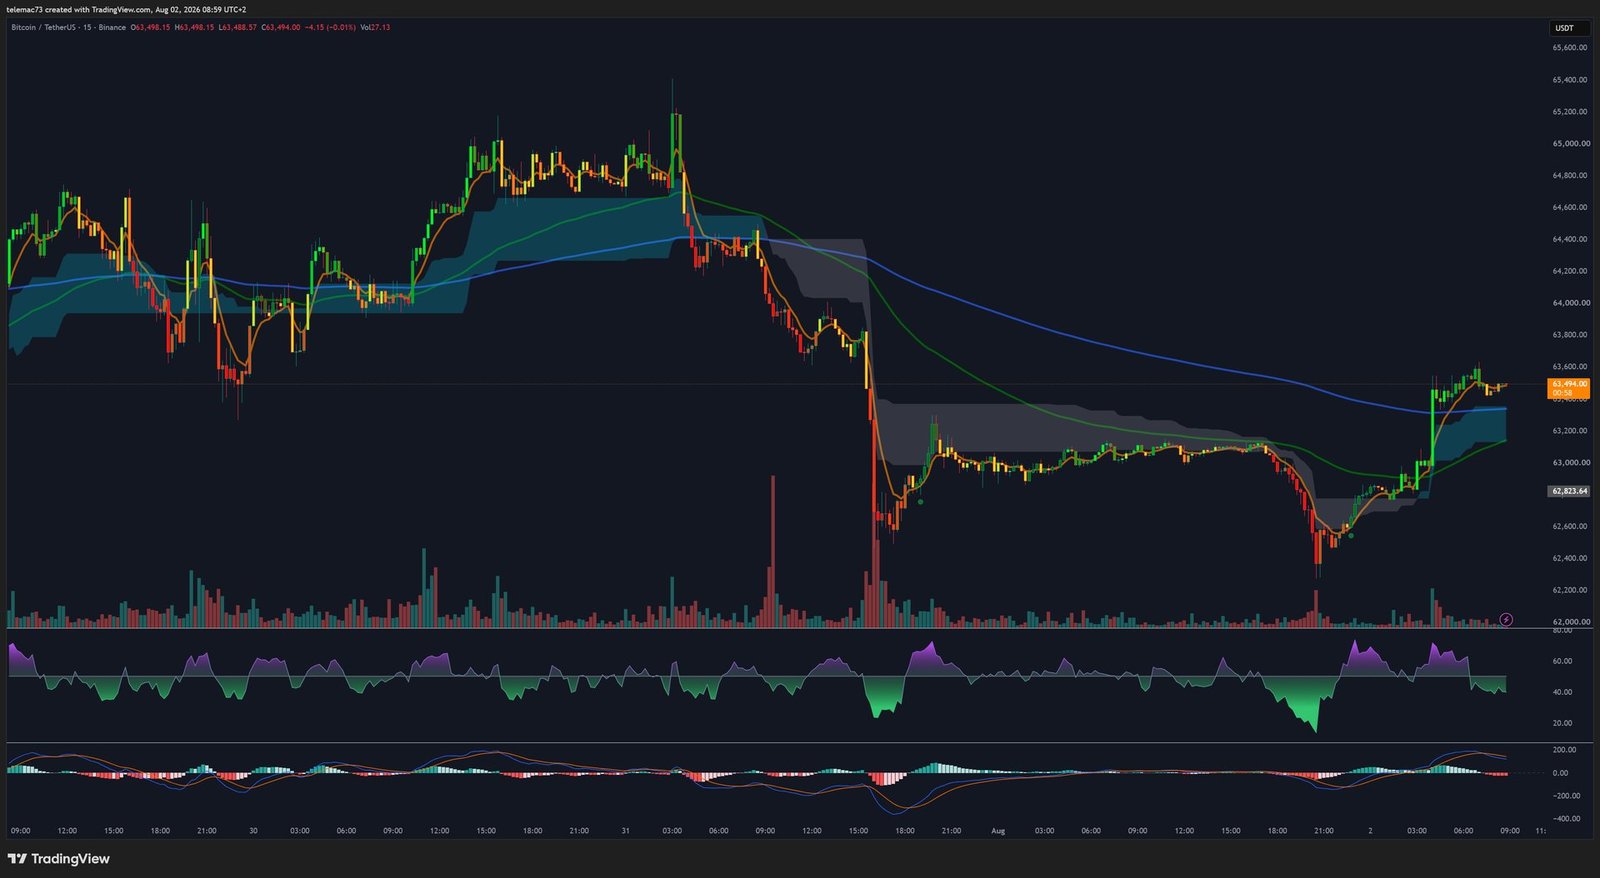
The 15-minute chart captures the sheer brutality of microstructure and the footprint of high-frequency algorithms. A recent flash drop sent price from $65,000 down to an intraday low of $62,823 — a textbook liquidity sweep targeting stop-loss orders positioned below $63,000.
Once that liquidity pocket was absorbed, a V-shaped reversal aggressively pulled price back to $63,494. During the drop, the RSI plunged into extreme oversold territory; on the second retest of the lows, it failed to print a new low, producing a classic bullish divergence. The MACD responded with a golden cross, the histogram turning positive — a sign of exhausted immediate selling pressure, with a short-term target near $64,200.
Order book: dangerously fragmented liquidity
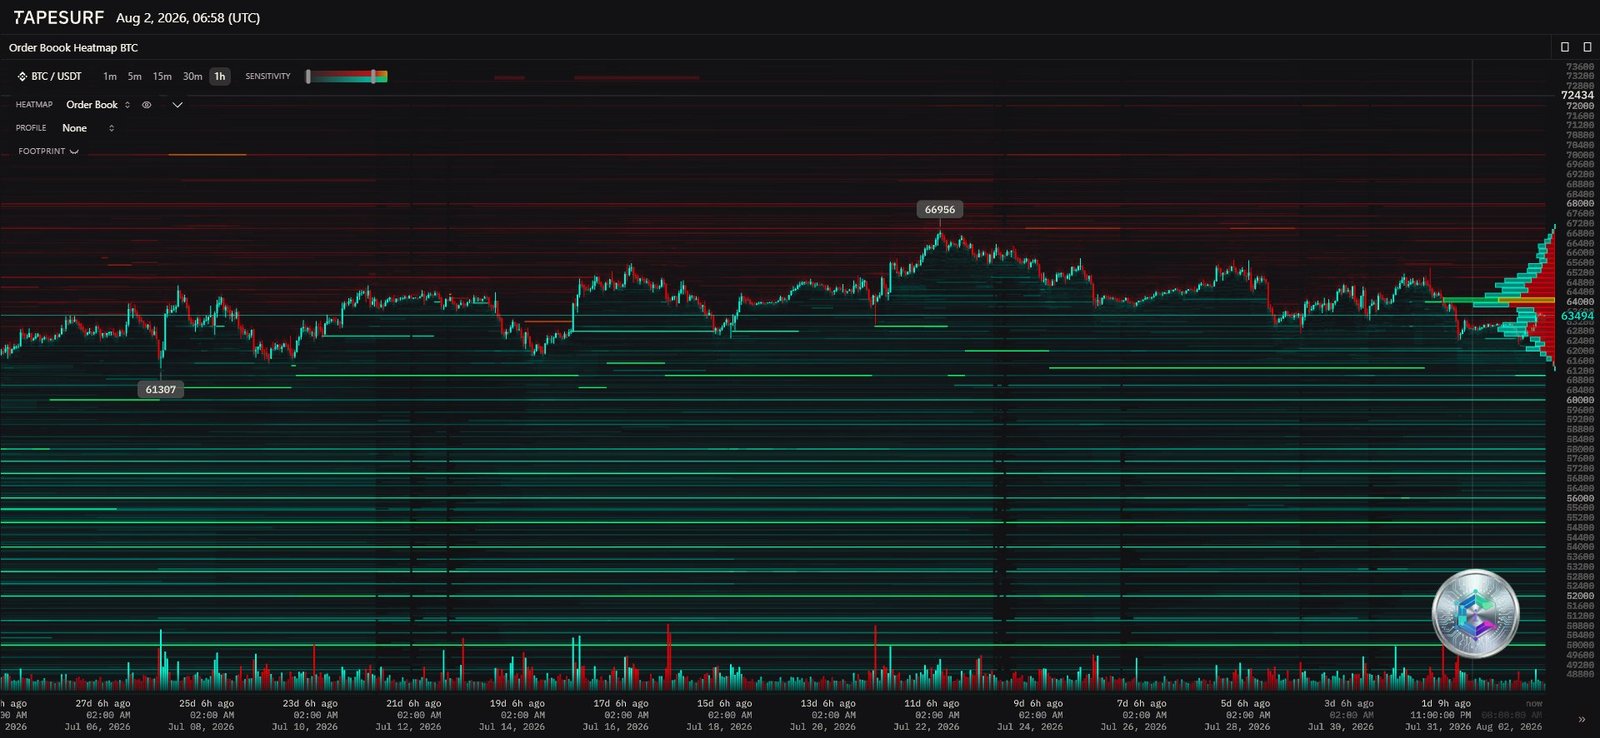
The order book heatmap reveals a deeply fragmented liquidity environment. Price is trading in a zone where the book is exceptionally thin, corroborated by spot volumes sitting at their lowest since 2019. This lack of dense liquidity leaves the asset highly sensitive to execution shocks, amplifying the price impact of market orders and fueling spikes of artificial volatility.
| Strategic zone | Level (USD) | Interpretation |
|---|---|---|
| Major resistance (sell wall) | $66,885 | Ceiling of the 4H range, heavy density, violent rejections |
| Intraday pivot | ~$63,494 | High-friction zone, erratic volatility |
| Minor support | $62,823 | Liquidity sweep zone, base of the M15 RSI divergence |
| Major support (buy wall) | $60,965 | Whale defensive floor; a break would open a void toward $54,000 |
The liquidity void beneath $60,965 represents a short-term systemic risk: order books are largely devoid of massive passive buy orders until price approaches $54,000. Institutional players are clearly waiting for discounted prices before committing significant capital.
Derivatives markets: a markedly defensive stance
August 2026 is defined by heightened caution across derivatives. Average Max Pain sits around $64,000, while some major expiries project a considerably higher Max Pain near $74,000, suggesting market makers could let price drift toward those levels if initial downside pressure fades.
| Metric | Observed value | Implication |
|---|---|---|
| Volatility skew (put vs call) | +6.9 to +11.4 points | Massive premium paid for crash protection |
| 1-month implied volatility | ~37% (calls) / 44% (puts) | Multi-year lows, immediate speculative disinterest |
| Funding rates | Negative to slightly positive | Lack of directional conviction, perpetuals deleveraging |
| Open interest (OI) | ~$20.8B | Down more than 50% from the October 2025 peak |
This pronounced preference for put options has translated into a sharply negative 25-delta risk reversal, revealing institutional willingness to pay steep premiums against sudden downside risk. Combined with neutral funding rates, this setup signals a market purged of bullish speculative leverage, dominated by hedging rather than directional speculation.
Macro backdrop: an asymmetric desynchronization
The Fed is holding rates in a strict 3.50%–3.75% range amid persistent inflation and heightened geopolitical tension. US Treasury yields now exceed the crypto carry trade, pushing institutions toward cash rather than a stagnant Bitcoin, drying up marginal demand.
Historically positively correlated with the S&P 500 and Nasdaq, Bitcoin is undergoing a striking desynchronization in 2026: the 20-day rolling correlation to the upside is near zero. The asset is largely ignoring fresh Wall Street highs. Yet this decoupling is asymmetric: the link reactivates violently on the downside, with Bitcoin absorbing risk-off shocks almost instantly. Meanwhile, odds of the CLARITY Act passing — initially priced above 80% — have collapsed below 30% on prediction markets, cooling US institutional allocation.
Spot ETF flows: a summer hemorrhage
US spot Bitcoin ETFs recorded a historic streak of 13 consecutive days of net outflows, draining $4.4 billion — equivalent to roughly 59,000 BTC in forced selling — the primary catalyst behind the drop toward $61,000. July attempted a recovery, but weekly inflows shrank from $197.4 million to just $33.8 million, an over 80% collapse in momentum.
IBIT and FBTC, historically the main engines of inflows, suffered heavy redemptions during the June and July purges, while GBTC continues to bleed chronically due to its high fees. Until these major vehicles see sustained inflows return, absorbing sell-side liquidity will remain an uphill battle.
Switzerland’s regulatory vanguard
While the US remains stalled on the CLARITY Act, Switzerland has rolled out a strikingly clear framework. In January 2026, FINMA published its Circular 01/2026 on the custody of crypto-based assets, granting full insolvency protection for custodied assets and a capital requirement exemption for successfully segregated holdings — a major step toward institutional banking adoption.
According to Sygnum Bank’s 2026 report, more than half of major global banks are expected to invest heavily in secure custody infrastructure by year-end, and at least three G20 economies could publicly add Bitcoin to their sovereign balance sheets. This underlying trend stands in stark contrast to the short-term pessimism visible in the order book.
On-chain fundamentals and the mining industry
The MVRV Z-Score, recalibrated to account for Bitcoin’s growing financialization, is fluctuating modestly between 0.37 and 2.5: the asset sits in a median valuation zone, far from both euphoria and extreme undervaluation. The median realized price, around $64,100, forms the market’s fundamental floor, while the short-term holder cost basis at $69,000 acts as an overhead supply wall capping any sustained rebound. Conversely, whales (entities holding over 1,000 BTC) have resumed accumulating, in notable divergence from retail capitulation.
On the mining side, global hashrate has crossed the one-zettahash-per-second threshold, pushing difficulty above 136 trillion and securing the network against any 51% attack. Margin pressure is driving a marked pivot among publicly listed miners (Core Scientific, TeraWulf, Cipher) toward AI and high-performance computing — a strategic shift that doesn’t compromise long-term network security thanks to next-generation, ultra-efficient hardware. Meanwhile, the Lightning Network continues to mature with BOLT12 Offers, splicing, and Taproot asset integration, paving the way for ultra-low-cost stablecoin transfers.
Summary and outlook
The diagnosis for this summer of 2026 is twofold: Bitcoin appears structurally undervalued and institutionally secured for the long run, yet remains extremely fragile and prone to manipulation in the short term.
- Short-term risk: the convergence of unfavorable August seasonality, drying ETF flows, and a heavily defensive volatility skew weighs on the structure. A break of the $60,965 support would open the path toward the head-and-shoulders neckline at $54,000.
- Long-term maturation: the FINMA directive, whale accumulation, record network security, and the operational rollout of the Lightning Network cement the protocol’s fundamental value.
To technically invalidate short-term fears, Bitcoin will need to absorb the substantial overhead supply from short-term holders positioned at $69,000. Absent that breakout, the market should keep grinding through a wearing consolidation — a necessary accumulation phase before a broader deployment of global banking infrastructure toward the end of 2026.
Disclaimer: this article is provided for educational and informational purposes only. It does not constitute investment, financial, or trading advice of any kind. Cryptocurrency markets are highly volatile and carry significant risk of capital loss. Always do your own research (DYOR) and consult a qualified financial advisor before making any investment decision.

