


As July 2026 draws to a close, Bitcoin (BTC) is trading in a tight corridor between $64,000 and $66,000, caught at the intersection of two opposing forces. On one side, systemic institutional adoption through U.S. spot ETFs is acting as a buyer of last resort. On the other, an increasingly restrictive macroeconomic backdrop — sticky inflation, elevated rates, and geopolitical tension — is weighing on risk appetite. The result is a historic compression in implied volatility and a market microstructure under mounting pressure, on the verge of a potentially explosive resolution.
The macro tug-of-war: the Fed, AI, and energy shocks
A divided Federal Reserve
The Fed heads into its July 28-29, 2026 meeting under a cloud of uncertainty. The federal funds rate has been held between 3.50% and 3.75% since the start of the year, defying earlier expectations of an easing cycle. June’s meeting minutes revealed sharp internal disagreement: some committee members are pushing for further hikes given “sticky” inflation, while others favor holding steady. Chair Kevin Warsh has scaled back forward guidance to a minimum, imposing strict data-dependence while reaffirming the 2% inflation target.
| Indicator | Current value (July 2026) | Context |
|---|---|---|
| Federal funds rate | 3.50% – 3.75% | Held constant since the start of 2026 |
| Probability of a hold (CME FedWatch) | ~64% | Majority of the market expects a pause |
| Probability of a hike (CME FedWatch) | ~36% | Sharply up from ~12% the prior week |
| Annual CPI | +3.5% | Still above the 2% target |
| Monthly CPI (June) | -0.4% | Slight cooling, a point in favor of the dovish camp |
This rising probability of a “higher for longer” policy stance strengthens the dollar and raises the opportunity cost of holding digital assets that generate no intrinsic yield.
AI: the new liquidity magnet
Massive AI infrastructure buildout is pulling unprecedented amounts of capital into hard assets — data centers, power infrastructure, advanced semiconductors. This rotation absorbs a disproportionate share of available liquidity while keeping bond yields elevated. Analyst Arthur Hayes argues that Bitcoin’s next major bull run hinges on the moment capital begins rotating out of the (arguably overheated) “AI trade” and back into digital assets.
Geopolitical tension and sanctions
Escalating conflict involving Iran has pushed Brent crude above $100 a barrel, reviving fears of imported inflation. Should tensions persist through Labor Day, the Fed may be forced into a September hike. Meanwhile, the European Union has adopted its 21st sanctions package, including provisions to fully ban third-country crypto service providers suspected of helping Russia evade sanctions. Paradoxically, this growing politicization of global finance reinforces Bitcoin’s core value proposition as a neutral, censorship-resistant monetary network.
Fundamentals hold firm: ETF flows and on-chain data
Despite the hostile macro backdrop, flows into U.S. spot Bitcoin ETFs have acted as a genuine systemic shock absorber, stringing together seven consecutive sessions of net inflows.
| Period | Flows ($M) | Impact |
|---|---|---|
| Jul 14 – 22 (7 sessions) | +$999.3M | Full absorption of selling pressure |
| Jul 13 (single session) | -$424.7M | Tactical outflows, quickly offset |
| Recent session (Tuesday) | +$203M | Inelastic demand despite a flat price |
On-chain, accumulation is asymmetrically concentrated among wallets holding between 1,000 and 10,000 BTC — typically wealth managers, family offices, and ETF custodians — while retail participation stays subdued. This transfer from “weak hands” to “strong hands” mechanically reduces liquid supply on exchanges, a setup that has historically preceded robust bull markets.
Derivatives and prediction markets: a lit fuse
The options market shows a notable structural anomaly: one-year realized volatility sits around 42%, while implied volatility has dropped to near 37 — among its lowest levels in years. This decoupling signals a “tightly coiled” market where hedging costs become abnormally cheap right before a mature consolidation phase — a setup that typically precedes a volatility shock.
Traders have built up roughly $2.5 billion in open interest on call options at the $72,000 strike for late-July expiries. Should price approach that level, market makers who sold those calls could be forced to aggressively buy spot BTC to hedge their exposure — a “gamma squeeze” that could push price well beyond near-term fundamentals.
| Platform | Expiry | Target | Probability / Interest |
|---|---|---|---|
| Polymarket | July 2026 | $67,500 | ~78.5% (cautious optimism) |
| Options (Deribit/CME) | Late July 2026 | $72,000 | $2.5B open interest |
Multi-timeframe technical reading
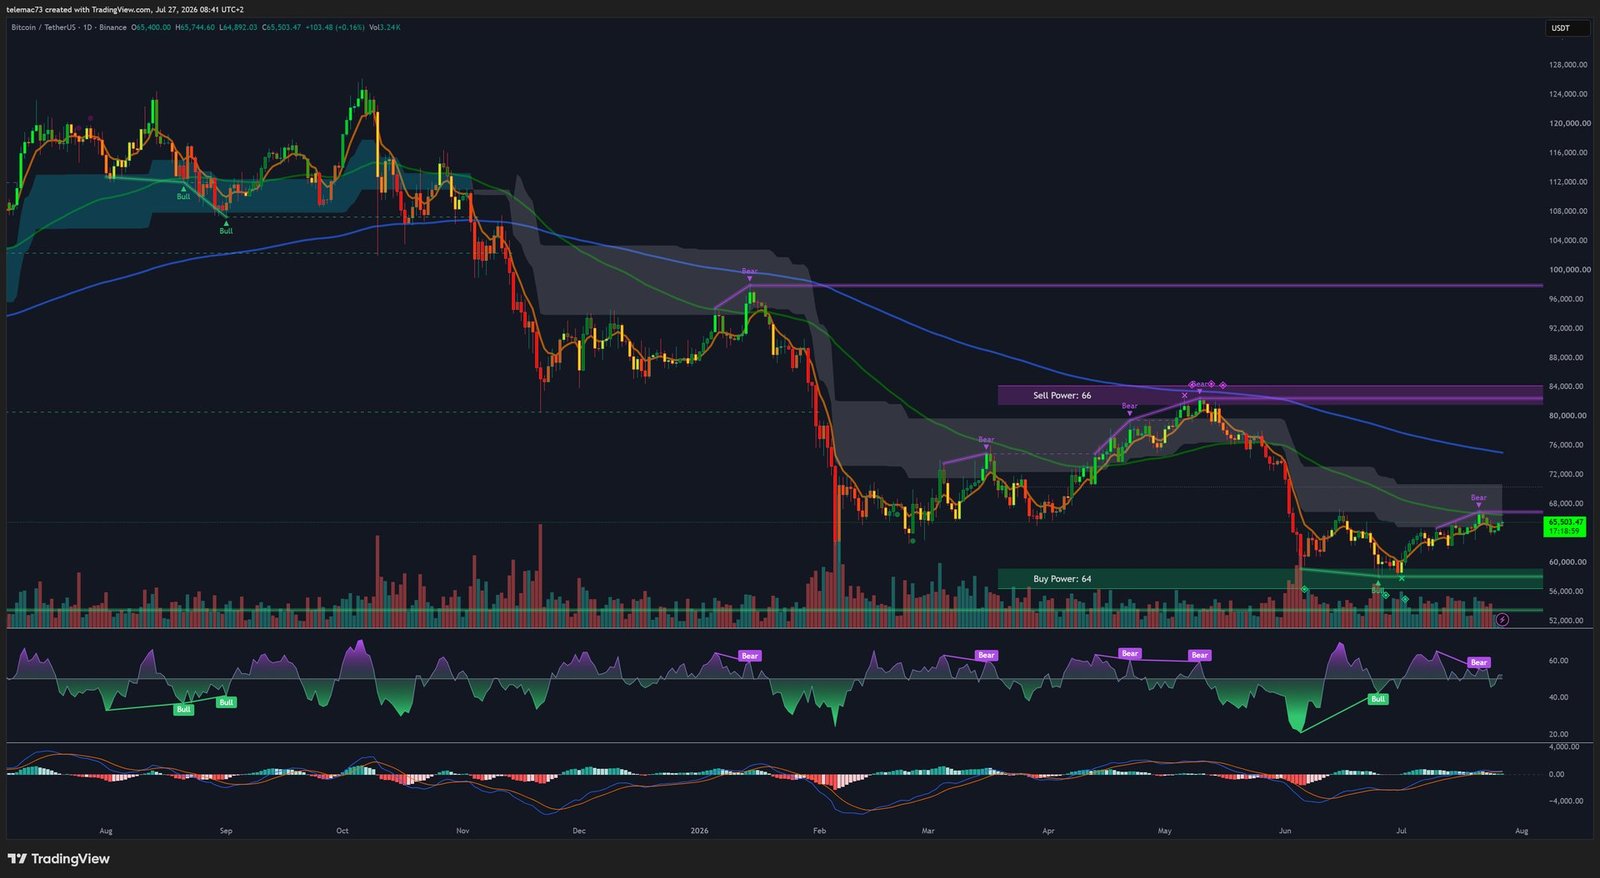
Daily chart: symmetrical compression triangle
On the daily timeframe, Bitcoin is tracing a symmetrical compression triangle: progressively lower highs and higher lows, boxed between $64,000 support and $68,000 resistance. The 21-day moving average, currently around $64,000, acts as the floating baseline for this structure. The daily RSI is trading nearly flat around 50, signaling a near-perfect balance between buyers and sellers — and considerable room to run should a positive catalyst emerge. The MACD, similarly compressed near the zero line, shows no major bearish crossover on the longer moving averages, preserving the underlying bullish bias.
H4 chart: bull flag and tactical pivots
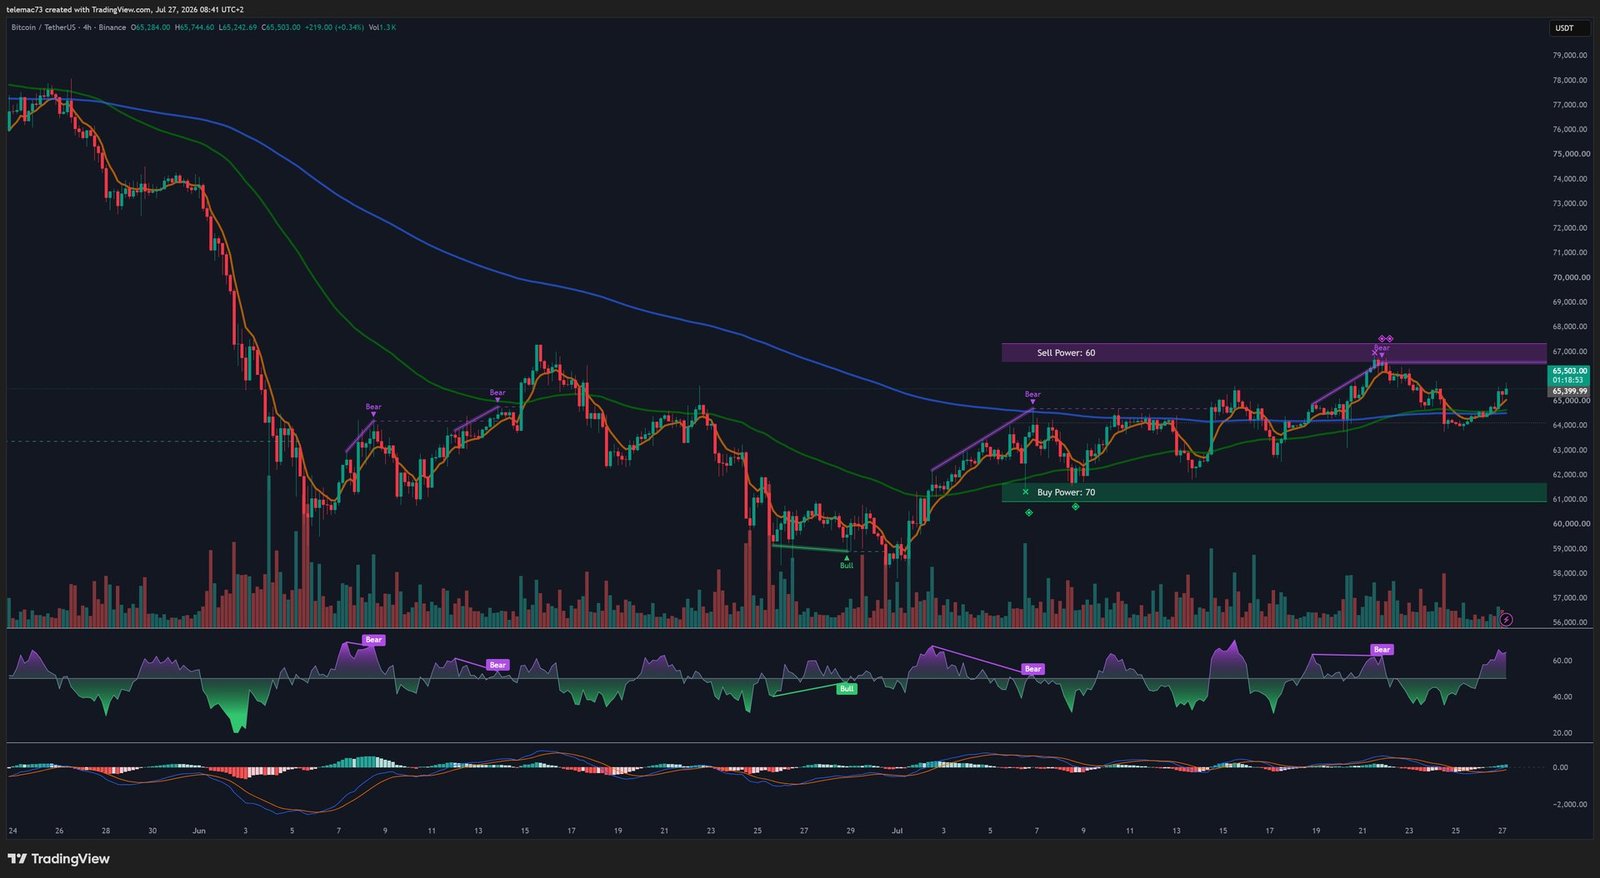
On the 4-hour timeframe, the structure stays bullish as long as price holds above the critical $64,150–$64,950 zone. The recent pullback from attempts to break $66,500 is shaping up as a bull flag, with institutional buyers stepping in systematically at the lower channel boundary. The H4 RSI dipped into oversold territory (30-35) on pullbacks toward $64,150 before rebounding, confirming that zone as a “value” entry point for algorithms. The H4 MACD saw a short-term bearish crossover, but the histogram is fading and could flip bullish if the $66,000 resistance is cleared. Conversely, a break below $64,150 would invalidate the bull flag and expose the market to a drop toward $62,500–$63,000.
15-minute chart: algorithmic noise and scalping
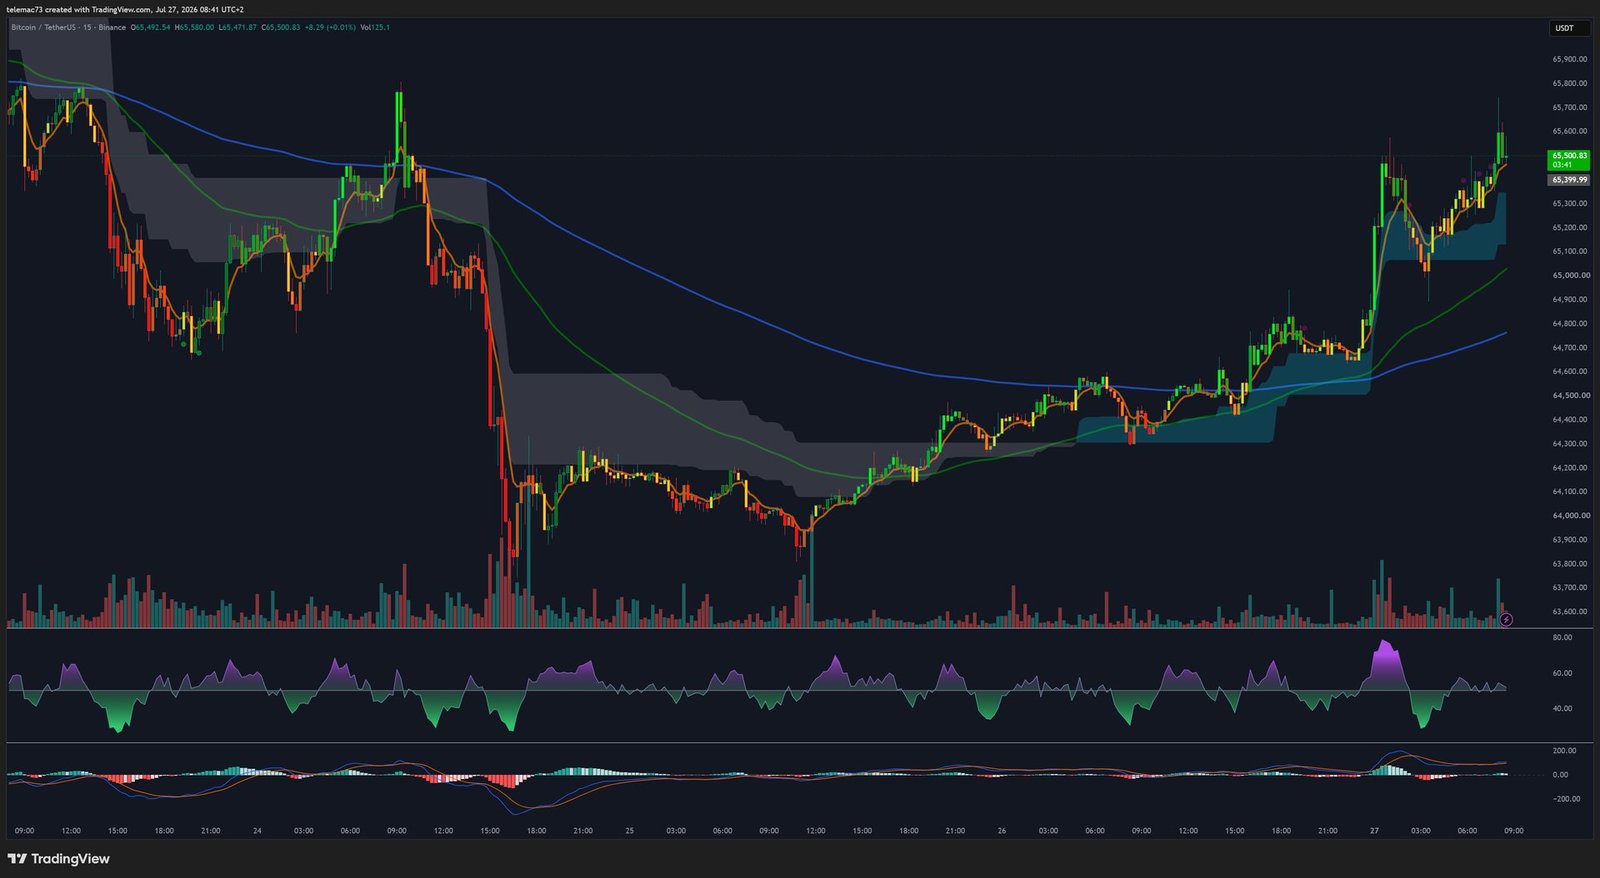
On the M15 chart, price action is dominated by high-frequency algorithmic trading. Every macro or geopolitical headline triggers micro bear flags that are systematically invalidated once the U.S. session opens and ETF-related buy flows take back control. The M15 RSI swings violently between extremes (below 25 during stop hunts, above 75 on impulsive rebounds) around a central intraday pivot at $65,500. Breaking above that pivot typically triggers a scalping cycle toward $66,000 before reverting to the mean. The inability to sustain closes above $66,300 confirms the lack of immediate directional conviction among intraday participants.
Liquidity heatmap: mapping the order book
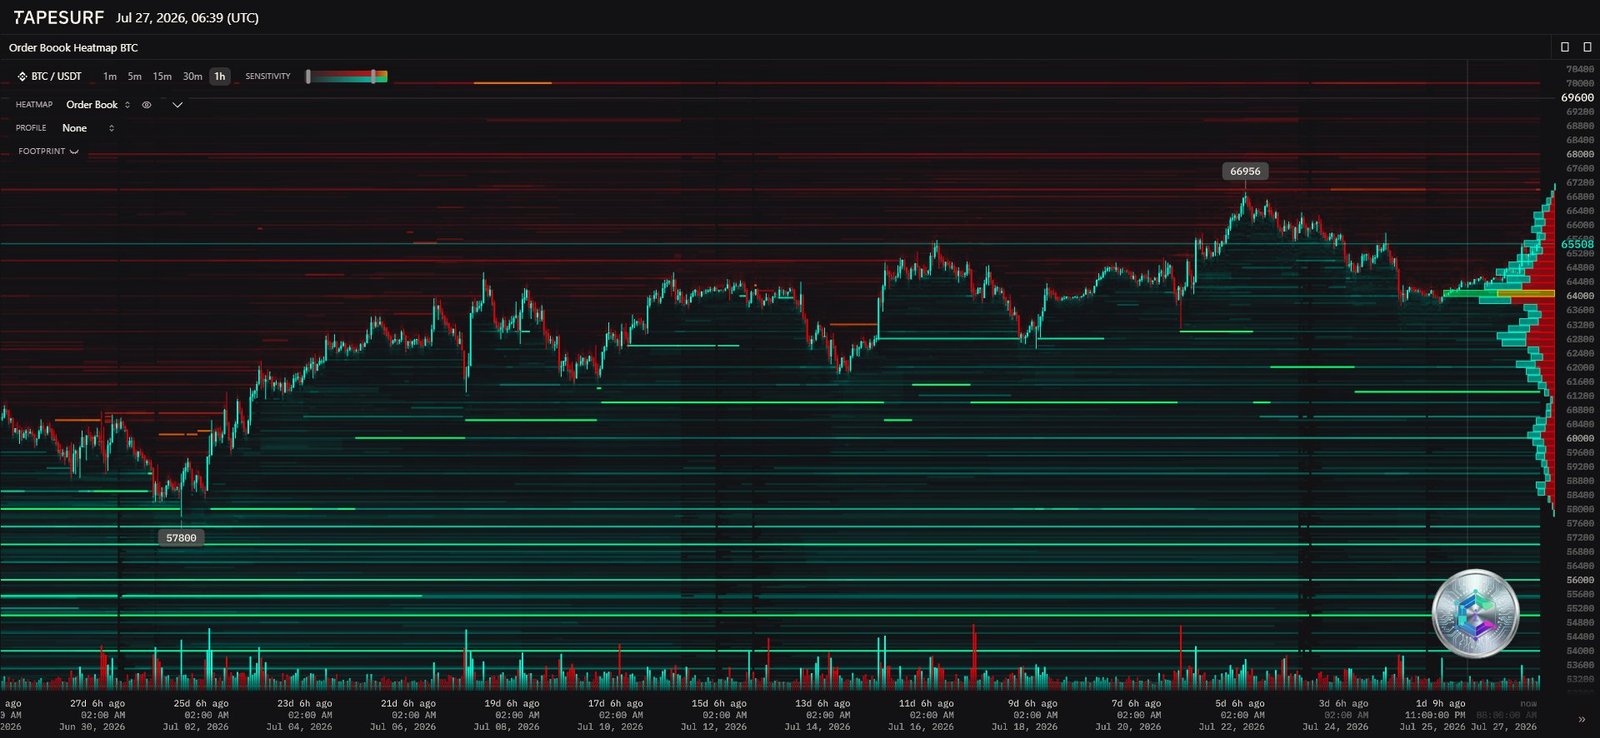
The liquidity heatmap confirms, level by level, the technical zones identified above. On the demand side, a massive institutional buy wall sits between $64,000 and $64,500, corroborating the daily support and the 21-day moving average. Deeper still, a second dense liquidity layer between $62,500 and $63,000 acts as a safety net in case of an exogenous shock. On the supply side, a first line of resistance sits between $66,500 and $67,200, repeatedly tested and rejected. But the densest liquidity zone lies between $70,000 and $72,000 — aligning precisely with the $2.5 billion in open call-option interest. Between $67,200 and $70,000 lies a thin “vacuum gap”: if buyers consume the $67,200 offer with enough volume, price could sweep through this gap rapidly toward the $70,000 wall.
Strategic levels at a glance
| Level | Price (USD) | Rationale |
|---|---|---|
| Extreme volatility target | $72,000 | Derivatives focal point, gamma squeeze risk |
| Historical resistance | $70,000 | Major psychological barrier, heavy heatmap concentration |
| Macro resistance (triangle) | $68,000 | Upper bound of the daily compression |
| H4 rejection zone | $66,500 | Systematic rejections, fading momentum |
| M15 pivot | $65,500 | Intraday algorithmic neutrality zone |
| Vital support | $64,100 | 21-day MA, H4 flag base, heatmap buy walls |
| Capitulation support | $62,500 | Safety net in case of major invalidation |
Altcoins: Bitcoin keeps the upper hand
Bitcoin is showing markedly greater resilience than the rest of the market. Ethereum is underperforming, trading below $1,880-$1,890, with a critical support at $1,790 whose loss could trigger cascading liquidations across DeFi. Solana, XRP, Cardano, and BNB are seeing sharp corrections (up to -4%), while Dogecoin and Hyperliquid show even steeper downside volatility. Only Tron is holding its ground with a modest gain. This broad inability of altcoins to track BTC’s rebounds confirms that fresh capital — largely funneled through U.S. ETFs — remains concentrated in Bitcoin, delaying the usual “altcoin season.”
Conclusion: a compression that won’t last forever
Bitcoin in late July 2026 illustrates a critical phase of institutional maturation. Squeezed between a hostile macro environment and unwavering structural adoption through ETFs, it is compressing considerable energy inside an increasingly narrow triangle. Supports between $64,100 and $64,700 have proven able to absorb shocks, while neutral oscillators leave substantial technical room for expansion without immediate overbought conditions. With implied volatility abnormally low and massive derivatives positioning targeting $72,000, the current setup calls for disciplined risk management rather than pure wait-and-see: favor measured exposure near validated support zones, and avoid excessive leverage ahead of a major Fed policy decision.
Disclaimer: This article is provided strictly for educational and informational purposes. It does not constitute investment advice, a recommendation to buy or sell, or a solicitation to engage in any financial transaction. Cryptocurrency markets are highly volatile and involve a risk of capital loss. Always do your own research (DYOR) and consult a qualified financial advisor before making any investment decision.

