


On July 22, 2026, Bitcoin (BTC) sits at a technical and macroeconomic crossroads rarely seen with such clarity. Having bottomed at a 21-month low near $57,800 in late June, the leading digital asset has caught its breath and now trades between $66,900 and $67,137, reclaiming a decisive technical pivot along the way. Between the massive return of capital through spot ETFs and the persistent specter of Mt. Gox repayments, the market finds itself at a genuine fork in the road. Here is a full breakdown of the forces at play, from order-book liquidity to upcoming price scenarios.
The Macro Backdrop: The Fed, Iran, and China Under Watch
Bitcoin’s growing financialization has made it increasingly sensitive to major macroeconomic variables. Three flashpoints currently dominate the narrative: U.S. monetary policy, Middle East geopolitics, and intervention in Asian markets.
The Federal Reserve, Arbiter of Global Liquidity
June’s U.S. inflation print came in at 3.5% year-over-year, below the consensus estimate of 3.8%. This deceleration feeds the narrative that peak inflation has now passed. Fed Funds futures markets, along with prediction platforms such as Polymarket and Kalshi, assign a probability between 82% and 93% to a monetary status quo at the July 28–29 meeting, with rates remaining in the restrictive 3.5%–3.75% range.
This rate hold is already largely priced in. The real source of volatility will be the tone struck during the press conference: a hawkish message emphasizing sticky core inflation could strengthen the dollar and cool BTC’s recovery, while a dovish pivot would act as a bullish catalyst for non-yielding risk assets.
U.S.–Iran Geopolitical Tensions
Escalating tensions between Washington and Tehran have driven crude oil prices up 25%, an energy shock that traditionally threatens to reignite cost-driven inflation. Notably, Bitcoin has shown remarkable resilience against this exogenous stress, holding firmly above $65,000. This divergence from traditional risk assets points to a maturing investment thesis for BTC, increasingly viewed as an asymmetric, non-sovereign hedge against major geopolitical shocks. Early signs of de-escalation observed recently have also helped ease risk premiums.
The Asian Spillover Effect
Global tech deleveraging weighed heavily on Chinese equities, prompting regulators and sovereign funds to inject roughly 60 billion yuan in liquidity via buyback refinancing facilities. While this liquidity primarily targets domestic equities, coordinated easing across the Asia-Pacific region has historically tended to spill over into digital assets, offering an indirect but real tailwind for Bitcoin.
Capital Flows: Old Supply vs. Institutional Demand
Beyond media noise, it is tangible capital movements that shape the market’s true trajectory.
The Mt. Gox Specter and Reactivated Dormant Whales
The wall of worry that has capped BTC’s bullish ambitions throughout the summer largely stems from Mt. Gox repayments. While the final distribution deadline has been pushed back to October 31, 2026, the trustee still controls roughly 34,504 BTC, and every preparatory transfer from cold wallets continues to trigger sharp market reactions. Adding to this, dormant entities have resurfaced: on July 15, 2026, a wallet inactive since December 2017 moved 5,908 BTC (worth approximately $383 million), unlocking over $283 million in unrealized profit. According to K33 Research, early investors have already distributed a record $300 billion worth of Bitcoin over the past year.
Spot ETFs, the Engine of the Recovery
It is institutional demand, channeled through spot Bitcoin ETFs, that has prevented a deeper capitulation. Over five consecutive trading days, ETFs recorded net inflows of $727 million, following inflows of $75.7 million the previous week. This shift in flows represents the primary reversal mechanism that broke June’s bearish spiral. Driven by giants such as BlackRock and Fidelity, this capital stands out for its “sticky,” long-term nature, unlike the leveraged positions of retail traders. Corporate accumulation is also gaining traction, exemplified by Hyperscale Data, which held 1,087 BTC in mid-July worth over $70.3 million.
The K33 Research Signal: Over 50% of Supply in Loss
K33 Research’s on-chain models have flagged a critical threshold: more than 50% of Bitcoin’s total supply is now in unrealized loss. Historically, this level acts as an early signal of seller exhaustion, with the market consistently finding its low within a maximum of 101 days after this threshold is crossed (101 days in 2014, just 23 days in 2018). The “Summer Slumber” effect, with volumes down to 62.4% of the annual average, is likely only mechanically delaying the expected impulsive rebound.
X-Raying the Order Book: What the Heatmap Reveals
Before diving into classic chart analysis, mapping underlying liquidity is essential. The capture below, from the Tapesurf platform, offers a three-dimensional view of the real intentions of institutional players and high-frequency trading algorithms.
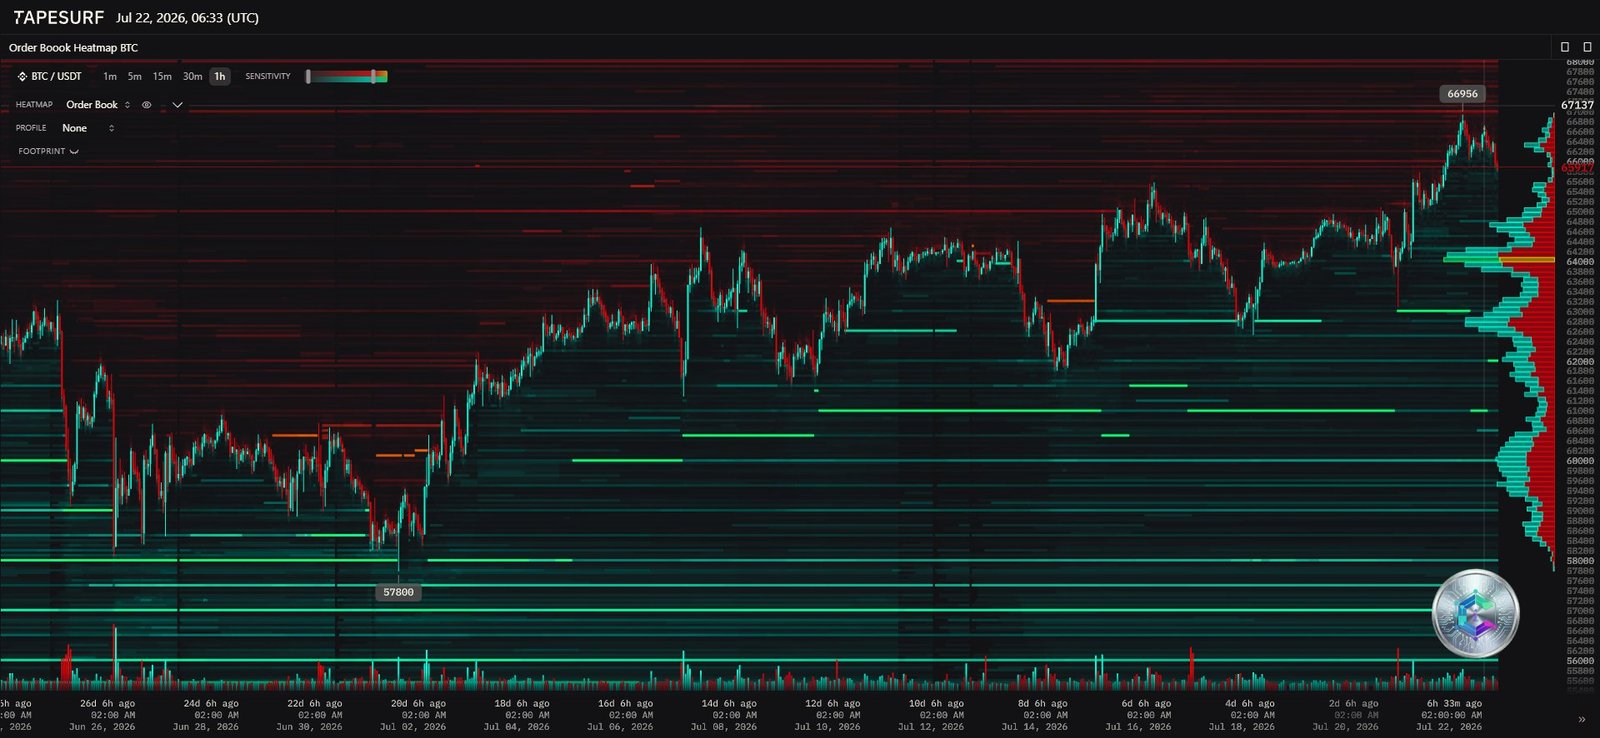
Liquidity is shown as bands of colored intensity. A massive concentration of sell walls sits just above the current price, notably around $66,936 and stretching in layers up toward $68,000. These walls reflect either genuine profit-taking or a spoofing strategy designed to scare off retail buyers before orders are cancelled. Should momentum hold, these same walls could instead fuel a short squeeze.
Conversely, the lower part of the heatmap reveals a robust support base: thick green bands layered throughout the $60,000 zone, with a particularly dense absorption wall anchored at $57,800 — June’s technical and psychological low. As long as this liquidity remains in place, the probability of a sudden collapse below this level stays close to zero, reinforcing the case for slow but sustained accumulation.
Multi-Timeframe Technical Analysis
Daily Timeframe: The Fight for the Moving Averages
The daily chart is the command center of macro-technical analysis.
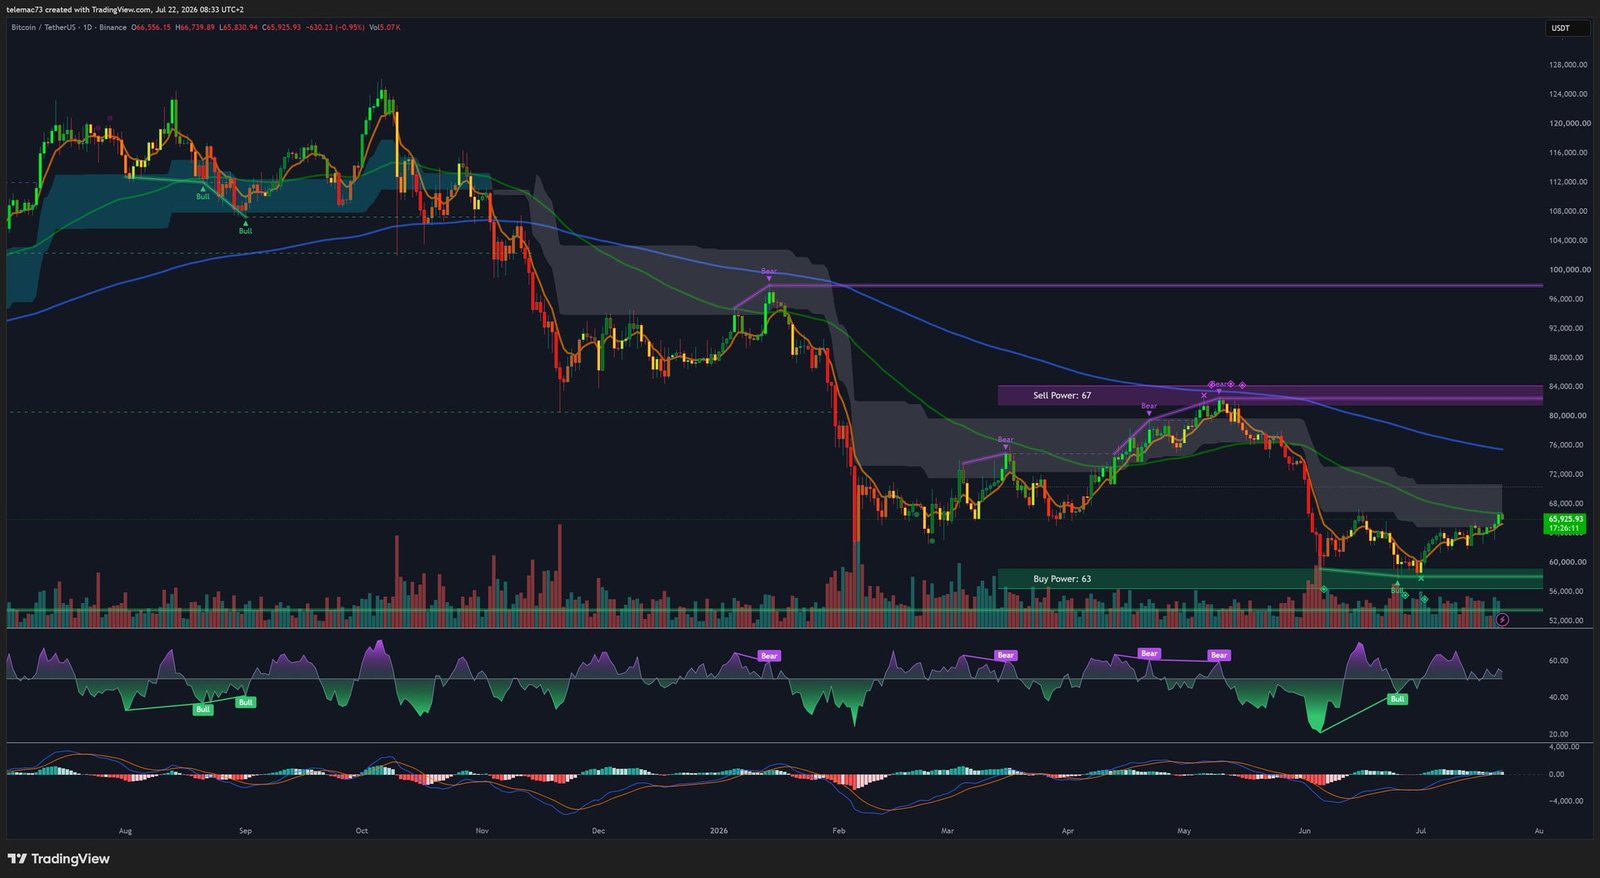
The most significant catalytic development of recent sessions is the explicit reclaim of the 50-day EMA, positioned around $65,050. This moving average, which acted as an unyielding resistance throughout June, was not only pierced but confirmed by several consecutive closes above it, converting former resistance into new support. The platform shows a tense but buyer-favoring balance: “Sell Power” at 67 versus “Buy Power” at 63.
The battle, however, is far from over. The 100-day EMA, hovering around $68,082, is the next wall, while the 200-day EMA — the true arbiter between bull and bear markets — looms menacingly near $73,914. The recent death cross between fast and slow moving averages underscores that a golden cross remains necessary to formally confirm the resumption of a secular bull cycle. On the oscillator front, the daily RSI trades between 57 and 64, well clear of overbought territory, while MACD shows a marked positive divergence, reflecting quiet accumulation.
4-Hour Timeframe: Compression Triangle and Bull Flag
On the H4 scale, the balance tilts clearly toward buyers (Buy Power at 70 versus Sell Power at 60).
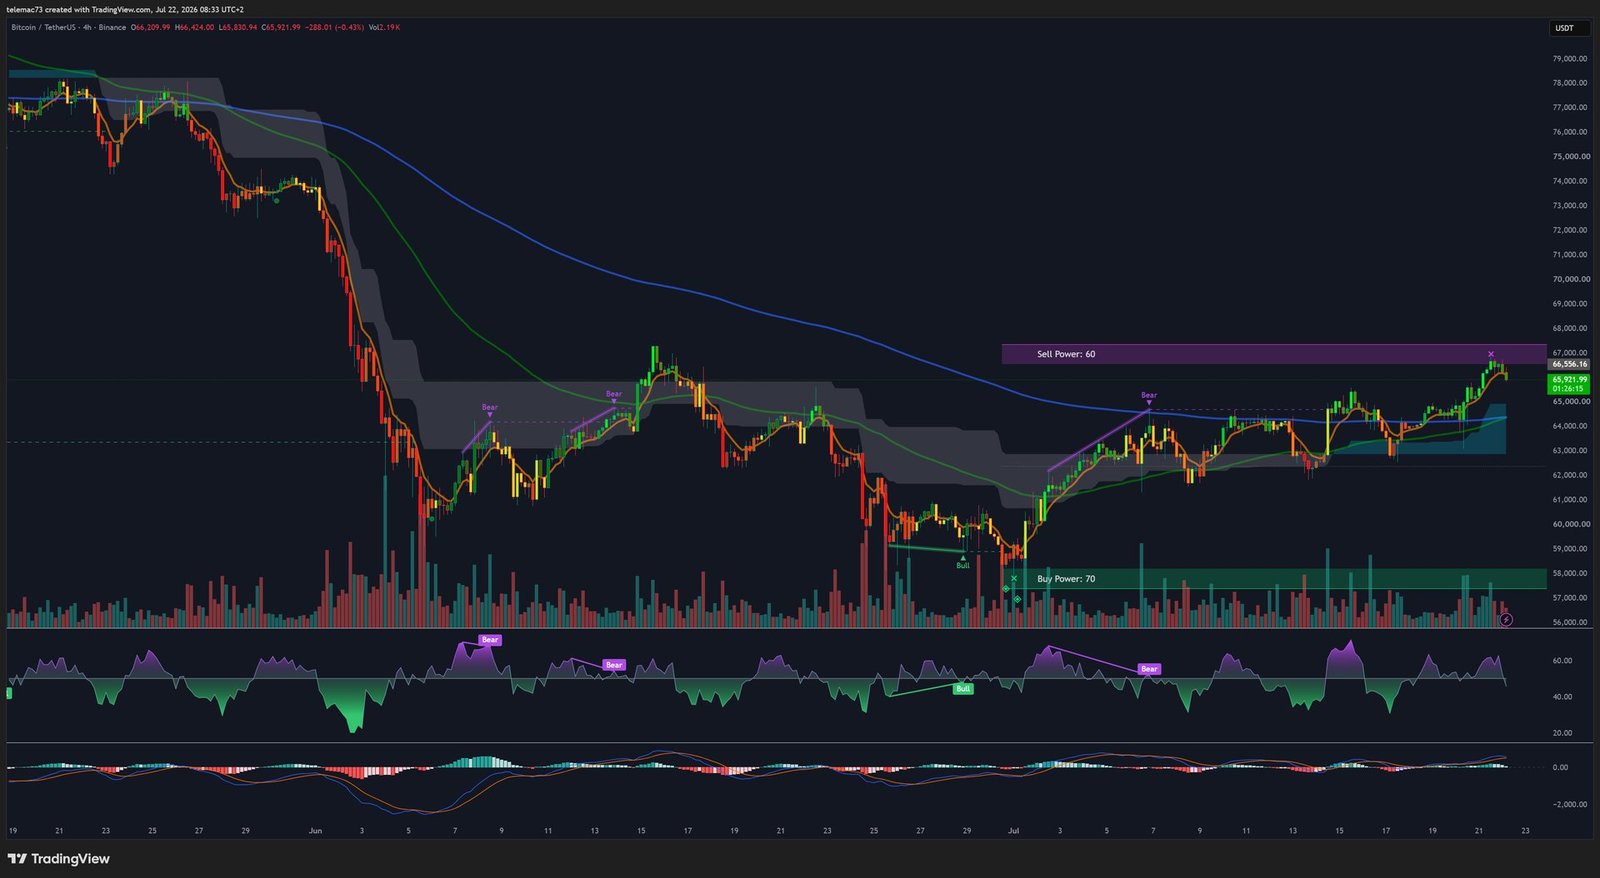
The H4 chart reveals a broad symmetrical compression triangle formed throughout July, as “Summer Slumber” volume declines compressed volatility. The explosive breakout above the upper trendline near $64,000 confirmed the pattern, followed by a bull-flag consolidation whose resolution propelled price toward $66,900. The flagpole’s amplitude projects a theoretical target aligned with the daily 100-EMA resistance ($68,000).
One note of caution: the H4 stochastic and RSI show bearish markers on recent peaks, with RSI having flirted with 80 — a sign of localized overbought conditions and a mild bearish divergence. A technical pullback toward $65,000 would constitute a healthy breather before any further advance.
15-Minute Timeframe: Liquidity Hunting and Intraday Noise
On the microscopic M15 scale, the battlefield of intraday traders and algorithms is fully on display.
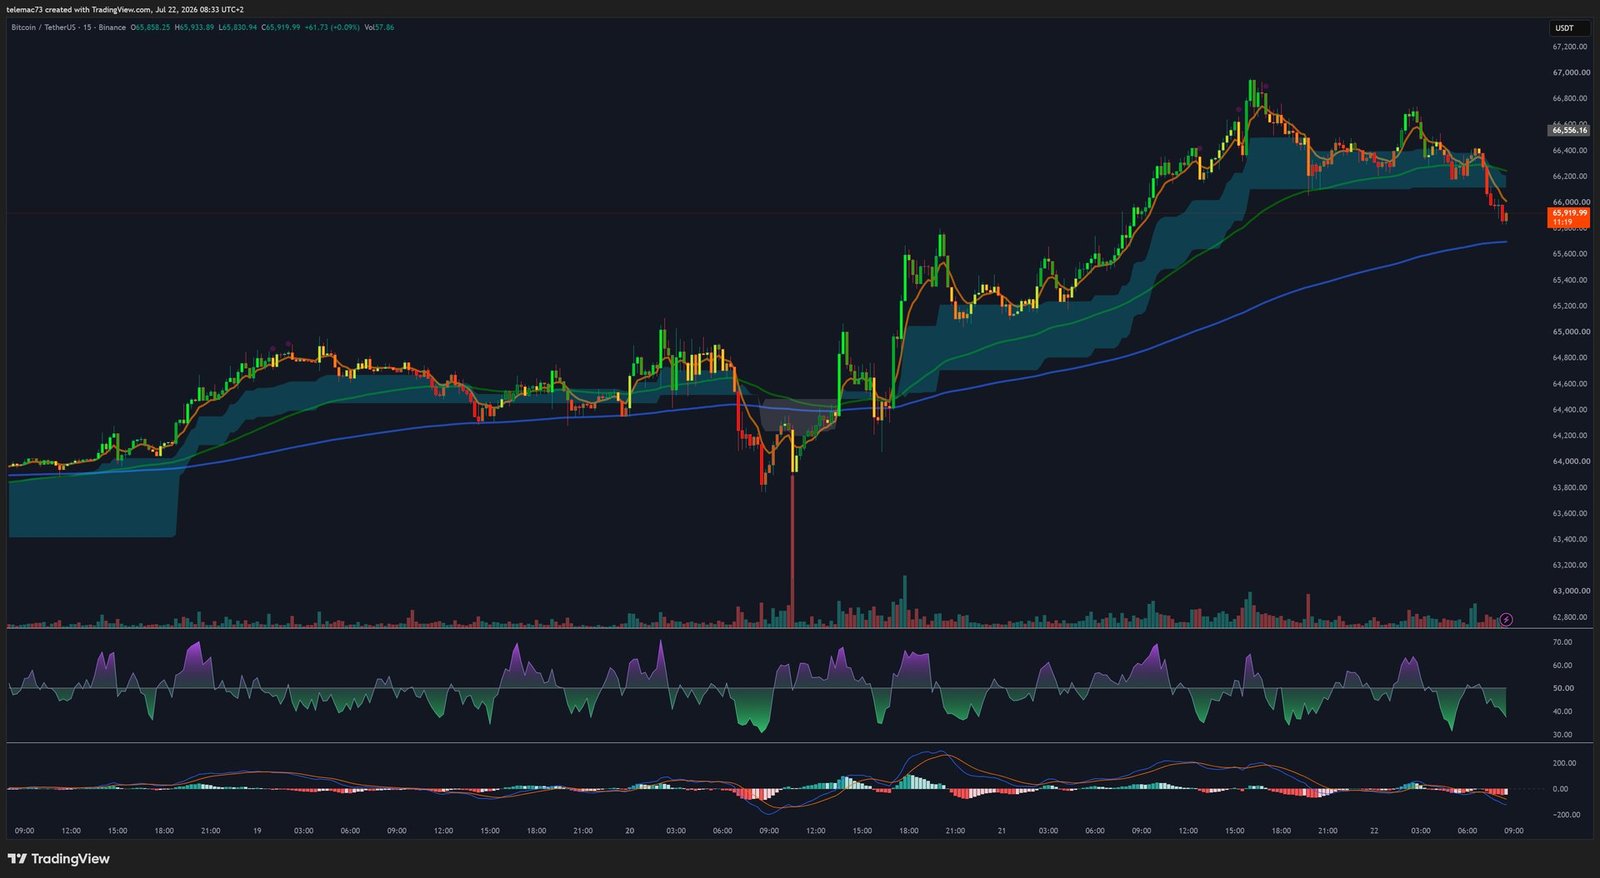
A sharp recent drop followed by an almost immediate V-shaped recovery illustrates a classic liquidity grab: market makers push price below an obvious support to trigger stop-losses on over-leveraged longs, then aggressively buy the dip. The moving average ribbons are currently tangled, signaling strict sideways consolidation, and MACD has flattened around its zero line. As long as the sequence of higher lows remains intact, the tactical edge stays with buyers; losing the $66,500 level, however, would be an early warning sign pointing toward a pullback zone near $65,150.
Key Technical Level Map (BTC/USDT)
| Price Level ($) | Technical ID | Rationale |
|---|---|---|
| 84,410 | Ultimate historical resistance | Former horizontal support now a major long-term resistance. |
| 73,914 – 74,709 | Secular resistance (200-EMA) | Glass ceiling of the macro trend; a break would confirm a new bull run. |
| 72,200 | Pivot / cognitive resistance | Short-term holder cost basis. |
| 70,000 | Psychological resistance | Historical major profit-taking zone. |
| 68,082 – 68,689 | Intermediate resistance (100-EMA) | Coincides with liquidation orders visible on the heatmap. |
| 66,900 – 67,137 | Current friction zone | Spot price; intense sell wall on the heatmap. |
| 65,050 – 65,150 | Central pivot (50-EMA) | Most important level: the line between recovery and distribution. |
| 63,000 – 64,000 | Secondary defensive support | Former base of the compression triangle. |
| 60,000 | Strategic structural floor | Fundamental support of the entire macro structure. |
| 57,800 | Ultimate absorption wall | Massive green wall visible on the heatmap; June correction low. |
The Ethereum Anomaly: Bitcoin Captures Most of the Flows
While Ethereum is also attempting to break free of its own resistances, testing its daily 100-EMA at $1,937, the ETH/BTC ratio remains stuck in a narrow range between 0.028 and 0.029, near historic lows. This persistent underperformance reflects a “flight to quality” dynamic: despite the recent approval of ETH staking-linked vehicles, the overwhelming majority of institutional flows converge toward Bitcoin, perceived as the benchmark digital gold and safe haven. Any broad bullish impulse in the crypto market should therefore, at least in its initial phase, remain led by BTC.
Three Scenarios for the Weeks Ahead
Base Case — Bullish Grind (High Probability)
Aligned with consensus expectations of a Fed rate hold, this scenario sees Bitcoin use the 50-EMA ($65,150) as a springboard, grinding slowly between $65,000 and $68,000. Moderate ETF inflows ($50–100 million per day) quietly absorb selling pressure from Mt. Gox creditors. By late August or early September, a decisive breakout above the 100-EMA ($68,500) would open the way toward a test of $70,000.
Bullish Scenario — Impulsive Acceleration (Moderate Probability)
A surprise dovish Fed pivot, combined with rapid geopolitical de-escalation, would trigger a massive wave of ETF inflows exceeding $1 billion per week. The H4 compression triangle would break out to the upside, pushing the daily RSI into sustained overbought territory and Bitcoin past the 200-EMA ($74,700) on towering volume, opening the way toward new all-time highs.
Bearish Scenario — Structural Invalidation (Low Probability)
A sharp energy-driven rebound in inflation would force the Fed into a “higher for longer” stance, coinciding with the onset of massive Mt. Gox trustee distributions. The resulting supply surge would overwhelm ETF absorption capacity, breaking the 50-EMA ($65,150), triggering a long squeeze, and then a MACD death cross. Price would then test the heatmap’s ultimate absorption wall at $57,800, and a break below it would invalidate the entire bullish cycle.
Summary
As of July 22, 2026, Bitcoin appears to be an asset in the midst of a resilient recovery, pulling itself out of a punishing summer correction. Reclaiming the 50-EMA ($65,150) represents a major structural achievement, potentially marking the shift from a distribution phase to a new era of institutional accumulation. Caution remains warranted, however: the market is trading in a narrow corridor, weakened by “Summer Slumber” illiquidity, and remains vulnerable to geopolitical and monetary shocks. The clash between the wall of regulated demand (ETFs) and the specter of old supply (Mt. Gox) will determine whether Bitcoin has the power to break through the 200-EMA fortress ($74,700) and usher in a new phase of value expansion.
Disclaimer: this article is provided for informational and educational purposes only. It does not constitute investment advice, a recommendation to buy or sell, or a solicitation to trade digital assets. Cryptocurrency markets are highly volatile and involve risk of capital loss. Always do your own research (DYOR) and consult a licensed financial advisor before making any investment decision.

