
On April 25, 2026, Bitcoin trades in a tight range between $77,446 and $78,126, stabilizing after an intraday correction of approximately 1.06%. Yet behind this apparent calm lies a striking paradox: while institutions accumulate at a frenetic pace, the Fear & Greed index stagnates at 31, anchoring sentiment firmly in « Fear » territory. The global market shows a $2.67 trillion capitalization, with BTC reasserting its dominance at 58.08%. Decoding a sleeping titan poised at the edge of a volatility precipice.
Macroeconomic context: between headwinds and internal catalysts
Bitcoin’s behavior, though originally designed as a decentralized store of value, is now intrinsically correlated with global macroeconomic liquidity fluctuations. In Q1 2026, retail investor volumes declined 11% year-over-year amid a risk-off environment driven by restrictive monetary conditions.
The Fed’s « hawkish pause » and dollar hegemony
The macro-financial environment is dominated by uncertainty surrounding US tariff policy and the persistent strength of the dollar. The recent FOMC interpretation, labeled a hawkish pause, triggered temporary capital outflows of $405 million from digital investment products before turning positive by week’s end.
The DXY index has resumed its uptrend, forming a higher low on the daily RSI and targeting a gap fill at 99.516. This appreciation exerts mechanical pressure on all dollar-denominated assets. The absence of a clear Fed signal regarding rate cuts in June and July keeps the opportunity cost of holding non-yielding assets at prohibitive levels.
Middle East geopolitical tensions
The deteriorating geopolitical stability weighs as a psychological lid on risk appetite. The escalation between Iran and the United States — marked by Iranian forces opening fire on three commercial vessels in the Strait of Hormuz, and a US naval blockade labeled an « act of war » by Tehran — annihilates hopes of short-term de-escalation. In this context, BTC’s ability to hold its support around $77,000 is perceived as a remarkable demonstration of relative strength.
Internal catalysts: Tether and stealth QE
Against these headwinds, the crypto microstructure benefits from powerful catalysts. The most resounding development is Tether’s colossal mint of $5 billion in USDT. Historically, stablecoin supply expansion serves as the primary leading indicator of imminent dry powder deployment. In parallel, the US Treasury’s proposal to buy back $15 billion of its own debt acts as stealth quantitative easing, likely to trickle down into high-beta assets.
Institutional flows: a brewing supply shock
The voracious appetite of spot ETFs
Institutional demand shows no signs of slowing. During the week ending April 24, US spot Bitcoin ETFs recorded $809.25 million in net inflows, marking an uninterrupted seven-day streak of positive flows. More impressive still: over a five-day rolling window, these vehicles absorbed nearly 19,000 BTC.
The mathematical impact is systemic: this pace represents approximately nine times the volume of newly mined supply over the same period. This asymmetry between an inelastic emission (deflationary by successive halvings) and exponential institutional demand lays the groundwork for an imminent supply shock.
MicroStrategy: the institutional price floor
MicroStrategy continues its aggressive accumulation despite an unrealized loss of $14.46 billion in Q1. The firm acquired 34,164 additional BTC for $2.54 billion, bringing its holdings to 815,061 BTC at an average purchase price of $75,527. This level establishes a de facto unofficial institutional price floor, reinforcing conviction on the $74,000 – $75,000 support zone.
aSOPR signals the end of capitulation
The Adjusted Spent Output Profit Ratio indicator has decisively crossed back above the neutral 1.0 threshold. This mathematical pivot indicates that the market has absorbed capitulation pressure and possesses the liquidity needed to support profit-taking without price collapse. Combined with BTC reclaiming the « True Market Mean, » this behavior certifies the shift to a constructive accumulation regime.
Microstructure: the order book heatmap
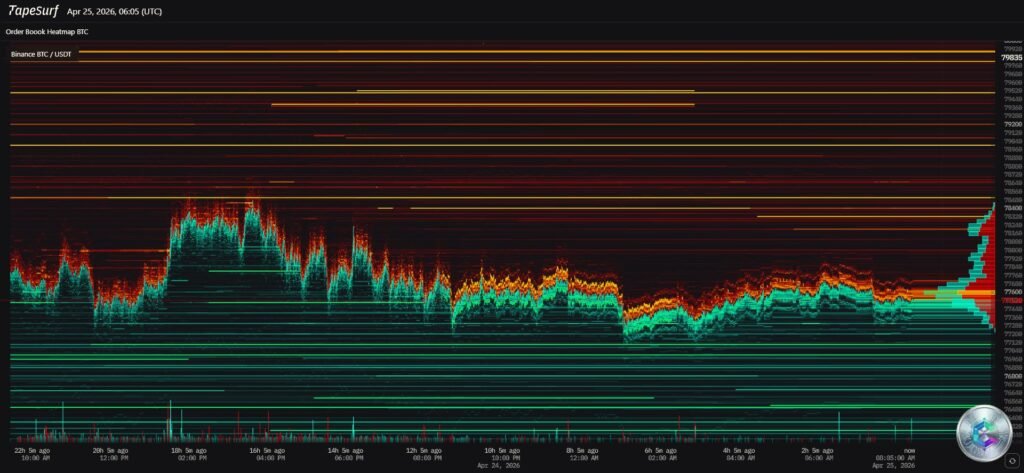
The heatmap translates market depth into colors: dark zones indicate liquidity scarcity, while bright lines (green to intense red) materialize massive concentrations of limit orders. This X-ray is essential for understanding the mechanics of upcoming price movements.
The asphyxiating $80,000 sell wall
The upper portion of the chart reveals impressive supply stratification. Starting at $78,000 and thickening to the psychological $80,000 threshold, multiple glowing red bands materialize « sell walls »: tens of thousands of BTC positioned for sale. These walls require phenomenal market buy volumes to be absorbed, mechanically exhausting bullish momentum. The extreme density between $79,500 and $80,000 confirms this zone as the most consequential psychological and technical ceiling of the entire 2026 recovery.
Support trenches: the buy-side defense
Conversely, bright green bands streak the lower zones. A first moderate stratum appears around $77,000, but true concentration sits at $76,000, $75,000 and especially in a massive barrier near $74,000. The alignment of these walls with MicroStrategy’s average purchase price ($75,527) and the 100-day EMA is no coincidence: it represents a tactical confluence where institutional algorithms deploy capital.
The asymmetric liquidation risk
The market is « tightly wound » with systemic risks on both sides within a 3% volatility band. A break above $79,178 would liquidate $841.04 million in short positions (short squeeze). Conversely, a breakdown below $76,829 would trigger the liquidation of $878.85 million in long positions (long squeeze). Nearly $1.7 billion in bilateral liquidations await the slightest spark.
Macro-technical analysis: the daily chart
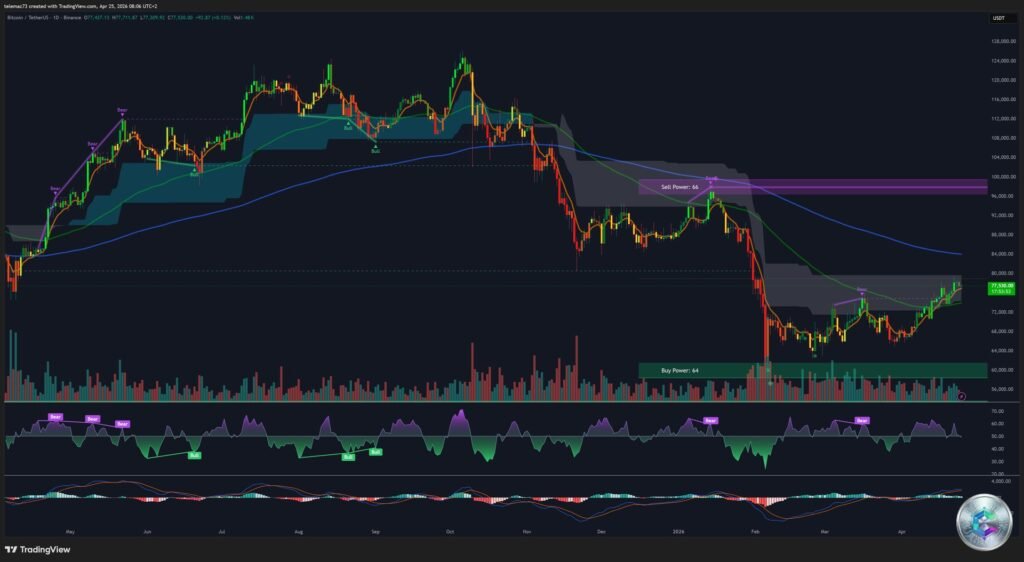
Anatomy of a cycle: from euphoria to renaissance
The price scale peaks at $128,000: in late 2025, BTC traded in exceptional realms with multiple highs between $120,000 and $124,000. This exuberance gave way to a brutal capitulation down to $60,000 in early 2026, purging nearly all leverage excess. It is in this pit that the massive green box « Buy Power: 64 » appears — the macroscopic foundation where silent institutional accumulation finally overpowered seller panic.
Reconstruction and daily indicators
The current markup phase exhibits a clinically clean technical architecture: decisive breakout of the major descending channel that imprisoned price from October 2025 to early April 2026, healthy sequence of higher lows and higher highs. The daily MACD displays a perfect golden cross with an expanding histogram. The RSI evolves in an ascending channel between 60 and 63: optimal bullish momentum with comfortable headroom before overbought territory.
The macroscopic objective remains the historical resistance zone « Sell Power: 66 » overhanging price action between $96,000 and $100,000 — the point where buyers from the previous cycle will seek to close their positions at parity.
Meso-technical analysis: the 4-hour chart
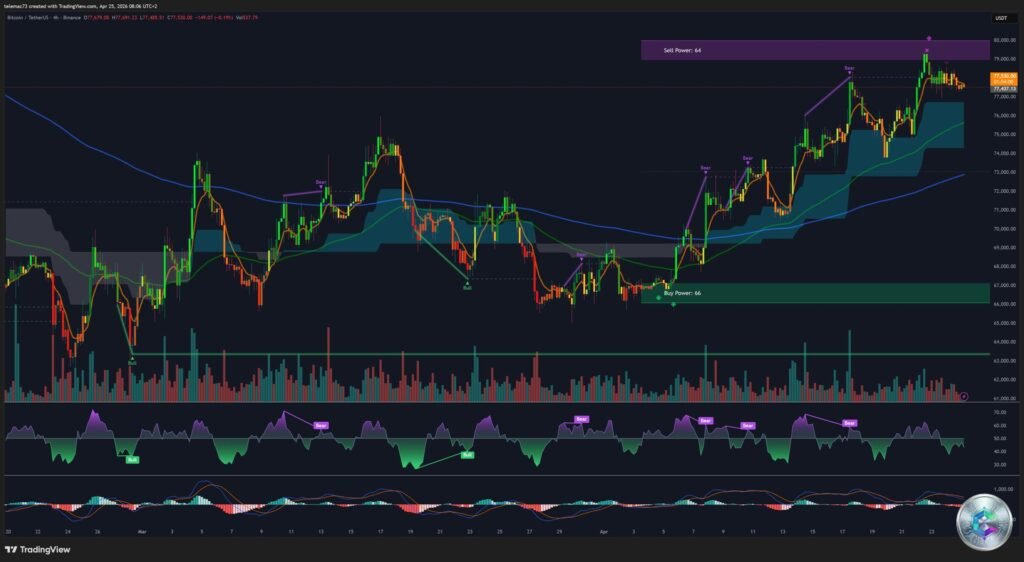
The ascending triangle: maximum pressure
H4 price action is circumscribed within a classic ascending compression triangle: a flat resistance line at $79,000 – $80,000 and an ascending lower support. This bullish continuation pattern implies growing pressure on resistance, with buyers paying progressively higher prices while supply at the ceiling remains static.
The chart features algorithmic indicators: the upper purple band « Sell Power: 61 » encompasses the $80,000 resistance, while the lower green band « Buy Power: 66 » anchors the demand foundation at $66,000 – $67,000. The fact that Buy Power (66) is mathematically greater than Sell Power (61) provides a subtle clue of long-term bullish directional asymmetry.
Moving averages and divergences
Price navigates robustly above key moving averages, which act as dynamic launchpads. However, the H4 RSI fails to print new highs in perfect correlation with price, revealing a potential hidden bearish divergence. The MACD remains positive but intertwined. The volume absence beneath the triangle is typical of compression apexes: potential energy accumulates while awaiting a fundamental catalyst.
Micro-technical analysis: the 15-minute chart
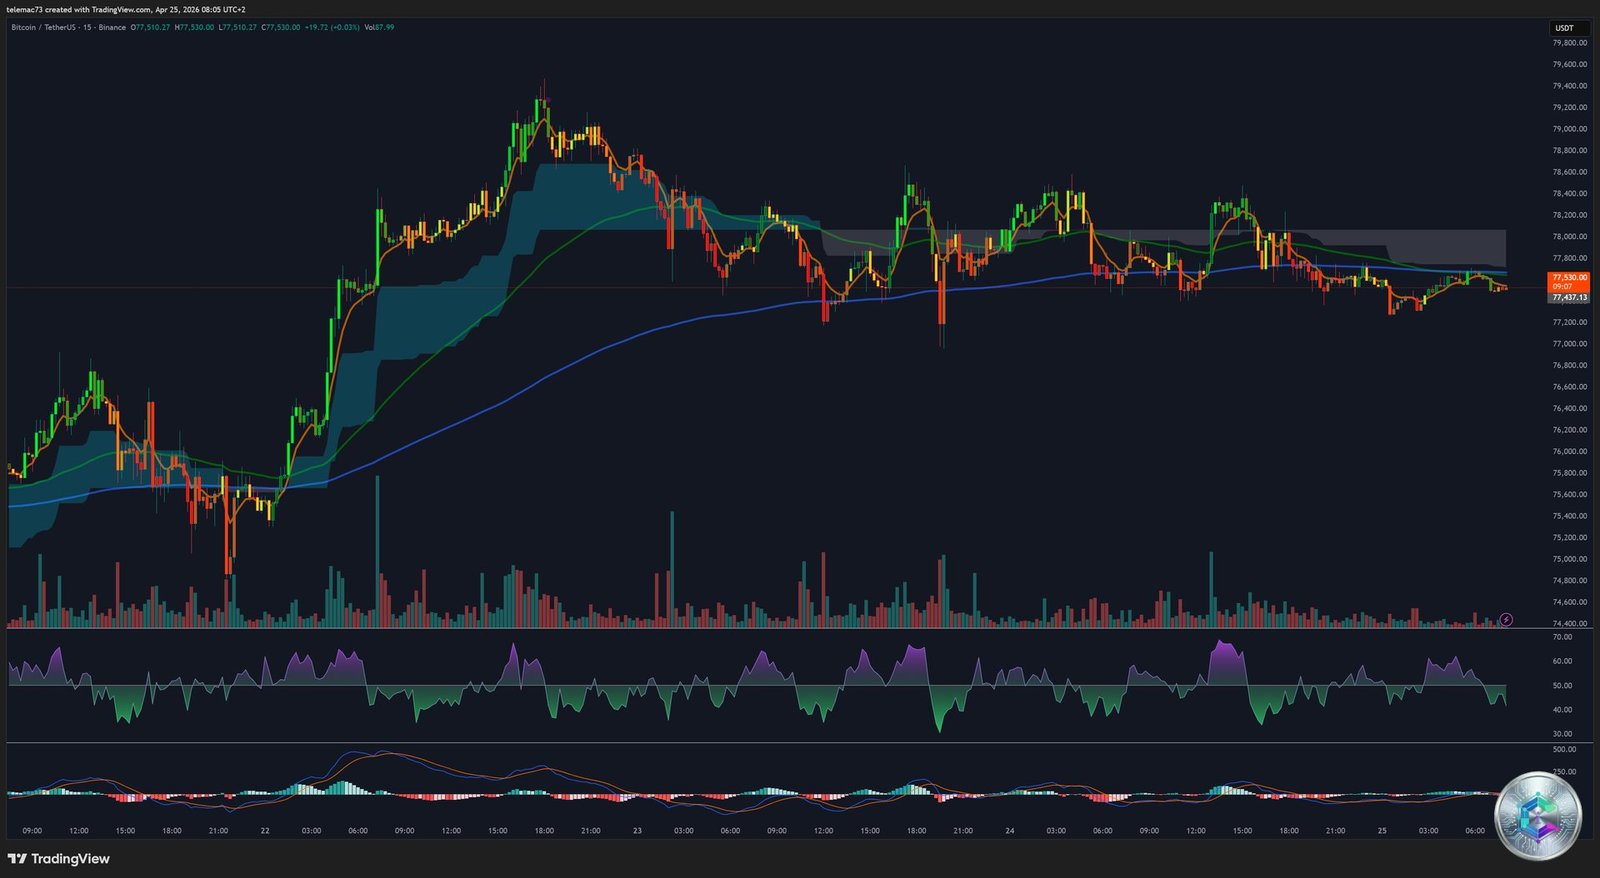
Volatility, noise and liquidity sweeps
At this granularity, price action around $77,500 resembles stochastic noise. Sharp sell-offs followed by V-shaped recoveries are the typical signature of liquidity sweeps, where large entities temporarily manipulate price to trigger retail stop-losses before returning the quote to its baseline. Bull flags and bear pennants form and invalidate at the whim of order flow.
Short-term oscillator exhaustion
The 15m RSI oscillates nervously between 40 and 60, struggling to durably reach extreme zones. The MACD meanders around zero with multiple whipsaws. This paralysis is in fact revealing: market-making algorithms have « locked » price in an equilibrium zone, fragmenting their orders via TWAP/VWAP to accumulate discreetly while awaiting major exchange openings to imprint the true directional move.
Bitcoin dominance and the altcoin ecosystem
BTC dominance continues its relentless climb toward 60% – 61%, a toxic level for smaller-cap assets. This configuration reflects a massive flight to quality, typical of late corrective cycles. Ethereum, prince of the altcoins, struggles to preserve its structural support around $2,300, and its inability to break TBO resistance confirms downward pressure on the ETH/BTC pair. XRP remains tetanized around $1.43, awaiting the critical resolution of the Ripple-SEC litigation that could serve as foundational jurisprudence for the entire ecosystem.
Synthesis of strategic levels
| Level Type | Quotation (USD) | Technical Foundation |
|---|---|---|
| Macro Distribution (Ultimate R) | $96,000 – $100,000 | Daily chart « Sell Power: 66 » block. Six-figure psychological barrier. |
| Breakout Target (R3) | $88,000 – $90,000 | 200-day SMA confluence and historical supply cluster. |
| Fib/MA Resistance (R2) | $82,290 – $83,437 | 200-day EMA crossing 61.8% Fibonacci retracement. |
| Liquidation Ceiling (R1) | $79,178 – $81,145 | H4 triangle apex. Short squeeze trigger ($841M). CME gap at $81,145. |
| Equilibrium Pivot | ~ $77,500 | Intraday friction zone. ETF absorption / market-making parity. |
| First Line Support (S1) | $75,498 – $75,680 | Retested top of broken channel. 100-day EMA confluence. |
| Institutional Support (S2) | $74,000 – $74,487 | Heatmap buy wall. 38.2% Fibonacci. MicroStrategy average price. |
| Macro Support (S3) | $66,000 – $70,000 | H4 « Buy Power: 66 » base. Absolute psychological floor. |
Strategic scenario modeling
Alpha scenario: the bullish supply shock
This scenario anticipates an explosive upside resolution of the ascending triangle. The frenetic ETF accumulation pace (19,000 BTC in 5 days) would eventually exhaust stagnant liquidity between $79,000 and $80,000. The trigger could come from a surprise US inflation deceleration or diplomatic relief in the Strait of Hormuz. Once $79,178 is breached, algorithmic execution would liquidate $841M in shorts, propelling price as a god candle toward the CME gap at $81,145, then targeting the Fibonacci/EMA 200 confluence at $82,000 – $83,400.
Beta scenario: the bull trap and deep liquidity sweep
The alternative highlights warnings from several quantitative analysts: the current rally could be a bull trap induced by an artificial liquidity rebound. The sell walls would not be there to be absorbed but to serve as an institutional distribution zone. A formal Iran/US military escalation would abruptly dry up ETF flows. A break of the ascending trendline support at $76,800 would trigger the inverse apocalypse: $878.85M in longs liquidated, perforation of the 100-day EMA ($75,498), and violent crash into the $74,000 – $74,500 zone to test MicroStrategy’s defense.
Gamma scenario: lateral attrition
The third scenario, often the most psychologically grueling for retail traders, projects an artificial maintenance of the status quo. BTC would bog down in a lateral drift between $75,500 and $80,000, characterized by 15-minute fakeouts designed to harvest funding premiums and sweep impatient traders’ liquidity. This horizontal consolidation would allow long-term oscillators to dissipate their overheating and moving averages to catch up with price, laying the foundation for a more powerful subsequent directional move, likely pushed back to Q3 2026.
Conclusion: a sleeping titan at the edge of the precipice
The Bitcoin market on April 25, 2026 reveals the image of a sleeping titan at the edge of a volatility precipice. The technical infrastructure shows undeniable healing signs: decisive break of the six-month descending channel, recovery above the True Market Mean, positive slope of daily moving averages. The investigation of on-chain metrics and institutional balance sheets dissipates any doubt about corporate accumulation voracity.
Nevertheless, prudence imposes an unbiased reading: the asset crashes against a titanic algorithmic barrier at $80,000, the derivatives ecosystem is intoxicated by leverage, and sentiment remains weighed down by geopolitical waves and DXY appreciation. Bitcoin finds itself compressed in the apex of a multidimensional triangulation. The outcome of this war of attrition between unyielding technical supply at $80,000 and underlying institutional demand will define the asset’s secular trajectory for the remainder of 2026. The only valid analytical doctrine: await a surgically confirmed weekly close beyond critical levels and draconian monitoring of volumetric absorption.
⚠️ Disclaimer
This article is published solely for educational and informational purposes. It does not constitute investment advice, a recommendation to buy or sell financial assets, or an incentive to engage in market operations. Trading and investing in cryptocurrencies involve significant risks of capital loss. Past performance is not indicative of future results. Before making any investment decision, consult a qualified financial advisor and only invest amounts you can afford to lose.