
In May 2026, Solana sits at a technically precise crossroads: compressed at the geometric apex of a symmetrical triangle on the 4-hour chart, SOL simultaneously concentrates an unprecedented architectural revolution, massive institutional adoption, and an explosive liquidity topography. Here is a complete multi-dimensional analysis.
1. Macroeconomic Context: A Historic Fundamental Divergence
The global macroeconomic environment offers mixed signals for risk assets in Q2 2026. Rising crude oil prices and a weakening directional momentum in Bitcoin are creating a climate of systemic uncertainty weighing on the entire crypto sector. Historically, such a risk-off environment tends to drain liquidity from peripheral technology assets.
Nevertheless, internal Solana network analysis reveals a striking positive divergence between price action — which suffered severe bearish pressure in Q1 2026 — and the near-exponential expansion of its underlying fundamentals. The share of active developers on Solana has surged 45% over the last quarter, reaching 23% of the global Web3 development market share. Intellectual human capital is the primary leading indicator of a decentralized ecosystem’s future value.
Institutional momentum is also palpable at major industry events. Solana Accelerate in Miami (May 5, 2026) spotlighted the emergence of Internet Capital Markets, demonstrating how Solana’s high-frequency infrastructure can redefine global capital formation and deployment. The upcoming Solana Breakpoint conference in London in November 2026 will mark the event’s first foray into Europe’s financial capital, with a focus on Real World Asset (RWA) tokenization.
2. Architectural Revolution: The Advent of Alpenglow Consensus
Solana’s long-term intrinsic value cannot be evaluated without understanding its most radical technological transformation in history: the Alpenglow consensus upgrade, validated by community governance with 98.27% approval (representing 52% of staked tokens), targeting mainnet deployment in Q2/Q3 2026. Developed by Anza (a team from Solana Labs), this upgrade completely replaces Proof of History (PoH) and the TowerBFT mechanism.
Votor: Finality in 100–150 ms
Alpenglow is built on two new architectural engines. Votor replaces TowerBFT with an off-chain vote aggregation model using BLS (Boneh-Lynn-Shacham) cryptographic signatures. Its Dual-Path Finality achieves finality in ~100 ms when 80% of staked weight validates in the first round, or ~150 ms via a slow path if the initial threshold is between 60% and 80%. By comparison, Ethereum requires ~12 minutes, Cosmos 6–7 seconds, and Avalanche 1–2 seconds.
Rotor: Block Propagation in 18 ms
Rotor replaces Turbine by introducing deterministic stake-weighted relay paths and erasure coding. Engineering simulations demonstrate block propagation completed in ~18 milliseconds under typical data center conditions. The Votor + Rotor combination makes PoH obsolete. Furthermore, Alpenglow structurally penalizes « dark MEV » behavior: leaders who artificially delay blocks immediately lose their block rewards and face a drastic reduction in their future slot election probability.
| Component | Old Architecture | Alpenglow 2026 | Impact |
|---|---|---|---|
| Vote / Consensus | TowerBFT (on-chain) | Votor (off-chain, BLS) | Reduced ledger bloat, lower validator costs |
| Network Clock | Proof of History (PoH) | Simple local timeout timers | Global sync complexity eliminated |
| Block Propagation | Turbine (gossip multi-hop) | Rotor (deterministic, erasure coding) | ~18 ms propagation |
| Finality | ~12.8 seconds | 100–150 ms (Dual-Path) | 100x improvement |
| MEV | Exploitable delay windows | Strict penalties on future slots | Fair execution |
3. Institutional Adoption: Western Union, ETFs and TradFi Capital
In May 2026, the most seismic fundamental event was Western Union‘s launch of its payment stablecoin USDPT, natively issued on the Solana blockchain in partnership with Crossmint and issued by Anchorage Digital Bank N.A. — the very first crypto bank to operate under a U.S. federal charter. This move formally validates Solana as the primary settlement infrastructure for global capital flows covering more than 200 countries.
This momentum fits within a broader macro-adoption cycle: Franklin Templeton, Mastercard, Ondo, and Zepz are already deploying RWA tokenization and payment infrastructures in production on Solana. Spot Solana ETFs, launched in October 2025, crossed the $1 billion net cumulative inflows threshold by end of April 2026. Bitwise’s BSOL captures ~78% of flows with $611.8M in assets. VanEck’s VSOL offers a net staking yield of 5.03%. Goldman Sachs holds a $108M position in SOL ETFs. Morgan Stanley has filed for its own ETF product.
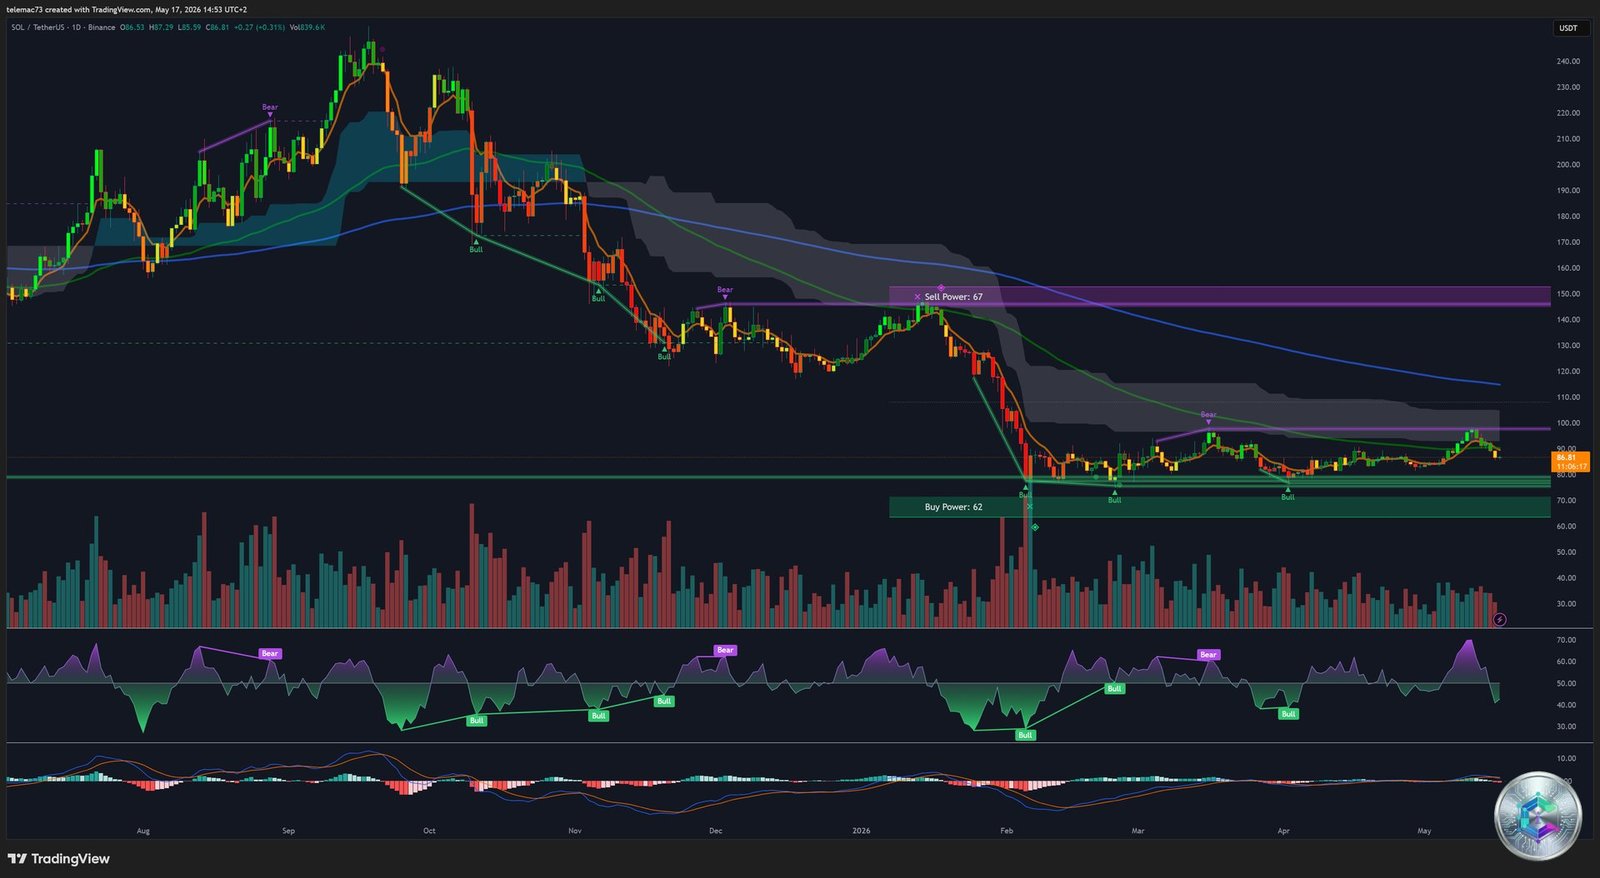
4. Chart Analysis: The Daily (1D) Chart
SOL is currently trading around $86.81–$86.94, trapped in a broad lateral consolidation structure since February 2026. This channel is bounded by a major institutional accumulation floor around $78.17 and a massive distribution ceiling near $97.79. Price recently attempted to break free from the bearish cloud’s influence, hitting a seller wall at $98 before being rejected back into the mid-range zone ($88–$92).
On the oscillator front, the picture is revealing. The 14-day RSI navigates near-perfect neutrality at 51.68 — neither overbought nor oversold — meaning the market has accumulated sufficient potential energy to initiate a strong directional move. The most critical element lies in the daily MACD: the MACD line has recently crossed the signal line upward (oscillator Golden Cross), with the histogram turning from red to green. Historically, this specific signal on SOL’s daily MACD has preceded rallies of 100% to 860% in previous cycles.
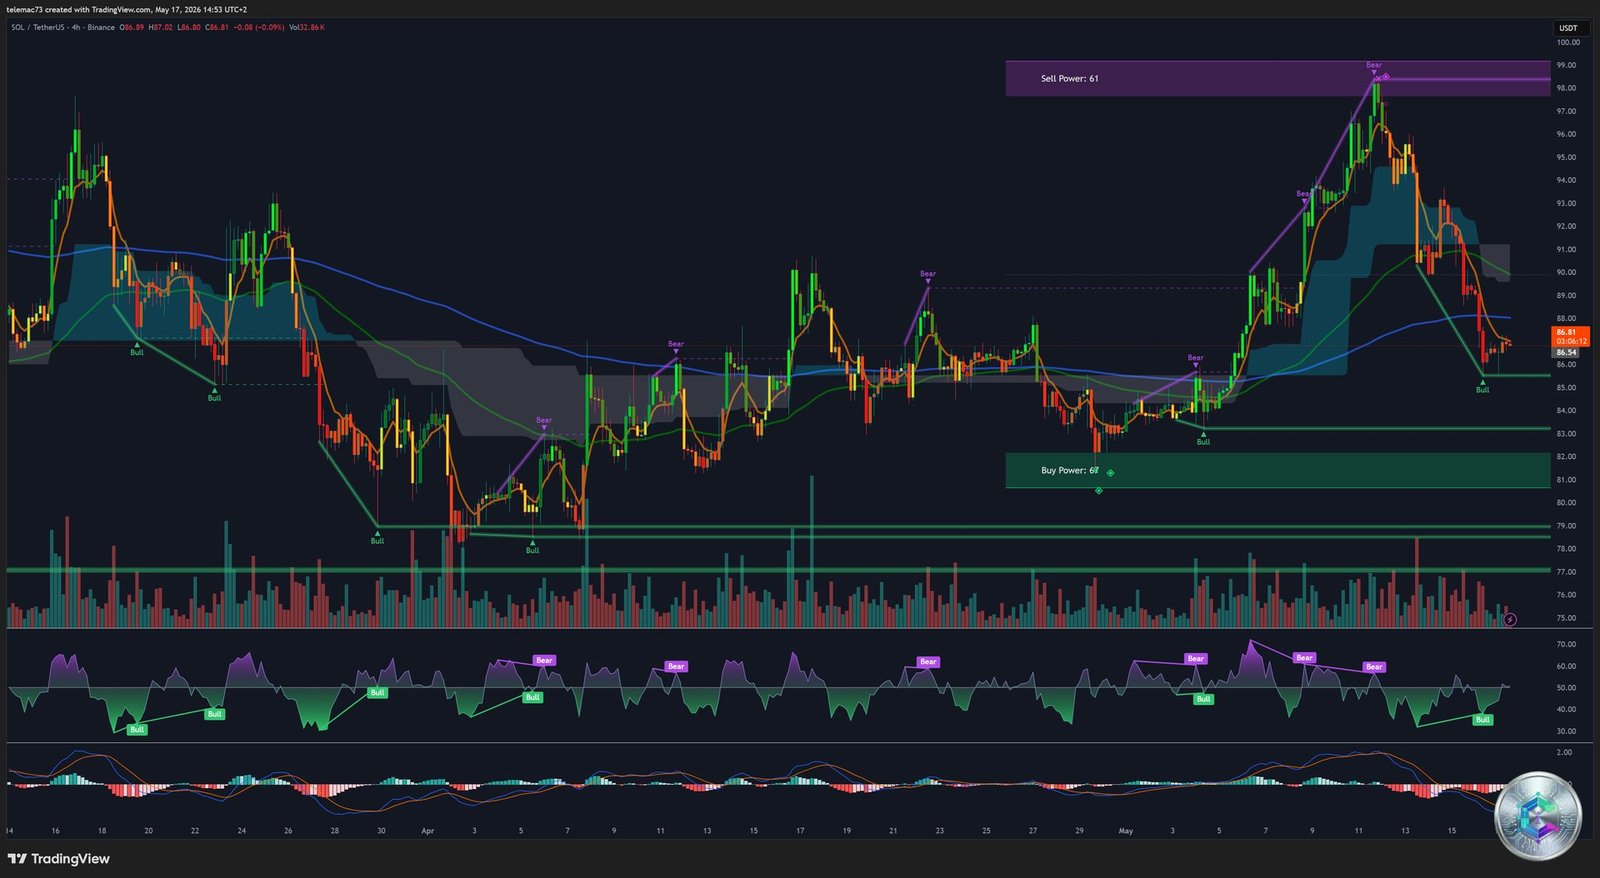
5. Extreme Compression: The 4-Hour (4H) Chart
The 4-hour timeframe offers a precise X-ray of medium-term market participant psychology. Following the violent purge from $100 down to the $80s, price action ceased making major lower lows and consolidated into a chartist pattern of remarkable mathematical precision: a symmetrical triangle. The upper resistance and lower support trendlines converge at nearly perfectly opposite slopes, with SOL now cornered at the triangle’s geometric apex.
At a triangle apex, intra-period volatility is artificially crushed. The 4H MACD corroborates this: the oscillator lines are flat, hugging the zero line, with a virtually non-existent histogram — the signature of considerable accumulated kinetic energy. The statistically imminent breakout is projected to generate a directional move of at least 10% (~$8.50) upon breaking either trendline. The « Buy Power: 67 » zone is concentrated around $81.30–$84.
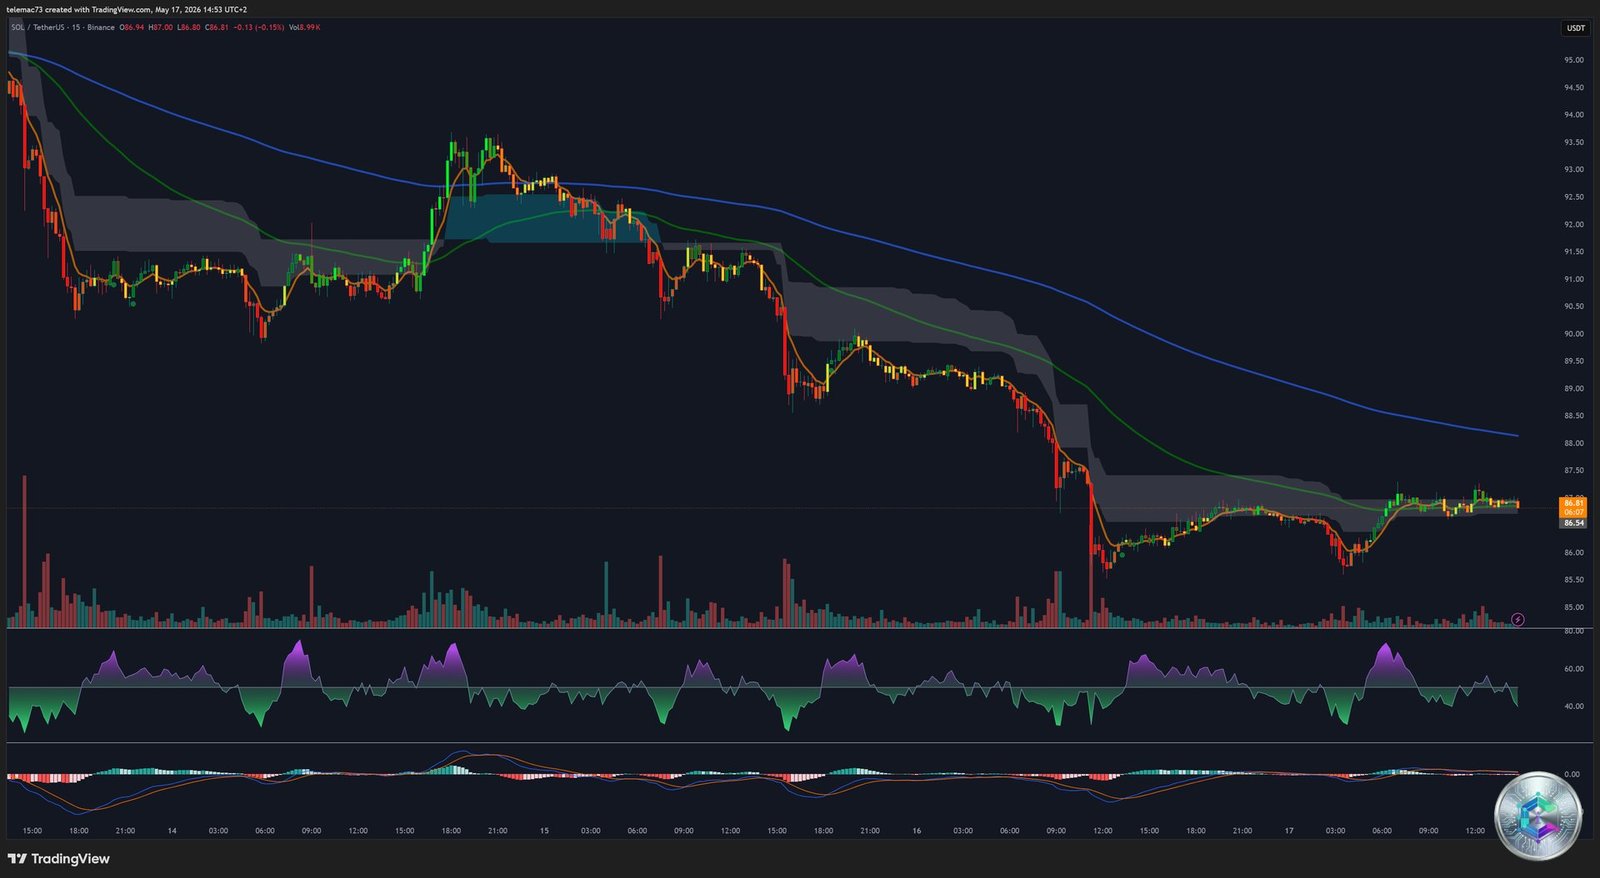
6. Intraday Micro-Structure: The 15-Minute (15m) Chart
The 15-minute chart reveals the algorithmic war waged by market makers and HFT robots. It depicts an initial cascading drop, followed by a classic bear flag consolidation, then another impulsive leg down, and finally a chaotic lateral drift. Price action is trapped within a strictly defined value area: the Value Area Low (VAL) at $86.55 and the Value Area High (VAH) at $89.98. The $86.75 level has become a critical intraday rejection point.
If buyers aggressively defend the $85.60–$86.50 zone, an impulse toward the upper range ($88–$90) can be initiated. A failure at this level would precipitate a liquidity hunt toward $83–$84.
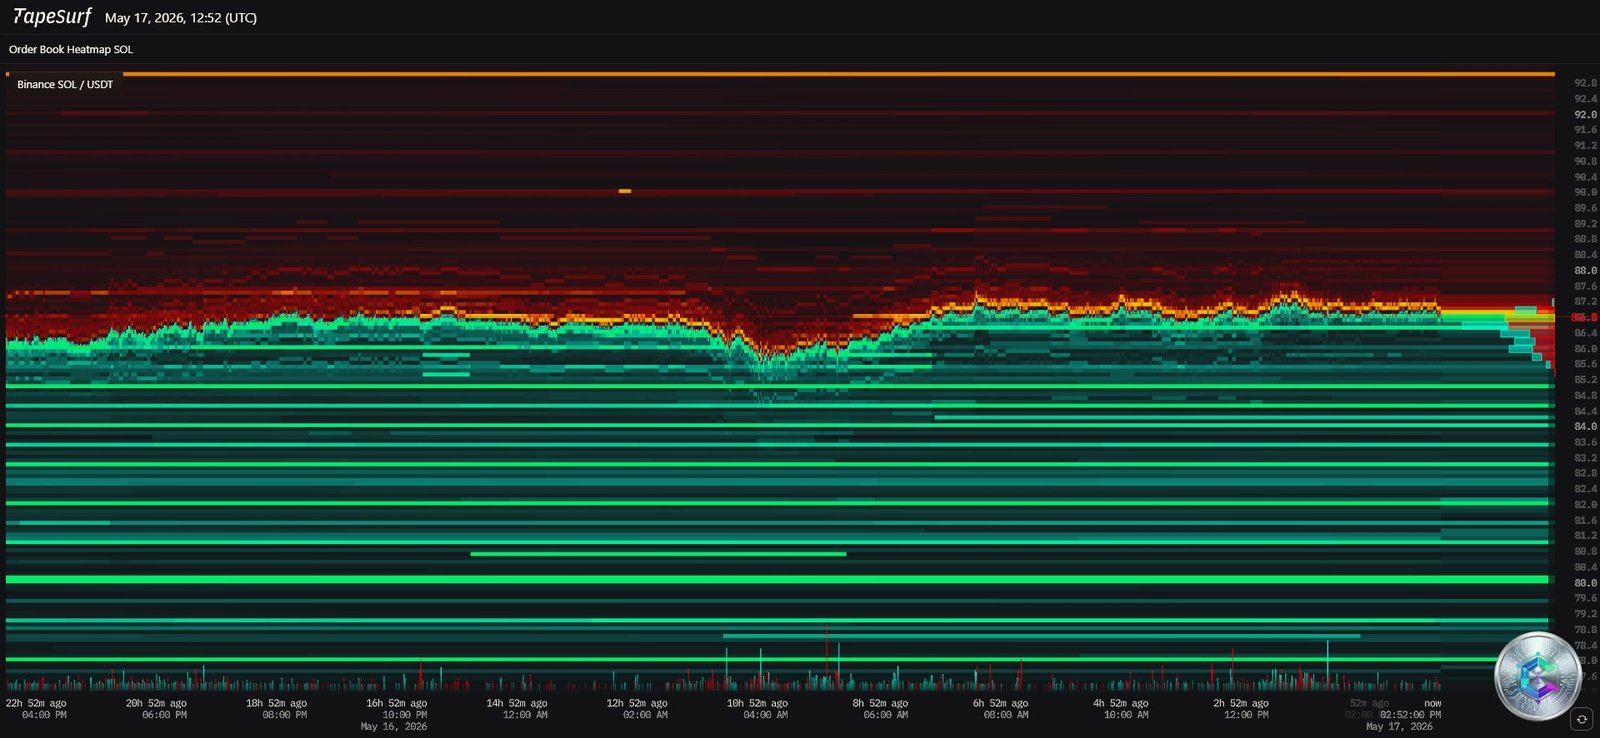
7. Order Book Physics: Liquidation Heatmap
Beyond geometric chart patterns, crypto market financial architecture in 2026 is governed by perpetual futures dynamics. The TapeSurf Liquidation Heatmap reveals a fascinating asymmetric liquidity topography: an extraordinarily dense band of red and orange lines accumulates above current price, thickening considerably in the $92–$98 zone.
For predatory algorithms, this concentration is not an obstacle but a gravitational magnet: a push above $92 would trigger a cascade of forced short buybacks (short squeeze), providing the energy needed to propel price through the $98 ceiling toward the $107 zone. Conversely, a break below $81.30 would trigger a brutal long squeeze accelerating the descent toward $71.
8. Key Price Levels: Structured Summary
| Level Type | Price Zone (USD) | Technical Implication |
|---|---|---|
| 🎯 Macro Breakout Target | $107.00–$117.00 | Fibonacci extension post-confirmed bullish breakout |
| 🔴 Major Resistance (Ceiling) | $97.50–$98.00 | Daily structural ceiling. Historic rejection. « Sell Power: 61/67 » |
| 🔴 Local Resistance | $96.00 | Recent high that invalidated the direct impulsive scenario |
| ⚪ Intraday Pivot Zone | $88.00–$90.00 | Psychological equilibrium line and Value Area High (VAH) |
| 🟡 Intraday Support | $84.72–$86.55 | Value Area Low (VAL). First algorithmic line of defense |
| 🟢 Critical Structural Support | $81.30 | Bullish structure invalidation threshold. Massive « Buy Power » |
| 🟢 Macro Floors | $71.92–$78.17 | Deep Fibonacci retracements. Last bulwarks against prolonged bear market |
9. Quantitative Projections and AI Modeling
At short-term horizon (30 days), CoinCodex’s algorithmic cyclical model generates a target of $104.73 for SOL (~21% upside), within a projected range of $87.41–$132.45 for 2026. The Grok AI model proposes a base case between $100 and $200 by end of 2027. The extreme bull case, converged by both Grok and Gemini, projects a parabolic trajectory toward $500 — representing a potential return of ~475% from the May 2026 base. This modeling hinges on two axioms: the maintenance of the global crypto bullish structure and the continued flow of institutional capital (ETFs + B2B payments) toward the Solana settlement layer.
Conclusion: A Valuation Paradox on the Edge of Explosion
The holistic analysis of Solana in May 2026 reveals a valuation paradox characteristic of technologically disruptive markets: price action is decorrelated from the overwhelming reality of network expansion. The Alpenglow architecture definitively resolves the blockchain trilemma. Western Union’s USDPT stablecoin and Goldman Sachs’s $108M in SOL ETFs demonstrate that institutional hyper-adoption is structurally engaged.
The market stands in a state of precarious equilibrium — a perfect kinetic suspension where macro bears confront institutional bulls. The daily MACD Golden Cross, combined with an RSI purged of all speculative excess, tips the probability matrix decisively in favor of an impulsive bullish resolution. This resolution is formally conditioned on the unwavering defense of the critical $81.30 support. If this bastion holds, the triggering of short liquidations above $92 will provide the rocket fuel needed to annihilate the $98 ceiling and immediately open the path to $107–$132 targets.
⚠️ Disclaimer: This article is written for educational and informational purposes only. It does not constitute investment advice, a recommendation to buy or sell cryptocurrencies, or a financial solicitation. Crypto markets are extremely volatile and carry a high risk of capital loss. Always conduct your own research (DYOR — Do Your Own Research) before making any investment decision.