
The digital asset market — and Ethereum (ETH) in particular — stands at a crossroads as we enter the second quarter of 2026. While the ecosystem celebrates major technological advances and unprecedented institutional adoption, price action reflects a complex tension between expanding fundamentals and a technical structure struggling to break free from persistent bearish pressure. This analysis dissects the multiple layers of the Ethereum ecosystem drawing on multi-dimensional chart data, real-time order book indicators, and a macroeconomic backdrop marked by intense geopolitical volatility.
Macroeconomic Context & Network Fundamentals
As of April 17, 2026, the global macroeconomic environment is exerting a dominant influence on risk assets. The closure of the Strait of Hormuz — now entering its seventh consecutive week — has kept Brent crude near $98 USD, fueling extreme fear sentiment across markets with the Fear & Greed Index oscillating between 9 and 21. In this climate, investors favor caution, driving a selective dynamic within digital assets where Bitcoin maintains relative dominance while Ethereum appears to lag.
Yet the contrast with actual network activity is striking. Q1 2026 was the most active quarter in the protocol’s history, with over 200.4 million transactions processed on the base layer — a U-shaped recovery from the 2023 lows. This usage explosion is primarily driven by Layer 2 solutions and stablecoin settlement.
Charles Schwab’s announcement to launch spot Bitcoin and Ethereum trading for retail clients represents a major institutional pivot. With over $8 trillion in client assets, this integration into traditional brokerage platforms marks a crucial step toward mainstream adoption of the asset.
| Fundamental Indicator | Value (April 17, 2026) | Market Implication |
|---|---|---|
| Q1 2026 Transactions | 200.4 million (All-time record) | Extreme network vitality |
| Fear & Greed Index | 21 (Extreme Fear) | Broad risk aversion |
| Staking Rate | ~30% of total supply | Reduced circulating liquidity |
| Schwab AUM | $8T+ | Massive adoption potential |
| Spot ETF Volume (24h) | $26.07B | High institutional liquidity |
Technical Analysis – Daily Timeframe
The daily chart reveals a complex price structure characterized by a underlying bearish trend that began after the August 2025 peak at $4,957. Ethereum’s current price, hovering around $2,330–$2,380, sits in a critical consolidation phase following a sharp drop that saw the asset bottom at $1,970 in February 2026.
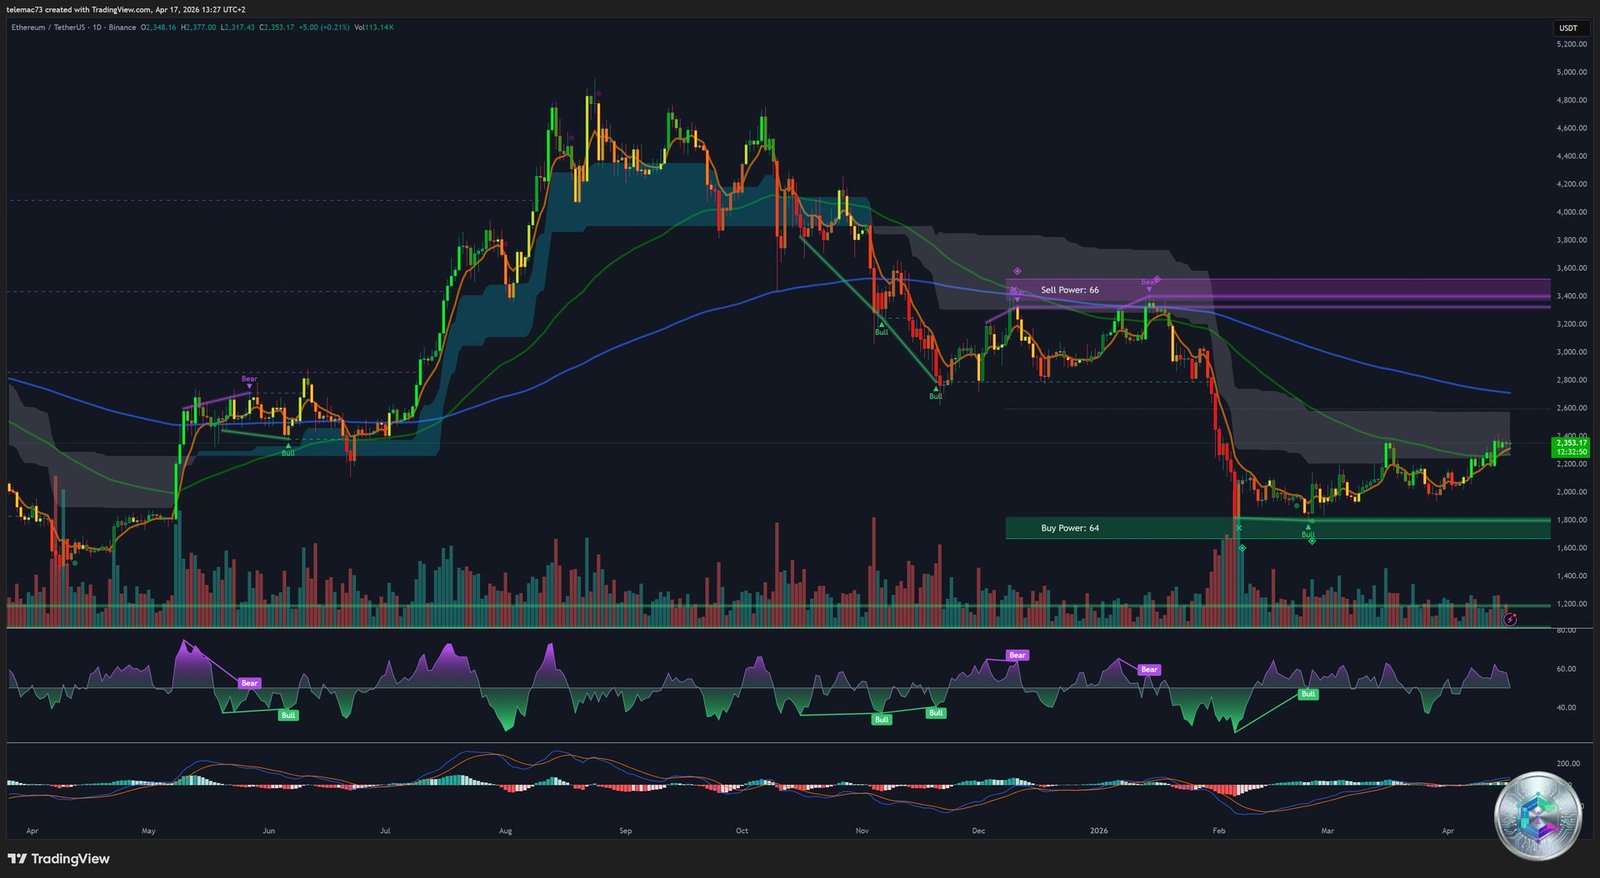
Moving Averages: A Troubling Death Cross
The moving average configuration calls for vigilance. The 50-day MA is currently sloping downward, potentially providing dynamic support on a future test while highlighting weak medium-term momentum. More concerning, a Death Cross structure is identifiable — the MA50 trading very close to the MA200, reflecting sustained bearish pressure. The MA200, in a downtrend since March 17, 2026, acts as a major psychological and technical resistance above the current price. The inability to close sustainably above this average confirms that sellers maintain control of the macro structure.
RSI & MACD: Bearish Momentum with Histogram Compression
The 14-period RSI sits at 39.07 — a neutral zone with bearish bias, approaching oversold conditions without fully reaching them. A bearish divergence over the past 14 candles signals caution for any immediate rebound attempt.
The MACD trades below the signal line with a negative histogram. However, a notable histogram compression is observed, suggesting selling pressure may be beginning to fade — potentially setting the stage for a bullish crossover should current supports hold.
Chart Patterns: The Bear Flag in Focus
The Bear Flag Pattern
A particularly clear Bear Flag has formed following the breakdown of the key $3,000 support level. The structure consists of a flagpole (sharp price drop) followed by an ascending consolidation channel with declining volume:
- The Flagpole: The violent early-2026 selloff triggered by liquidity shocks and regulatory uncertainty.
- The Flag: The current consolidation phase where price drifts sideways or slightly upward on declining volume.
- The Projected Target: A break below the channel floor (~$2,150) would project a measured move to $1,850.
| Technical Level | Type | Price (USD) | Significance |
|---|---|---|---|
| Major Resistance | Supply Zone | 3,400 | Heavy sell-side presence (Daily) |
| Local Resistance | Horizontal | 2,539 | Recent high-volume rejection |
| Current Pivot | Psychological | 2,300–2,350 | Short-term battleground |
| Immediate Support | Structural | 2,150 | Defended multiple times in April |
| Major Support | Buy Power | 1,525 | Massive buy zone (4H) |
4-Hour Analysis: Microstructure & Reversal Signals
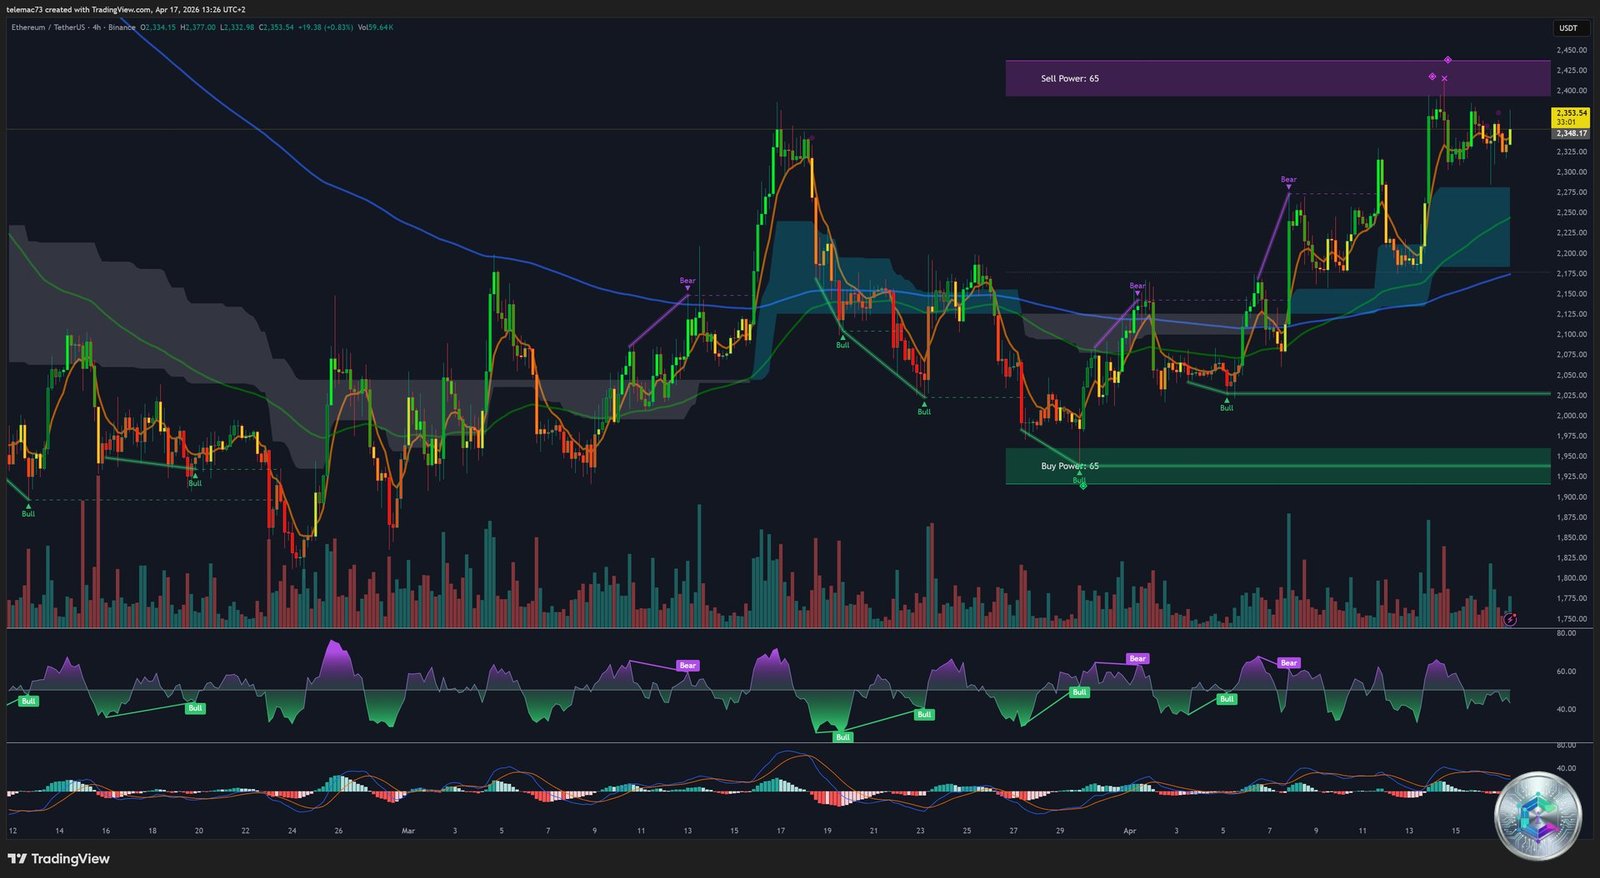
The 4-hour chart provides a more dynamic view of the buyer/seller struggle. Unlike the daily timeframe, this timeframe shows signs of potential technical recovery. A bullish RSI divergence has been detected — often a precursor to a short-term trend reversal.
Price recently bounced off the $2,397 support, sweeping liquidity below that level before attempting to test the $2,500 resistance. The MA200 on this timeframe has been sloping upward since April 11, 2026, indicating the underlying medium-term trend remains technically bullish despite daily turbulence. A Golden Cross could materialize if ETH establishes itself durably above $2,450.
CME Gaps to Watch
- Gap 1 – $2,250: Nearly filled, acting as a short-term magnet.
- Gap 2 – $2,600: Potential target on confirmed bounce.
- Gap 3 – $3,200: Long-term objective for 2026.
A bullish Fair Value Gap (FVG) on the 4H chart supports the thesis of a technical bounce toward $2,539 as long as the $2,397 support holds.
Intraday Analysis (15-Minute) & Liquidity Heatmap
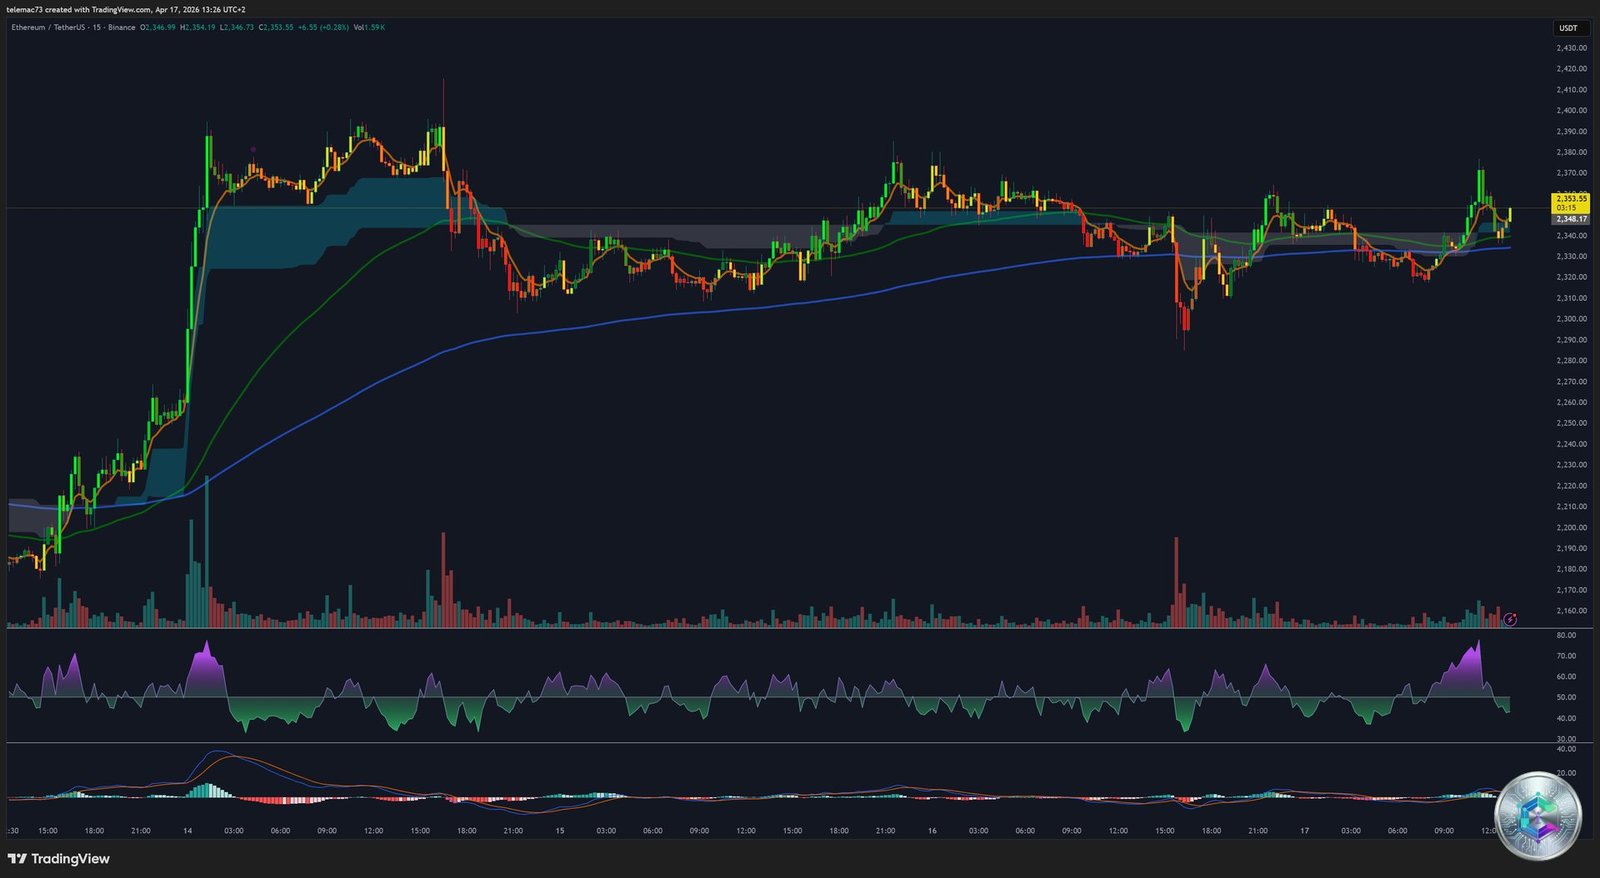
The 15-minute timeframe shows tight consolidation. Price oscillates around a central average with volume spikes concentrated around macroeconomic announcements — notably the early-April NFP report which triggered extreme volatility.
TapeSurf Heatmap: Real Liquidity on Binance
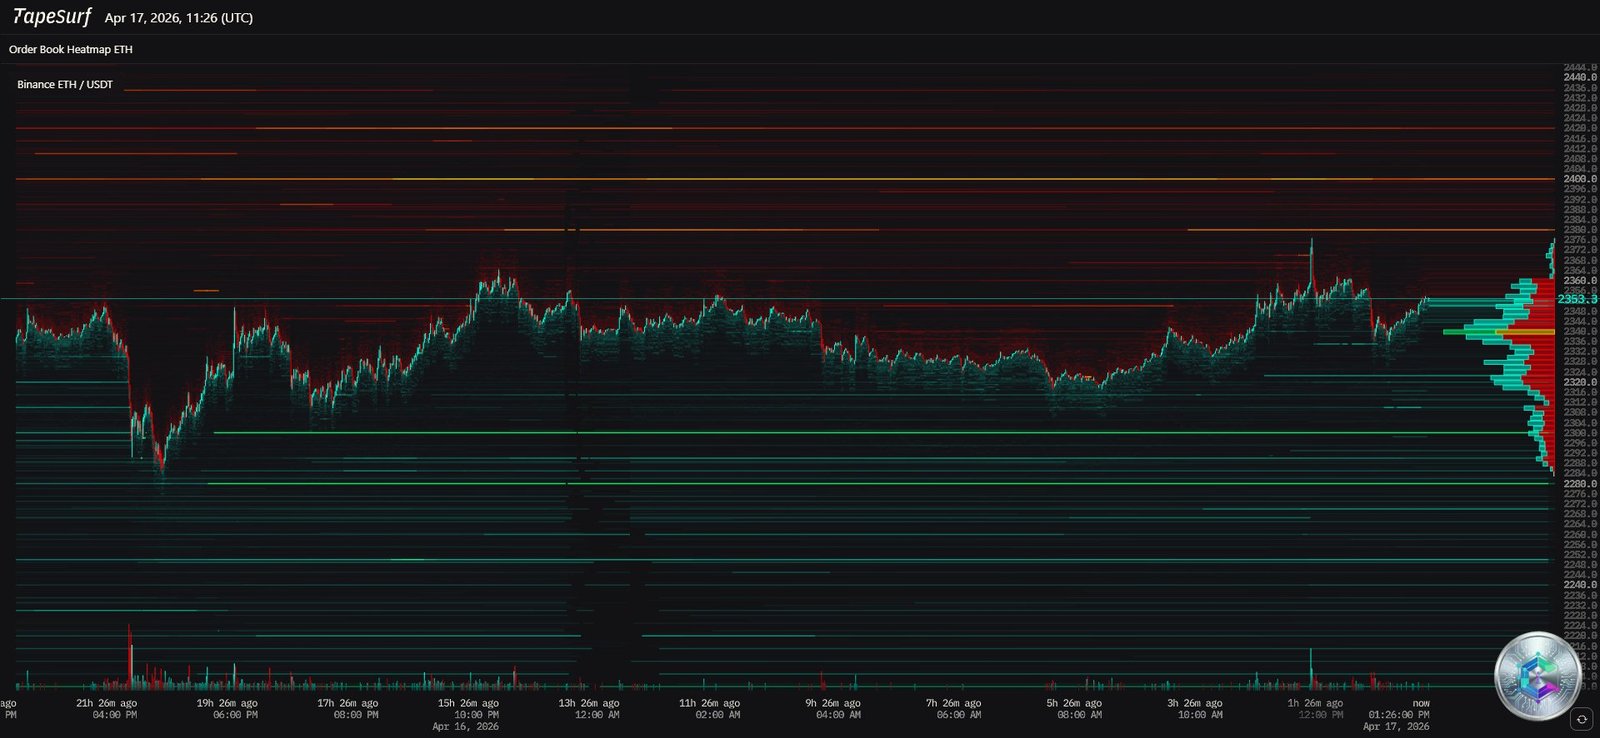
The TapeSurf Heatmap provides crucial insights into the real liquidity distribution on the exchange:
- Buy-side liquidity concentrated at $2,200–$2,300: Intense green horizontal bands signal massive limit orders. These levels act as a safety net, suggesting market makers are prepared to absorb selling pressure in this zone.
- Sell walls above $2,400: Dense orange and red lines at $2,450 and $2,500 indicate any rally will face significant selling pressure, requiring exceptional buying volume to breach these levels.
- Point of Control (POC) at $2,348: The volume profile confirms this level as the central pivot for April 17 — the daily barometer of market sentiment.
The 2026 Protocol Roadmap: Glamsterdam & Hegota
Beyond chart analysis, Ethereum’s protocol evolution in 2026 is a fundamental driver of long-term value. The shift to a bi-annual upgrade cycle enables more agile deployment of Ethereum Improvement Proposals (EIPs).
Glamsterdam – H1 2026
Glamsterdam focuses on base layer capacity optimization, targeting a gas limit increase toward 100 million per block. Key innovations include:
- ePBS (Enshrined Proposer-Builder Separation): Formalizes the separation between block proposers and builders, reducing MEV-related centralization risks.
- Multidimensional gas pricing: Separate cost management for computation, storage, and data (blobs) — stabilizing fees for Layer 2 networks.
Hegota – H2 2026
Hegota will complete EIP-8141, introducing native account abstraction. In practice, this will give users smart wallets with capabilities such as gas fee payment in any token, social account recovery, and biometric signing. Hegota will also integrate post-quantum security mechanisms for validator block signatures.
On-Chain Dynamics & Supply Metrics
On-chain data reveals a structural shift in Ether holding patterns. Approximately 30% of total supply is currently staked, reducing immediate sell-side pressure on exchanges. Long-term holders (LTH) continue to accumulate, with roughly 65% of total supply in profit despite the price stagnation.
The emergence of artificial intelligence as a complementary sector is also a supportive factor. The new ERC-8004 standard facilitates interaction between Ethereum smart contracts and AI applications, creating new use cases for ETH as a settlement layer for autonomous agents.
Synthesis: Three Scenarios for End of Q2 2026
🟢 Bullish Scenario – 200-MA Breakout
To invalidate the Bear Flag structure, Ethereum must close a weekly candle above $2,539 on significant volume. Such a move would open the path to $2,800, then the CME gap at $3,200. This scenario would be supported by geopolitical de-escalation and continued spot ETF adoption by giants like BlackRock, which already manages over $12 billion in tokenized assets on the network.
🔴 Bearish Scenario – Capitulation toward $1,850
If the $2,150 support breaks, the bear flag will be confirmed, triggering panic selling from short-term holders. The technical target would sit in the $1,850–$1,900 zone, corresponding to historical support levels from 2023. This move would flush out weak hands ahead of the Hegota upgrade.
🟡 Consolidation Scenario – Range $2,150–$2,450
This is the most probable short-term scenario given the extreme fear reading. Price oscillates between the Buy Power zone at $1,525 and the Sell Power zone at $2,425, awaiting a clear directional catalyst. The central pivot at $2,340 will serve as the daily barometer of market sentiment.
Conclusion
Ethereum in April 2026 presents a fascinating paradox: technology at peak form, backed by world-class institutional infrastructure, yet its price remains constrained by a bearish chart structure and an unstable macroeconomic environment. For professional traders and investors, monitoring the daily moving averages and liquidity zones identified on the Heatmap will be decisive in navigating this period of elevated volatility. Patience appears to be the cardinal virtue as the network prepares for its next great transformation with the Glamsterdam–Hegota upgrade cycle.
⚠️ Disclaimer: This article is written for educational and informational purposes only. It does not constitute investment advice or a recommendation to buy or sell any digital asset. Cryptocurrency markets are highly volatile and carry significant risk of capital loss. Past performance is not indicative of future results. Please consult a qualified financial advisor before making any investment decisions.