
The digital asset market has reached a paradigm-defining inflection point on April 24, 2026. Total market capitalization has stabilized at $2.68 trillion, confirming the asset class’s permanent integration into the architecture of the global economy. Yet this colossal valuation rests on psychologically fragile foundations: a 24-hour trading volume of $97.05 billion and a Fear & Greed Index deeply entrenched in « Fear » territory at 39/100.
I. The Macroeconomic Landscape: The Tether Systemic Shock
The primary catalyst for this pervasive market hesitation is a systemic shock of unprecedented magnitude. On April 24, 2026, Tether unilaterally froze $344 million in USDT on the Tron blockchain, citing connections to « illicit activity. » USDT underpins more than 60% of all cryptocurrency trading pairs, with a daily transactional velocity exceeding $50 billion. This unilateral action instantly shattered the illusion of permissionless, decentralized transaction settlement.
Despite this earthquake, the USDT peg to the US dollar remained remarkably resilient, demonstrating a microscopic variance of only ±0.01%. The damage is primarily psychological: confidence in centralized liquidity infrastructure has been fundamentally shaken.
Market Reaction and Capital Rotation
The ripple effects of the Tether freeze triggered immediate structural shifts in capital allocation. Ethereum fell 1.91% to $2,306.66, amplifying its vulnerability to DeFi liquidity shocks. Conversely, Monero (XMR) surged +3.30%, benefiting from a « privacy premium » among investors fleeing the censurability of centralized stablecoins. Meme coins like Dogecoin displayed localized resilience, highlighting that retail speculative capital continues seeking high-beta, narrative-driven trades despite macro conditions.
| Asset | Level (April 24, 2026) | Market Implication |
|---|---|---|
| Crypto Market Cap | $2.68 Trillion | Stable macro valuation, short-term illiquidity |
| Bitcoin (BTC) | $77,601 – $77,688 (Dom.: 58.10%) | Flight to quality; macro anchor of the cycle |
| Ethereum (ETH) | $2,306.66 (−1.91%) | High vulnerability to DeFi liquidity shocks |
| Tether (USDT) | $1.00 (Peg stability: ±0.01%) | Price stable, facing severe centralization backlash |
| Monero (XMR) | +3.30% (24h) | Privacy premium post-USDT freeze |
II. Institutional Capital: The Spot Bitcoin ETF Hegemony
While the broader ecosystem grapples with stablecoin systemic risk, Bitcoin’s price action is being heavily insulated by an unprecedented wave of institutional capital. Bitcoin commands a 58.10% market dominance — not merely a reflection of altcoin weakness, but the direct result of aggressive, programmatic accumulation by traditional finance (TradFi) entities.
Over a span of less than two weeks in mid-April, Spot Bitcoin ETFs logged extraordinary net inflows of $2.4 billion, with positive net flows recorded on 10 out of 11 consecutive trading days. This consistency reveals algorithmic, volume-weighted average price (VWAP) accumulation strategies deployed by major asset managers — systematic, price-agnostic buying regardless of short-term volatility.
Most critically: during the recent macro drawdown of 35% from cyclical highs, the traditional finance sector did not capitulate. ETF investors absorbed nearly $1 billion in fresh capital directly into a falling market — behavior industry analysts describe as institutional « diamond hands, » signifying a paradigm shift where volatility is used as a discount acquisition mechanism on a multi-year time horizon.
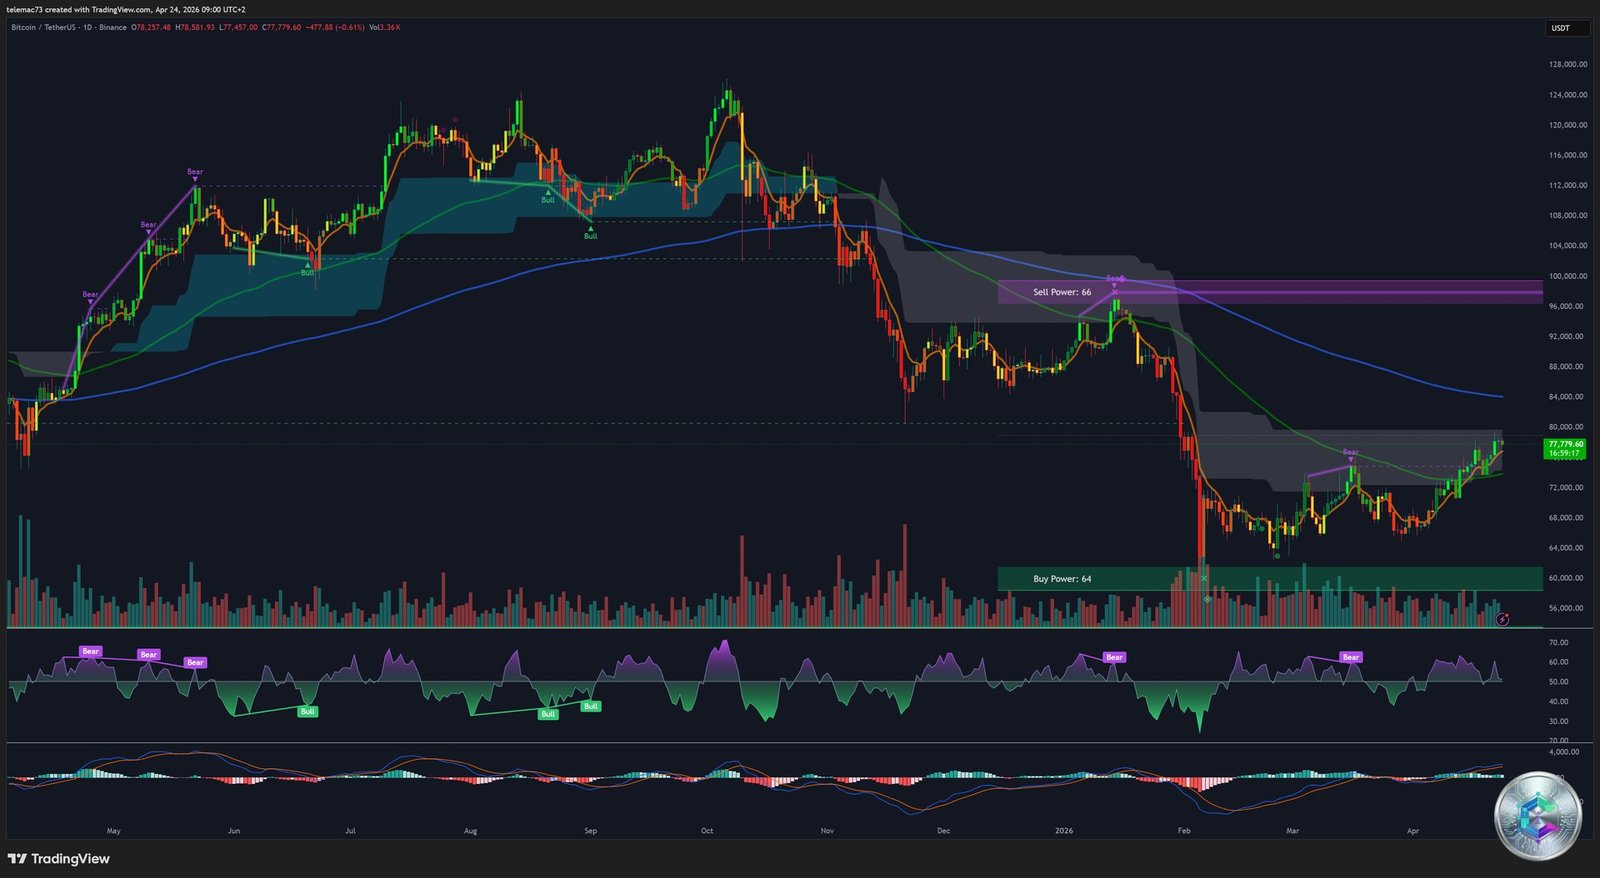
III. Daily Technical Analysis: The Bull Market Reset
The daily chart reveals the anatomy of a severe yet structurally necessary macro correction. Bitcoin had reached parabolic highs toward $126,000 before entering a protracted, multi-month descending channel. The subsequent pullback toward $60,000 constitutes a classic « bull market reset »: a healthy purge of excessive derivative over-leverage, a consolidation of long-term moving averages, and a rotation of liquid supply from short-term speculative traders to long-term institutional allocators.
As of April 24, Bitcoin trades at $77,779.60, precisely in the equilibrium zone between two massive magnetic poles:
- Institutional macro floor (Buy Power: 64): anchored firmly around $60,000, the exact region where $1 billion in ETF capital was deployed during the 35% drawdown.
- Overhead supply zone (Sell Power: 66): clustered between $96,000 and $100,000, representing trapped retail positions from the cycle top and institutional automated profit-taking mechanisms.
The ongoing breach of a dynamic descending trendline on the daily chart suggests the multi-month consolidation phase is reaching its terminal apex, setting the stage for a significant volatility expansion.
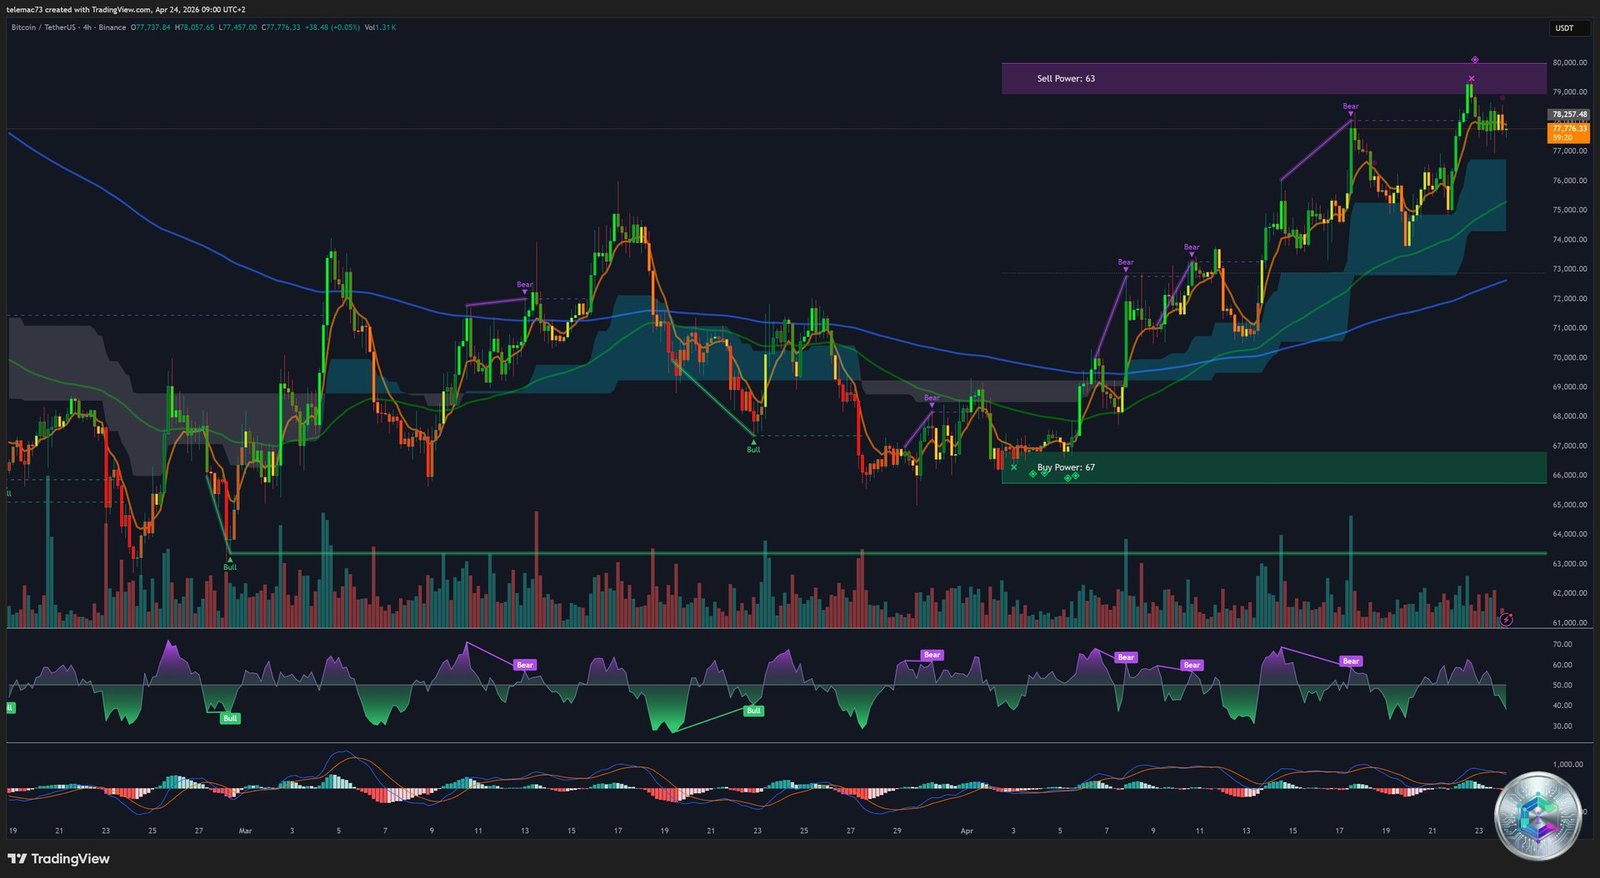
IV. 4-Hour Technical Analysis: The Algorithmic Battlefield
The 4-hour chart is the primary battleground for algorithmic trading bots and swing traders. After spending considerable time suppressed below a dynamic cloud structure — analogous to an Ichimoku Kinko Hyo ribbon — price action has violently pierced upward, flipping this dynamic resistance into dynamic support. Current candles are consolidating comfortably above this green cloud structure, signaling that the path of least resistance on the intermediate timeframe has shifted decisively bullish.
Key zones identified on this timeframe:
- Near-term resistance (Sell Power: 63): A distinct purple rectangular overlay marks the immediate ceiling just below the $80,000 psychological threshold, representing the order book friction preventing an uninhibited run toward macro highs.
- Intermediate support (Buy Power: 67): A heavy green overlay clustered between $66,000 and $68,000 — the first algorithmic safety net before the macro $60,000 floor is tested.
Momentum oscillators on this timeframe display a textbook configuration: a bullish divergence formed at the local bottom (price making lower lows while oscillators made higher lows), followed by explicit « Bull » signal vectors. Currently, indicators are resetting near the neutral baseline, digesting the thrust toward $77,700 without entering overbought territory — signaling sufficient thermodynamic energy to sustain an assault on the $80,000 resistance zone.
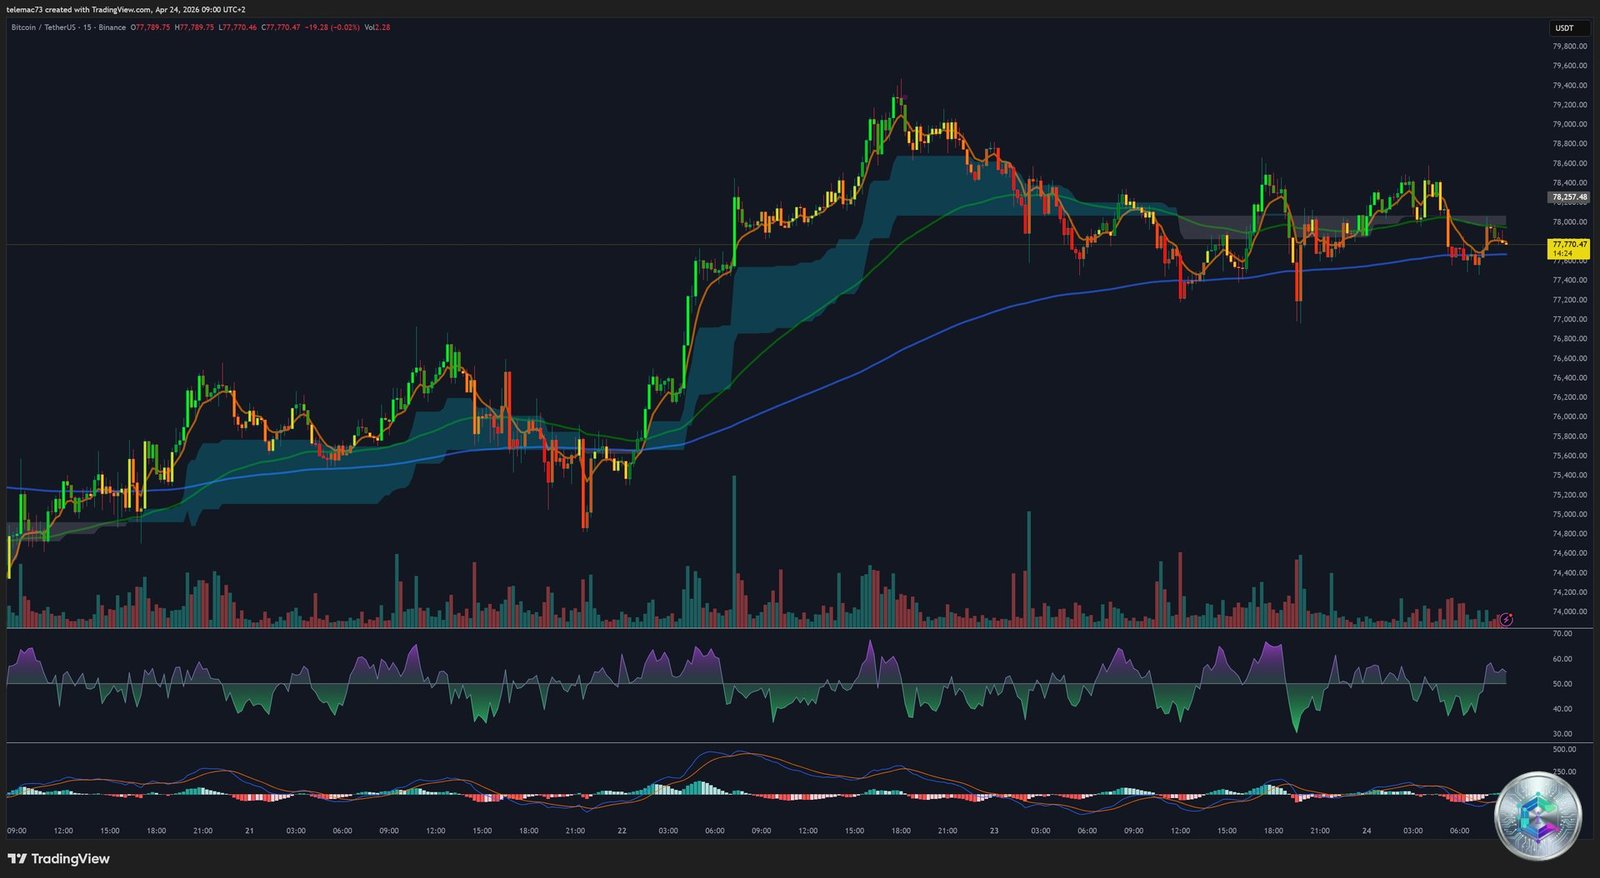
V. Intraday Microstructure: The 15-Minute Chart
The 15-minute chart strips away macro noise to reveal the precise execution logic of high-frequency trading (HFT) algorithms. Price action is characterized by a « stair-step » ascension — rapid, vertical expansion candles followed by extended periods of sideways, low-volatility consolidation. This pattern is indicative of institutional « Iceberg » orders: breaking up massive market-buy positions into thousands of smaller transactions to prevent excessive price slippage and conceal directional intent.
The intraday price sits at $77,770.47, riding the upper boundary of a tight, responsive moving average ribbon. Brief incursions into the core of this ribbon are immediately met with long lower wicks — algorithmic buyers positioned at these micro-support levels. The volume profile confirms the legitimacy of these moves: the highest volume nodes correlate exactly with breakout candles that pushed price above local resistance levels, indicating genuine market participation rather than low-volume spoofing.
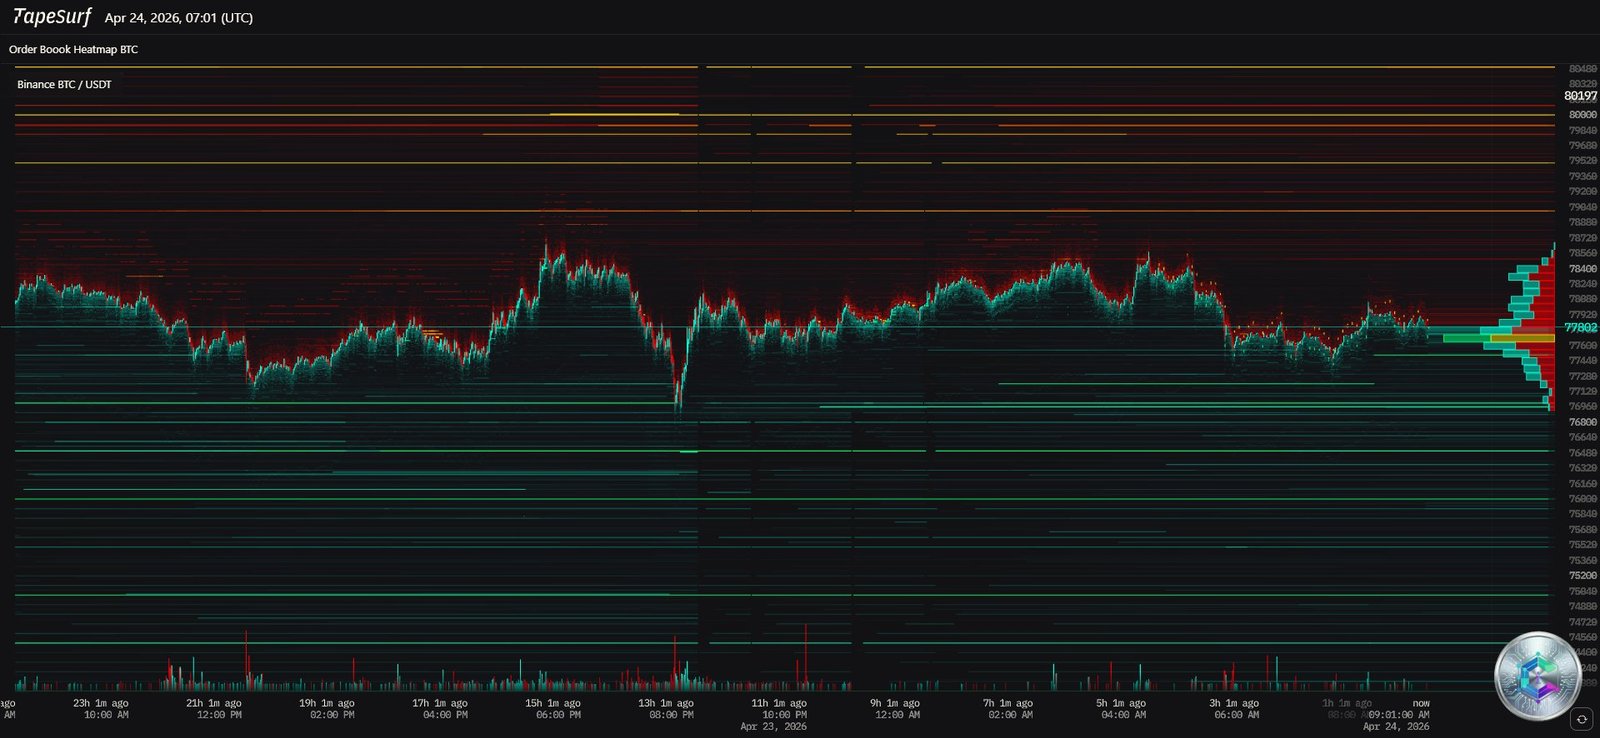
VI. Order Book Microstructure: The TapeSurf Heatmap
The TapeSurf Order Book Heatmap for the Binance BTC/USDT pair — captured on April 24, 2026 at 07:01 UTC with price at $77,902 — provides an X-ray view of the unexecuted liquidity architecture. Limit orders are visualized as horizontal color bands, where intensity transitions from cool greens to hot reds and yellows represent the density of capital parked at each price coordinate.
The $80,000 Supply Wall: The most dominant feature is the massive cluster of thick red and yellow horizontal bands stacked precisely at and above the $80,000 level. This immense wall of sell limit orders perfectly corroborates the « Sell Power: 63 » zone identified on the 4H chart. HFT firms and institutional swing traders have parked billions of dollars of theoretical supply at this psychological threshold — for Bitcoin to continue its macro ascension, it must generate sufficient aggressive market-buy volume to chew through this dense liquidity barrier.
The Graduated Support Matrix: Below the current price, the heatmap displays a completely different structural morphology: not a single concentrated wall, but a series of graduated green bands stretching downward through $76,000, $75,000, and heavily clustering near the $74,000 mark. This diffuse support distribution contrasts sharply with the dense overhead resistance, creating a liquidity asymmetry favorable to buyers on any pullback.
The principle of « liquidity magnetism » implies the price will naturally drift upward to test the $80,000 wall. Upon contact, two scenarios unfold: absorption and breakout — institutional ETF inflows aggressively market-buy into the sell wall, absorbing the supply and triggering a violent low-friction spike upward — or rejection and mean revisitation — the wall absorbs all buying pressure, HFT algorithms cancel their supporting bids below, and price rapidly reverts toward the $75,000–$74,000 green support bands.
VII. Synthesis and Strategic Outlook
As of April 24, 2026, the BTC/USDT market is a complex mechanism operating under immense opposing pressures. On a macro level, the ecosystem is absorbing a profound systemic stress test: Tether’s unilateral freeze of $344 million has exposed the severe centralization risks inherent in fiat-backed stablecoin infrastructure, generating a pervasive undercurrent of « Fear » (index: 39) and driving capital toward privacy-preserving assets like Monero.
Simultaneously, the core asset — Bitcoin — remains remarkably insulated from this shock. Buoyed by relentless, price-agnostic ETF inflows ($2.4 billion in recent weeks), Bitcoin has successfully navigated a 12% macro pullback toward the $60,000 foundational support. This « bull market reset » has flushed excess leverage from the system and transferred supply into institutional « diamond hands, » establishing a robust accumulation floor.
Technically, the market is coiled like a spring under high tension. Price oscillates near $77,700, riding dynamic algorithmic support on the 4H and 15-minute timeframes. The TapeSurf heatmap reveals a monolithic supply wall at $80,000, trapping the market in a high-tension compression zone between the gravitational pull of institutional accumulation below and a hardened ceiling of historical supply above. The resolution of this technical compression at the $80,000 level will likely dictate the macroeconomic trajectory of the entire digital asset space for the remainder of the 2026 calendar year.
⚠️ Disclaimer: This article is written for educational and informational purposes only. It does not constitute investment advice, a recommendation to buy or sell any crypto asset, or an inducement to carry out any financial transaction whatsoever. Cryptocurrency markets are highly volatile and carry significant risk of capital loss. Always conduct your own research (DYOR) and consult a qualified financial advisor before making any investment decision.