
Bitcoin stands at a strategic crossroads on April 1, 2026. Trading around $68,642 — a modest +0.69% gain over 24 hours — BTC navigates a tense macroeconomic landscape defined by geopolitical headwinds and restrictive Fed policy, yet supported by historically robust structural fundamentals. Here is a comprehensive professional-grade analysis.
Market Context: A 47% Pullback from the Peak
After reaching an all-time high of $126,073 in October 2025, Bitcoin has undergone a steep 47% correction — shifting market sentiment from exuberant price discovery to disciplined structural valuation. The current environment is shaped by « macro jitters »: the ongoing Middle East conflict with Iran and a Federal Reserve holding rates between 3.50% and 3.75%, with stubborn inflation expectations at 2.7%.
Multi-Timeframe Technical Analysis
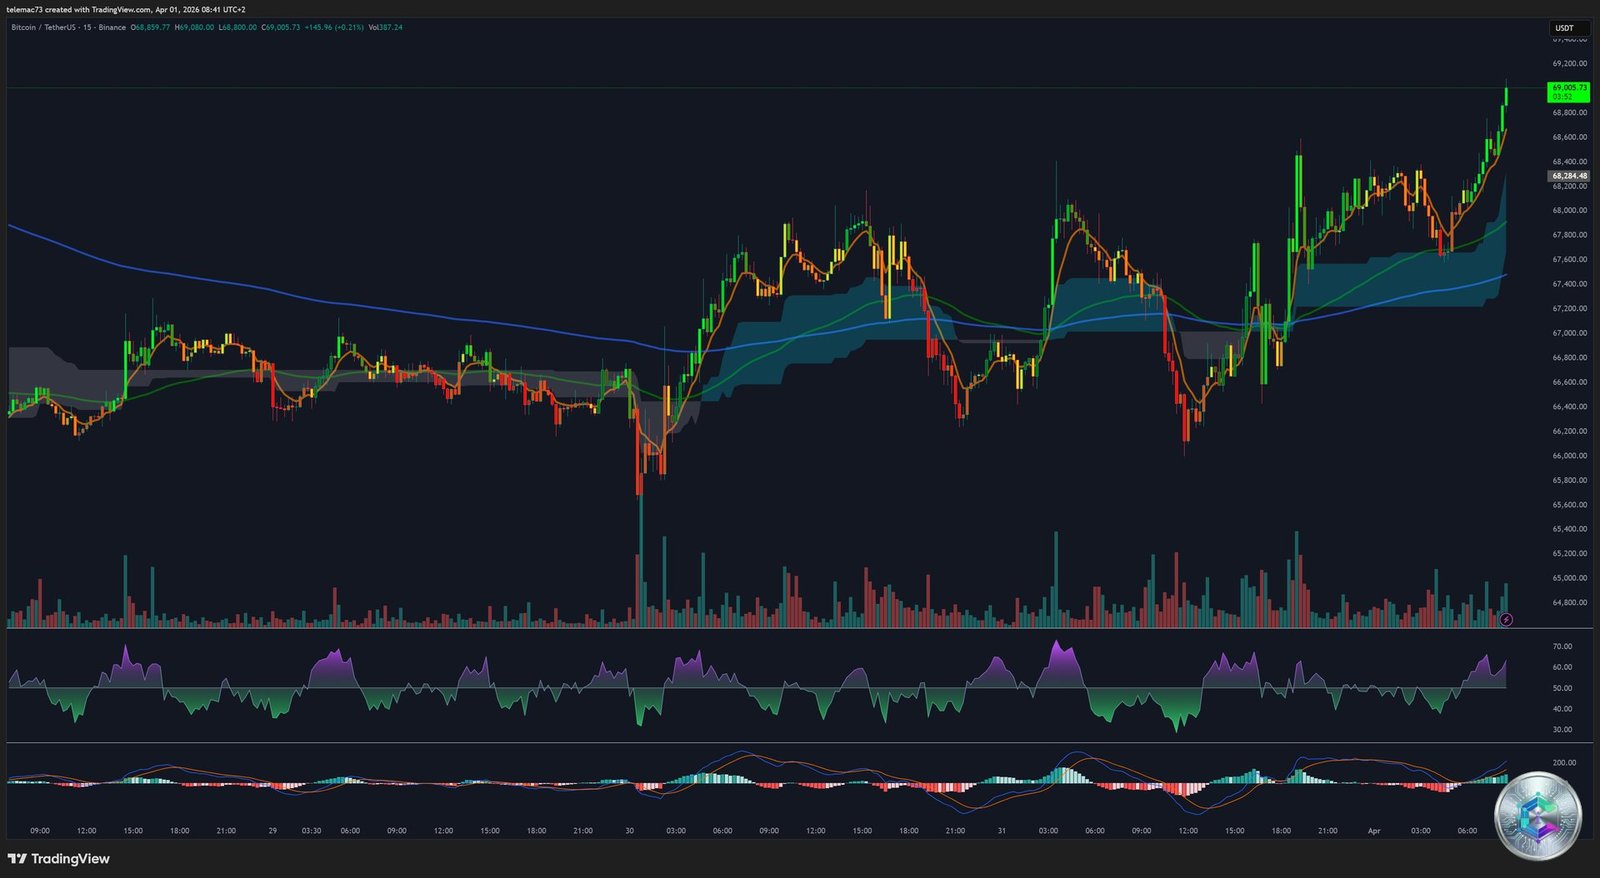
🔬 15-Minute Micro-Structure: Liquidity Hunting
On the 15-minute chart, Bitcoin exhibits classic liquidity hunting patterns driven by HFT algorithms. Immediate support clusters between $68,014 and $68,306, zones showing consistent buying interest during London and New York sessions. The $68,500 psychological level acts as first resistance, with notable indecision building ahead of the April 3 NFP report.
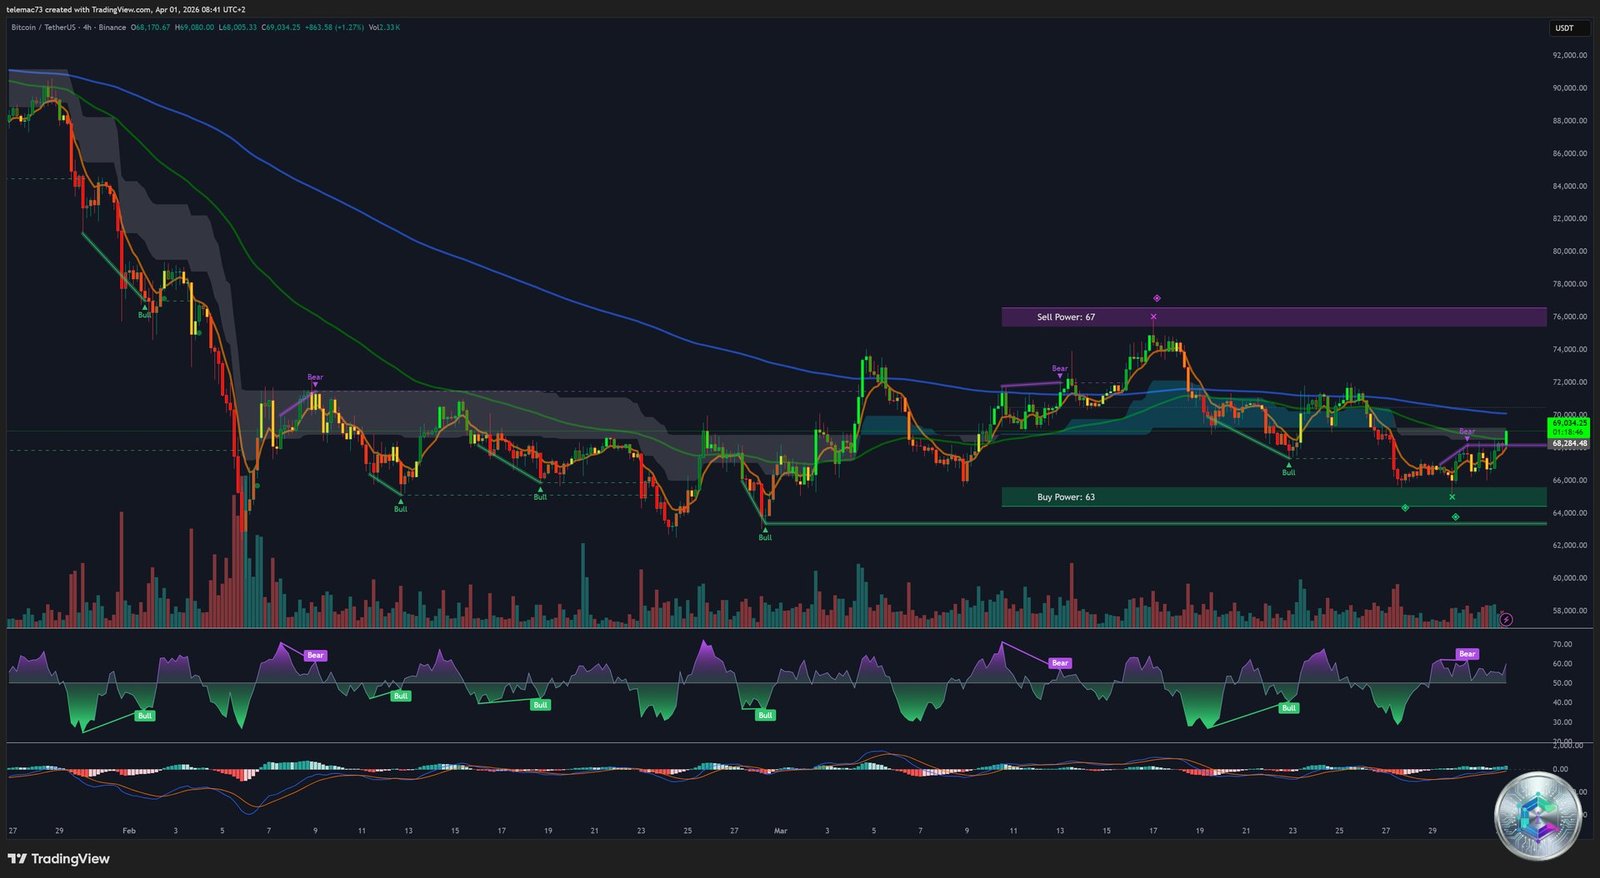
📊 4-Hour Chart: Momentum and Divergences
The 4-hour chart offers a more nuanced perspective. The 50 and 200-period moving averages show a bullish alignment — contrasting with the more bearish daily structure — suggesting short-term technical rebound potential within a larger correction. The 4H RSI sits in neutral territory moving toward the upper bound, while the 4H MACD signal line convergence indicates fading bearish momentum.
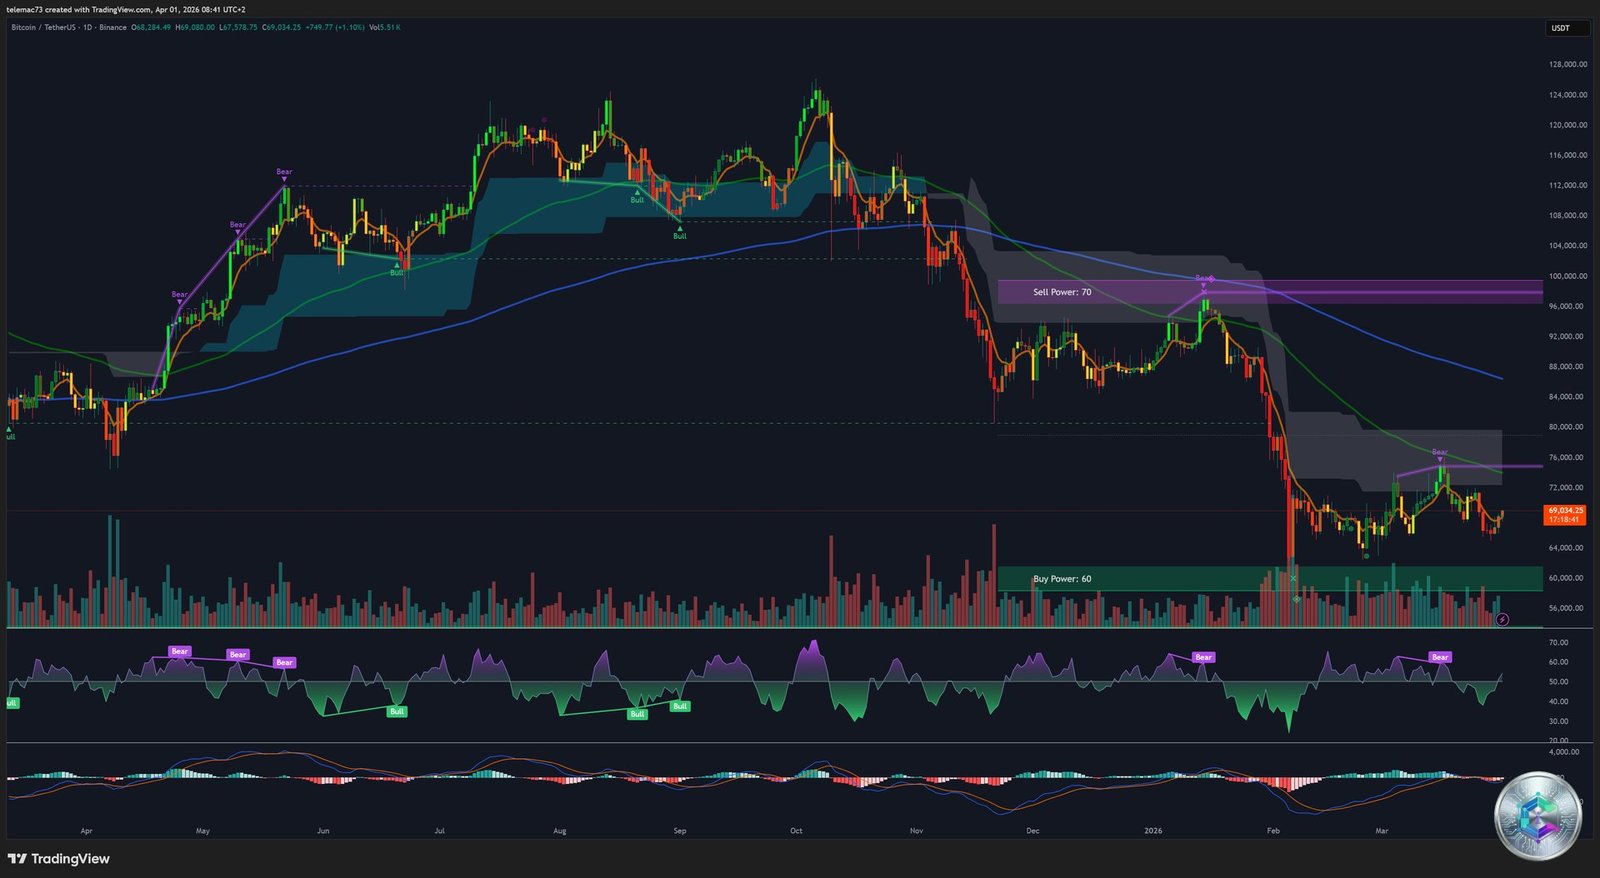
📅 Daily Chart: Long-Term Structure
Bitcoin trades above its 7-day ($70,005), 20-day ($70,275), and 50-day ($68,973) SMAs — cautiously constructive signals. However, the 200-day SMA at $91,991 with its descending slope since late February confirms the primary trend remains corrective. A Golden Cross is unlikely near-term; the 50-day SMA at $72,133 acts as formidable dynamic resistance.
Key Indicators Dashboard
| Indicator | Value (April 2026) | Interpretation |
|---|---|---|
| Daily RSI | 52.57 – 54.52 | ⚖️ Neutral — Upside potential intact |
| MACD Histogram | ~0.0000 | 🔄 Indecision — Bearish momentum fading |
| 50-day SMA | $68,973 – $72,133 | ⚡ Dynamic support/resistance |
| 200-day SMA | $91,991 | 🚧 Major long-term resistance |
| Bollinger Bands | Position 0.63 | 📈 Room to test upper band at $74,482 |
| Daily ATR | $2,526 | 💤 Moderate volatility — consolidation |
Chart Patterns
🚩 Bull Flag Formation
The most prominent pattern is a developing bull flag — a strong mast followed by a shallow descending consolidation on reduced volume. 2026 quantitative studies show a 68–73% success rate in high-liquidity markets. A decisive breakout above $73,175 would target the $80,000 – $85,000 zone.
📐 Symmetrical Triangle
Bitcoin is also forming a symmetrical compression triangle on some timeframes. A bullish breakout confirmed by a daily close above $90,000 would trigger a theoretical move toward $94,000 – $106,000.
🌊 Elliott Waves: A-B-C Correction
Elliott Wave theory frames the 2025–2026 action as an A-B-C three-wave correction following the five-wave impulse from $16.5K to $126K. Wave C could still drag price to $53,000 – $58,000 before the next impulsive cycle begins, potentially by mid-2026.
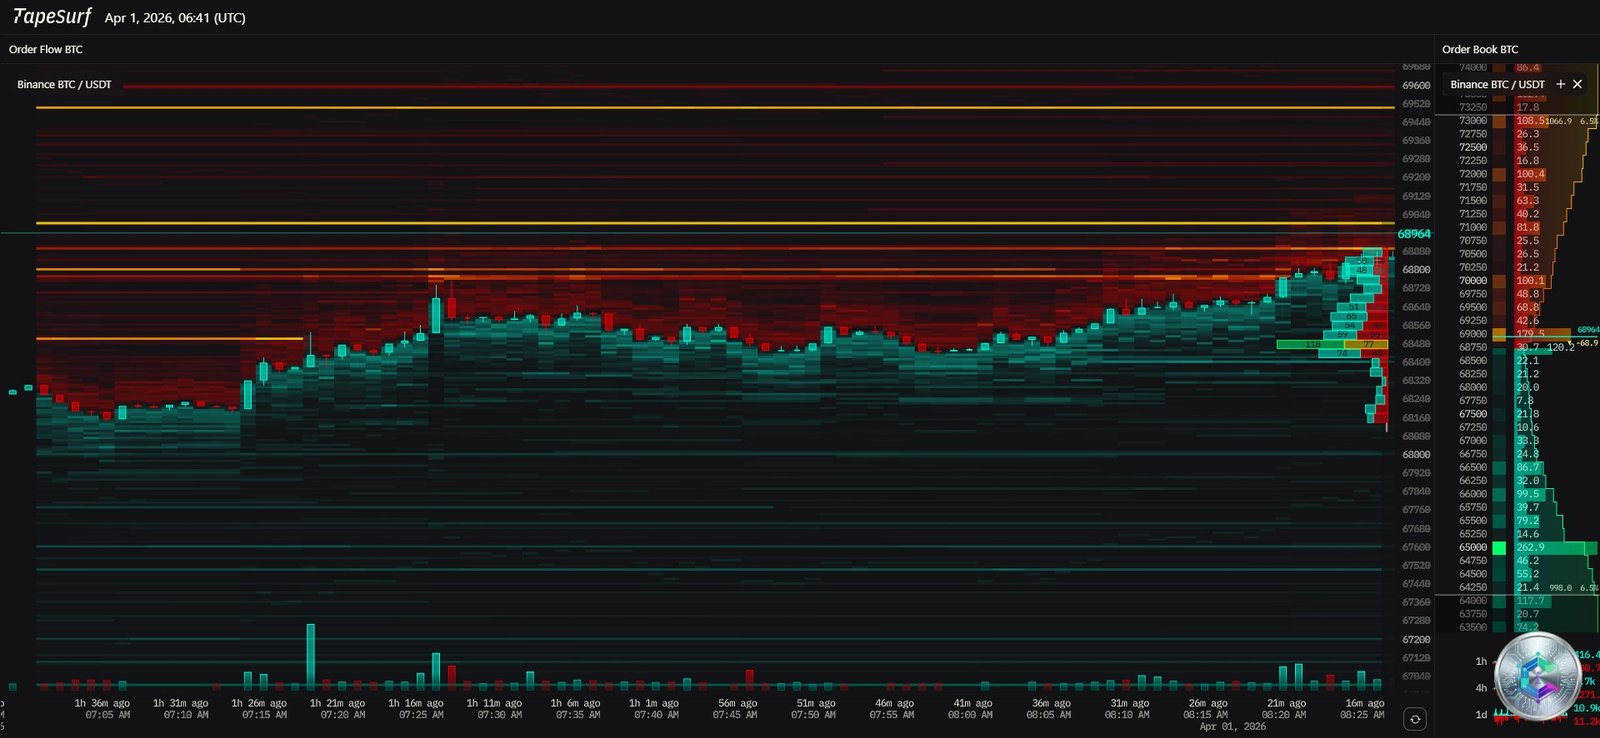
Order Book Heatmap
Heavy supply above, layered bids below:
- 🔴 Massive sell wall: $72,300 – $72,600
- 🟢 Immediate bids: ~$69,200
- 🟢 Solid support: $68,200 – $68,500
- 🟢 Deep liquidity pools: $67,000 – $67,500
Traders are watching for a potential liquidity sweep toward $67,000 that could fuel a subsequent break of the $72,000 resistance cluster.
Fundamentals: The Institutional Era
🏛️ GENIUS Act & US Strategic Reserve
The GENIUS Act established Bitcoin as a U.S. strategic reserve asset — creating a structural price floor without precedent. Spot Bitcoin ETFs now hold $86.9 billion AUM (~6% of circulating supply), though late March 2026 saw $2.8 billion in net outflows, signaling institutional caution amid macro uncertainty.
🌐 Tokenization & Municipal Bonds
The New Hampshire Business Finance Authority plans to issue $100M in Bitcoin-backed municipal bonds (Moody’s Ba2). S&P Dow Jones Indices tokenized its iBoxx U.S. Treasury index on the Canton network, with on-chain Treasuries tokenization surpassing $12.5 billion.
Macro Headwinds
- 💰 Restrictive Fed: 3.50–3.75% rates, only one 25bps cut expected in 2026
- ⚔️ Iran conflict: BTC briefly spiked to $75,000 as a safe haven before retracing
- 🛢️ WTI crude at $105/barrel: historically precedes BTC corrections of 14–27%
- 📉 BTC/Gold correlation: -0.47 — Bitcoin not yet a fully established safe haven
2026 Institutional Price Forecasts
| Institution | 2026 BTC Target | Primary Rationale |
|---|---|---|
| J.P. Morgan | $170,000 | Corporate treasury adoption |
| Standard Chartered | $150,000 | ETF flows & stablecoin legislation |
| Citi Bank | $143,000 | Regulatory clarity |
| CoinShares | $100,000 – $175,000 | Tailwinds vs. political delays |
| Fidelity | $65,000 – $75,000 | Market exhaustion & cyclic dormancy |
| Fundstrat | $60,000 – $65,000 | Global liquidity tightening |
Key Technical Reference Levels
| Level Type | Price (USD) | Significance |
|---|---|---|
| 🔴 Major Resistance | $126,000 | 2025 ATH |
| 🔴 Intermediate Resistance | $100,000 | 50-week EMA |
| 🔴 Immediate Resistance | $72,500 – $73,595 | 50-day SMA & whale sell wall |
| ⚖️ Pivot Point | $68,642 | Current market equilibrium |
| 🟢 Immediate Support | $68,014 – $68,306 | 20-day SMA & heatmap bids |
| 🟢 Critical Support | $65,994 | Recent daily low |
| 🟢 Historical Support | $53,000 – $58,000 | Long-term buy zone |
Synthesis & Outlook
Bitcoin on April 1, 2026 is an asset in transition: technically trapped in a corrective cycle facing a formidable sell wall at $72,300, yet supported by unprecedented institutional fundamentals. Bullish scenario: break above $73,595 with volume expansion and MACD bullish crossover → rally to $80,000. Bearish scenario: loss of $65,994 → liquidity sweep toward $53,000–$58,000. Long-term holder supply is progressively becoming illiquid — setting the stage for a future supply shock once macro conditions turn favorable.
⚠️ Disclaimer: This article is written for educational and informational purposes only. It does not constitute investment advice, a recommendation to buy or sell, or any form of financial guidance. Cryptocurrency markets are highly volatile and carry significant risk of capital loss. Please consult a licensed financial advisor before making any investment decisions.