


Bitcoin enters July 2026 on a distinctly nervous footing. Confined between $62,000 and $62,700 after several dips below the psychologically critical $60,000 mark, the top crypto asset is now the stage for a rare clash between restrictive macroeconomic forces, unprecedented supply shocks, and technical signals that are beginning to hint at a possible reversal. Here’s a full breakdown, from institutional flows to real-time charts.
A Macroeconomic Backdrop Under Strain
Valuing a yieldless asset like Bitcoin remains tightly bound to central bank policy. Expectations of a dovish pivot from the U.S. Federal Reserve have been sharply recalibrated in recent weeks: persistent inflation, compounded by geopolitical tensions in the Middle East and their effect on energy prices, has forced the Fed to maintain a hawkish stance. The result is a continued high opportunity cost for holding volatile assets, and the FOMC minutes released in early July were scrutinized closely by trading desks worldwide.
On the U.S. institutional sentiment front, the Coinbase Bitcoin Premium Index — which tracks the price gap between the BTC/USD pair on Coinbase Pro and its offshore equivalent — has stayed in negative territory for 50 consecutive days, an unprecedented streak since the index was created. This points to structural spot-selling pressure from high-net-worth U.S. players rather than a simple arbitrage inefficiency.
Against this distribution, Spot Bitcoin ETFs offer a notable counterweight. After cumulative net outflows exceeding $4.5 billion in June, early July saw a clear reversal: over $266 million flowed in on July 6, followed by another $265 million day, more than $200 million of which came from BlackRock’s IBIT alone. This rotation illustrates a tactical « smart money » approach, reallocating capital heavily whenever price retraces into its zones of interest.
Two Historic Ghosts Resurface
The German Government’s Strategic Liquidation
The most significant liquidity event remains the German authorities’ orchestrated sale of 49,858 BTC from criminal seizures, generating $2.89 billion at a weighted average price of $57,900. While these sales were smoothed via TWAP algorithms routed through market makers and public exchanges, blockchain transparency allowed real-time tracking, triggering massive front-running by speculative traders and amplifying the capitulation below $60,000. Notably, the timing proved costly for the German state, with an estimated opportunity cost of over $2.3 billion compared to a later liquidation.
The Return of the Mt. Gox Spectre
The second risk factor is the resolution of the Mt. Gox bankruptcy, with the ongoing distribution of over 140,000 BTC to creditors. While this volume is manageable at current market scale, the psychological impact is real: these creditors hold BTC often acquired at prices below $1,000, creating a high probability of massive profit-taking. On-chain data already confirms preparatory movements, with 4,623 BTC entering spot exchanges in a single block — the largest such inflow since April. Analysts expect this overhang to weigh on the market throughout July, with possible normalization by August.
Miner Capitulation: A Market-Bottom Signal?
Since the last halving, the block reward has dropped to 3.125 BTC, squeezing margins hard across a mining industry already weakened by falling prices. Network hashrate fell from 658 to 556 exahashes per second within weeks, triggering a 7.8% downward difficulty adjustment. According to CryptoQuant CEO Ki Young Ju, bear markets have historically bottomed when the average daily mined value falls to roughly 40% of the yearly average; that ratio currently sits around 72%, suggesting the purge of less efficient miners is still underway — but one that, once complete, tends to set the stage for healthier supply dynamics.
Multi-Timeframe Technical Reading
The Order Book Heatmap: Mapping Liquidity
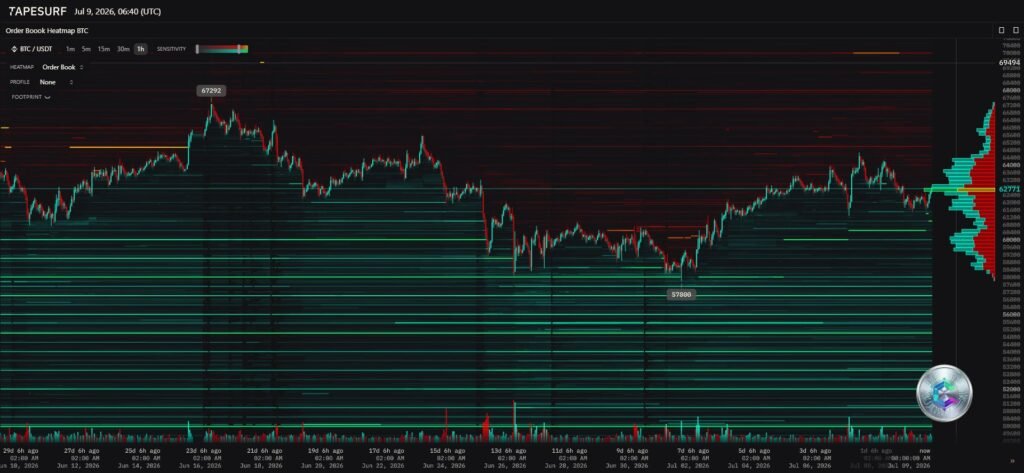
The map of resting limit orders reveals a clear asymmetry. Above price, a dense sell wall peaks at $67,292, aggregating early-buyer take-profits alongside short-seller stop-losses. Below price, a massive buy-order base sits at $57,899, explaining why the recent dip toward $54,000–$57,000 was absorbed so quickly. A confirmed break of this support would open the door to a liquidation cascade toward $50,000.
The Underlying Trend: Daily Chart
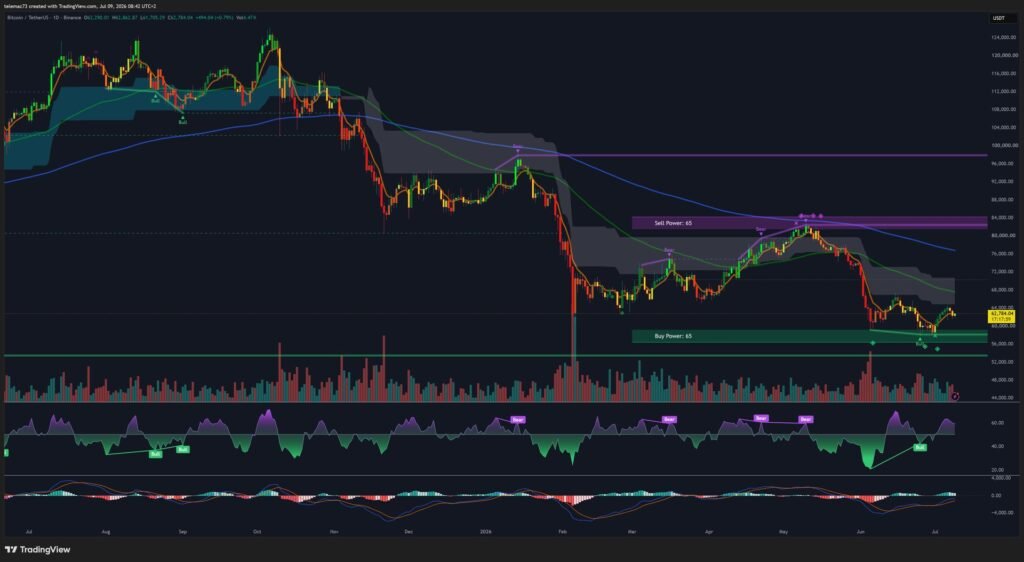
At $62,284, the daily chart shows a confirmed Death Cross on the moving averages — a lagging bearish signal that confirms the negative momentum of recent months. Two nuances stand out, though: the MACD histogram, while still deeply red, is beginning to flatten, and more importantly the RSI is carving out a clear bullish divergence, with price printing lower lows that the oscillator refuses to follow — a sign of seller exhaustion. An institutional buy zone spans $56,000–$59,000, while major resistance sits between $68,000 and $70,000. Zooming out, the long consolidation since the October 2025 all-time high ($126,198) forms a broad bull flag, whose confirmed breakout would project targets toward $130,000, potentially $150,000.
Intermediate Structure: The 4-Hour Chart
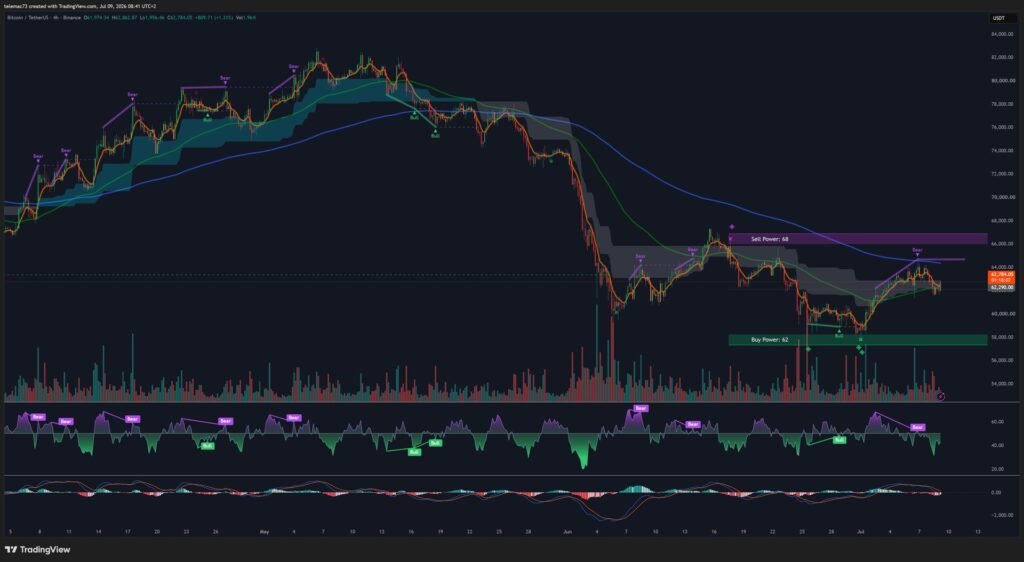
On the 4-hour timeframe, at $62,298, price action is sketching out a double-bottom pattern whose neckline sits right at the $66,000 resistance. The MACD recently registered a bearish crossover, but the RSI is recovering from low levels and attempting to reclaim its midline. Price is also trying to break free of a descending Ichimoku cloud acting as dynamic resistance: until it closes above it, the trend remains vulnerable to sell-the-rip pressure.
Micro-Structure: The 15-Minute Chart
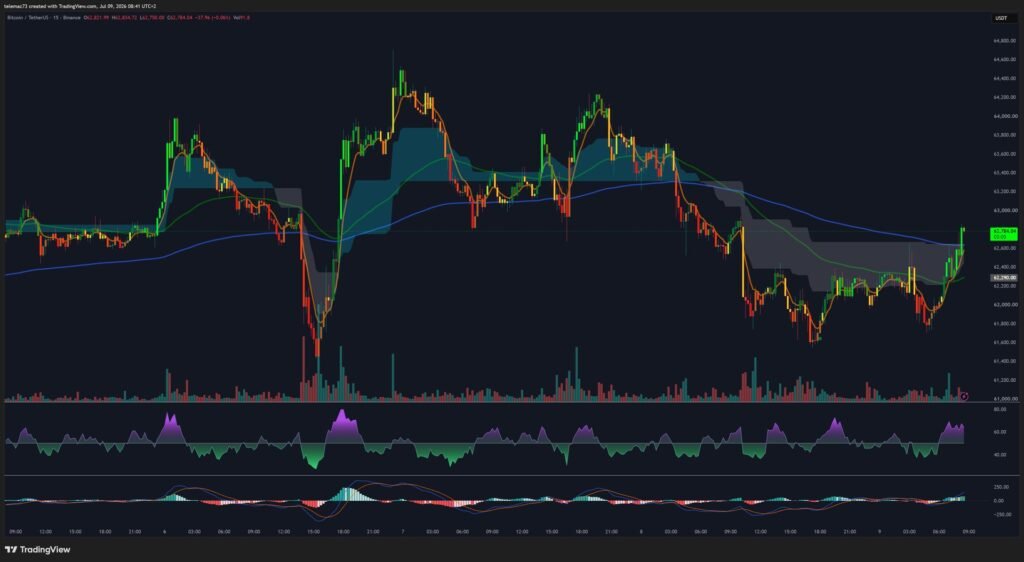
At $62,784, the intraday chart shows the clearest signal of the day: a MACD Golden Cross accompanied by an expanding green histogram, pointing to a short-term liquidity inflow. Price action is also carving out a compression triangle that has just broken out to the upside. The RSI, having bounced back from extreme oversold levels, is now trading in high territory — genuine bullish momentum, but one that remains vulnerable to a quick profit-taking reversal.
| Timeframe | Key Indicator | Current Signal |
|---|---|---|
| Daily | Moving Averages / RSI | Active Death Cross, but bullish RSI divergence |
| 4-Hour | Price Structure / MACD | Double bottom forming, RSI reclaiming midline |
| 15-Minute | MACD / Chart Patterns | Golden Cross, bullish breakout from compression triangle |
Synthesis: the « Air Pocket » and Two Scenarios
Taken together, these elements sketch out what can be described as an « air pocket »: between $52,500 and $60,000, historical trading volume has remained very thin since the December 2023 accumulation cycle. The lack of market memory in this zone explains the choppy volatility and pronounced wicks seen on the charts — an asset moves through low-volume zones quickly, since there’s little friction to slow it down.
The Bullish Scenario
For the structure to turn decisively bullish, a precise sequence needs to unfold: 15-minute momentum must first secure the $63,000 threshold, after which 4-hour buying strength must absorb remaining supply to validate the double bottom and challenge the $66,000 resistance. The decisive pivot sits on the daily chart, around the $60,300–$61,300 zone. If that level is cleared with the support of ETF inflows and a possible short squeeze above $67,292, a return to the underlying bullish trend would be technically validated.
The Bearish Scenario
Conversely, if the Fed’s high-rate environment continues to choke liquidity and the Coinbase Premium stays negative, the daily bullish RSI divergence would be invalidated. A rejection below the 200-day EMA ($58,180) would force the market to seek lower liquidity, with a break of the $57,899 support opening the path toward the $51,000–$52,500 zone, or even the structural 2023 point of control at $42,224. Miner capitulation and pressure from Mt. Gox distributions could accelerate this scenario.
Beyond pure price mechanics, the institutional debate raised by figures like Eli Ben-Sasson (StarkWare), who questions the rigidity of Bitcoin’s fixed 21-million-coin cap in favor of a controlled-inflation model, illustrates the asset’s maturation: it is now being stress-tested against global monetary theory, well beyond the speculative enthusiasm of its early days.
Conclusion
July 2026 is not simply a consolidation phase — it’s a crucible where historic forces collide. Resolving this equation will largely depend on traditional finance’s ability, via Spot ETFs, to absorb the shock of government liquidations and first-era Bitcoin bankruptcies, all within an order-book landscape marked by extreme latent volatility.
Disclaimer: this article is strictly educational and informational in nature. It does not constitute investment advice, a recommendation to buy or sell, or a solicitation to trade any financial instrument. Cryptocurrencies are highly volatile and risky assets. Always do your own research (DYOR) and consult a licensed financial advisor before making any investment decision.

