


Technical and fundamental analysis — July 13, 2026

Bitcoin (BTC) is going through a pivotal and unusually complex phase, caught between macroeconomic headwinds and a structural institutional adoption that is redefining its status. The asset is trading in a tight, nervous consolidation range, far from its all-time high of $126,198 reached in October 2025, after touching a critical floor near $58,000 at the end of June 2026.
A notable feature of this correction: unlike previous crashes (Terra/Luna, FTX), no internal systemic failure is to blame. Market infrastructure remains solid — no major exchange has faltered, no significant stablecoin has lost its peg. Selling pressure comes almost exclusively from external forces: restrictive Federal Reserve monetary policy, geopolitical tensions in the Middle East, and capital flows tied to ETF activity.
Macroeconomic and Geopolitical Backdrop
The FOMC minutes from the June 17, 2026 meeting, released July 8, revealed a distinctly hawkish stance under new Fed Chair Kevin Warsh. The committee held rates between 3.50% and 3.75% for the fourth consecutive time, but nine of eighteen officials now project a possible hike before year-end — a reversal that dashed the market’s rate-cut expectations.
All eyes are now on the U.S. CPI release on July 14. A softer-than-expected print would revive the rate-cut narrative and could push BTC toward the $66,000 resistance zone. Conversely, a hotter-than-expected CPI would threaten the $60,000 support and open the door to the $53,485 demand zone.
Adding to this, geopolitical shocks are compounding the picture: the collapse of the US-Iran ceasefire raises the risk of oil breaking above $100, while a historic surge in Japanese government bond yields (10-year JGB) is pulling capital back to Japan, draining global liquidity available for risk assets.
| Macro Factor | Current State | Theoretical Impact on BTC |
|---|---|---|
| Fed Policy (FOMC) | Hawkish, rates at 3.50–3.75% | Negative (higher opportunity cost) |
| U.S. CPI | Release on July 14 | Binary — critical catalyst |
| Geopolitics (US/Iran) | Ceasefire broken | Negative short-term, positive long-term |
| Japanese JGB Yields | 30-year high | Negative (capital repatriation) |
Fundamentals: Unprecedented Institutional Adoption
While the short-term macro picture remains uncertain, Bitcoin’s structural fundamentals have arguably never looked stronger. Progress on the CLARITY Act and GENIUS Act in the U.S. is finally clarifying the regulatory boundaries between the SEC and CFTC, removing a risk premium that had long kept conservative allocators on the sidelines.
On the accounting side, the FASB reform now allows companies to hold BTC on their balance sheets without penalty for temporary price volatility. MicroStrategy alone holds more than 845,000 BTC. Despite the recent downturn, Spot ETFs recorded net inflows of $143 million in a single day of panic, confirming latent demand buying the dip.
The market has also shown remarkable resilience in absorbing historic supply shocks: the liquidation of roughly 50,000 BTC seized by German authorities (Movie2k case) and the restitution of roughly 140,000 BTC to Mt. Gox creditors were digested without breaking the underlying bullish structure, further shrinking the floating supply available for future selling.
Liquidation Heatmap and Order Flow
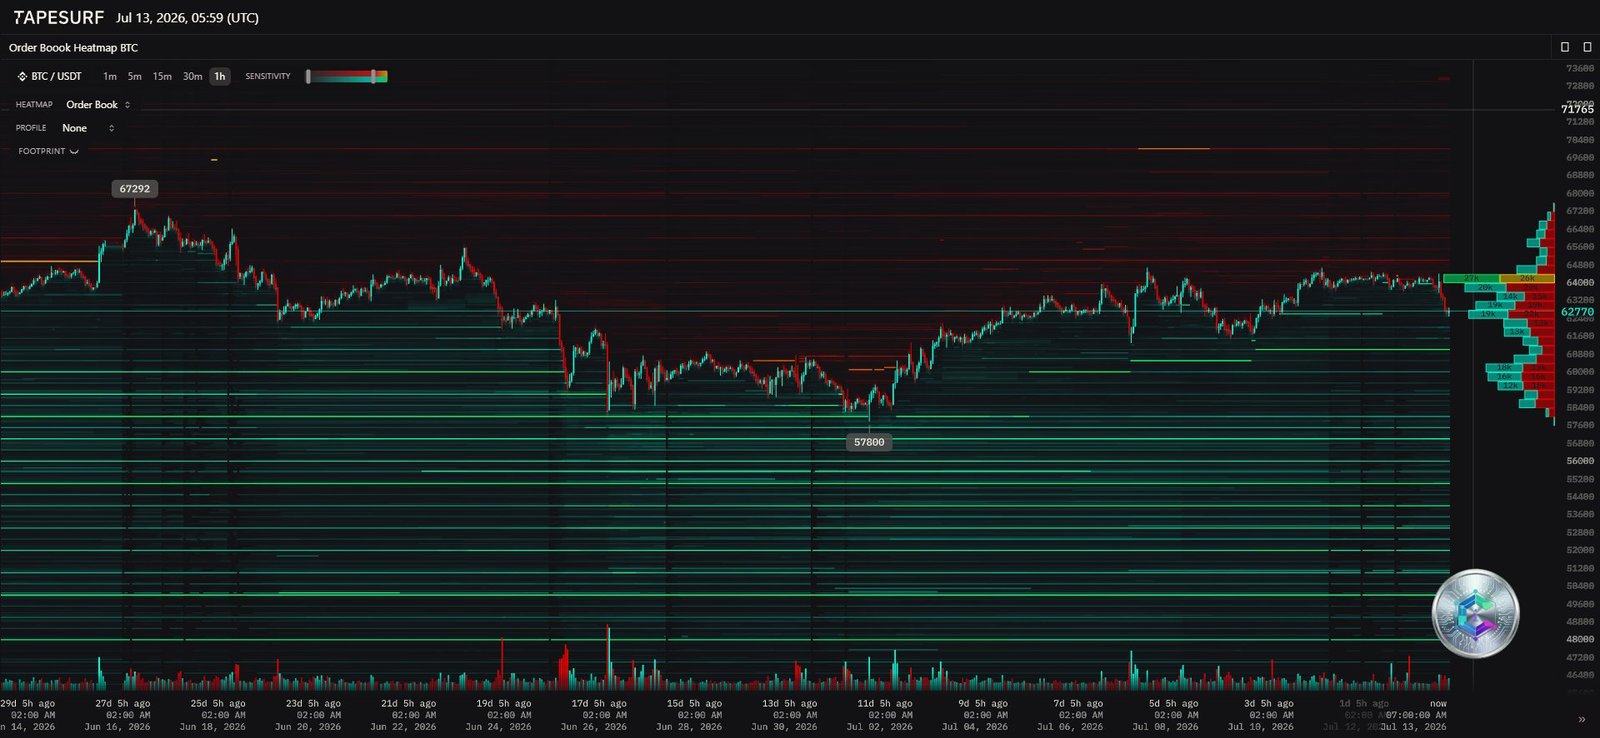
The brief loss of the $60,000 level recently triggered a massive leverage flush: more than $1.2 billion in futures positions were liquidated across the crypto market, with $364 million on Bitcoin alone, and roughly 76% of the wiped-out positions being over-leveraged longs.
The current liquidation map reveals two major gravitational poles. On the support side, a dense block of buy orders defends the $58,000 zone, with a liquidity void below at $53,485 in case of a breakdown. On the resistance side, a $2.26 billion wall of short positions is concentrated around $67,645 — a break above this level would trigger a violent short squeeze toward $70,000–$75,000.
| Concentration Zone | Price Level | Consequence if Triggered |
|---|---|---|
| Major short squeeze | $67,645+ | Explosive move toward $70k–$75k |
| Active resistance | $64,000 | Temporary rejection, consolidation |
| Micro-structure pivot | $60,900 | Slide toward major support |
| Demand zone | $58,000 | Support, potential market bottom |
| Liquidity void | $53,485 | Final capitulation |
Multi-Timeframe Technical Analysis
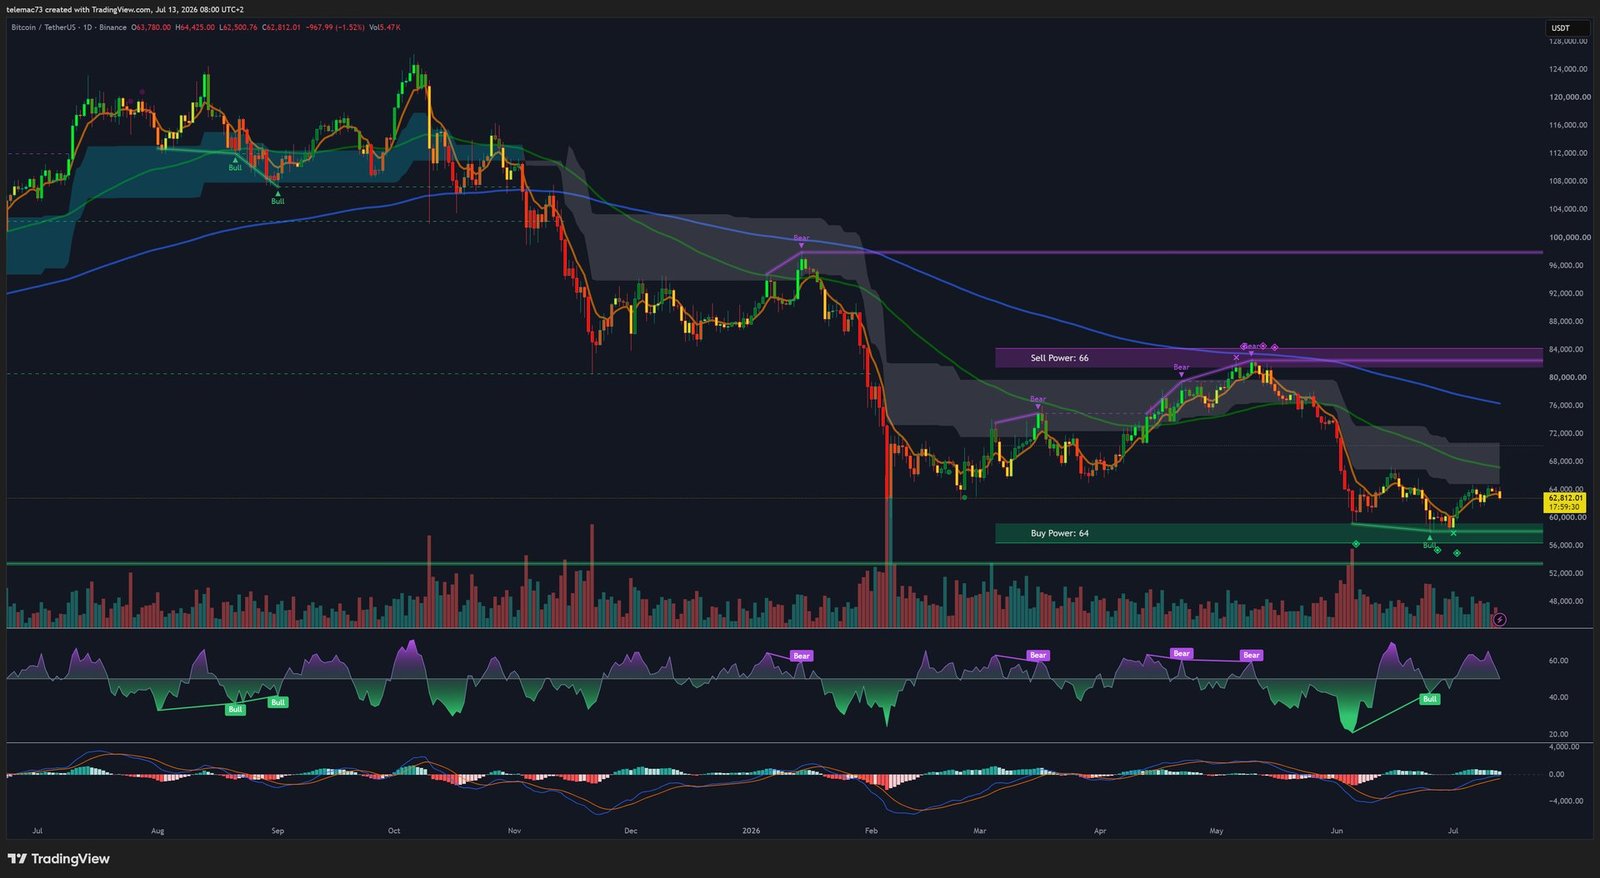
Daily: BTC remains trapped between the $58,000–$60,000 floor and the $63,800–$64,500 ceiling. The 50-EMA ($66,343–$66,946) acts as a lid, while the 200-EMA far above at $76,645 confirms a structurally bearish « Death Cross. » The daily RSI sits around 31, close to extreme oversold territory, which could signal seller exhaustion if a bullish divergence forms.
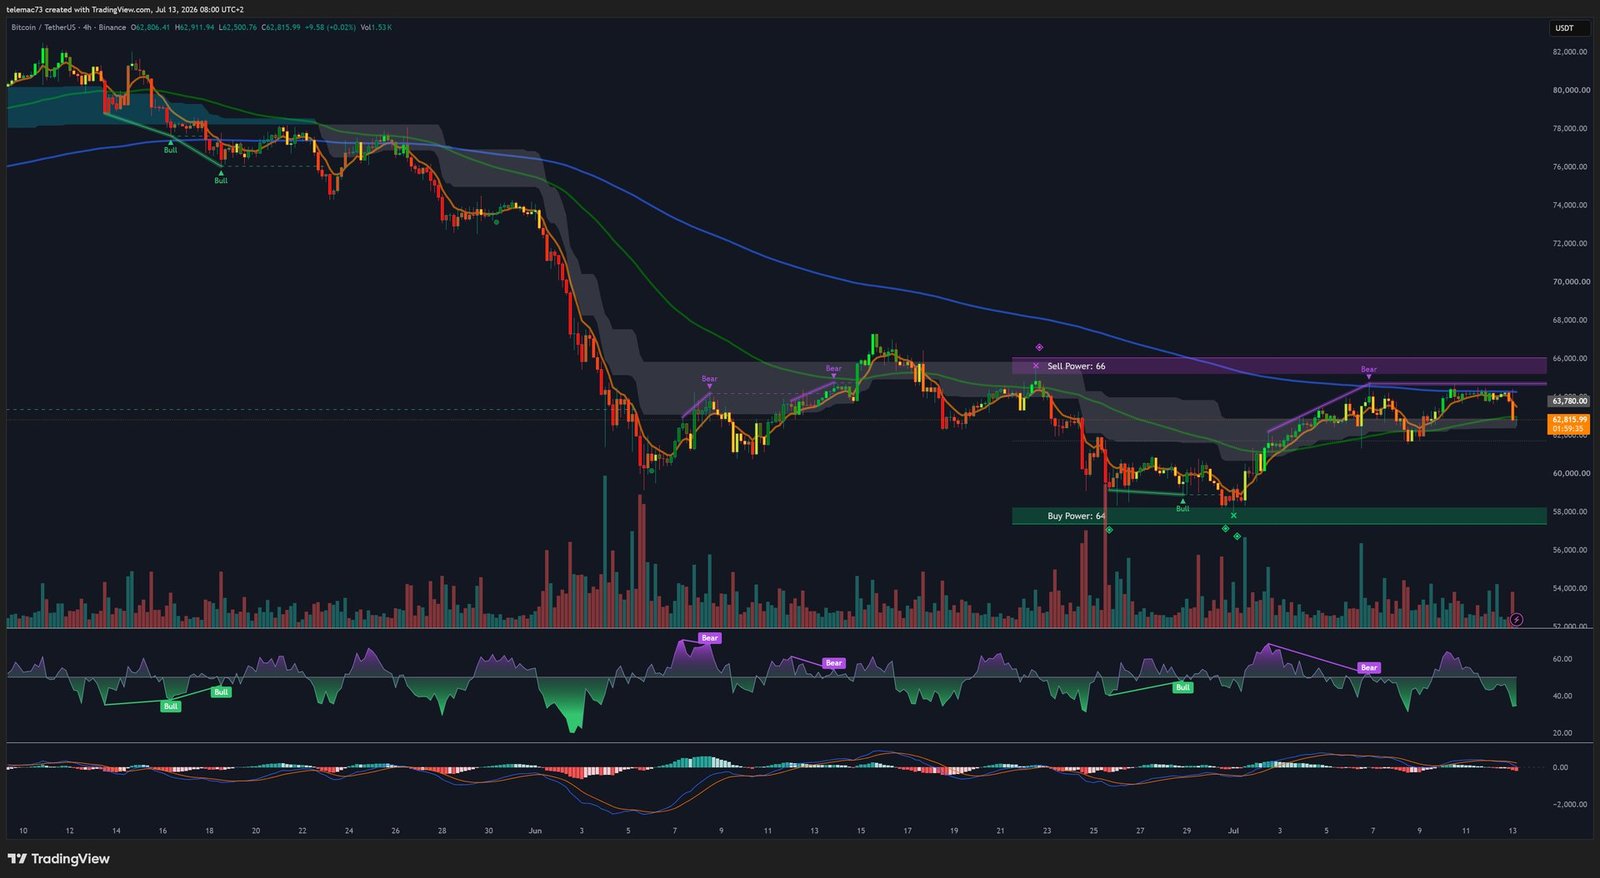
4-Hour: after six consecutive green candles, a red close signals a healthy cooldown in momentum. BTC is holding within its TBO cloud; as long as $61,000 holds on a closing basis, the consolidation is classified as a bullish pause.
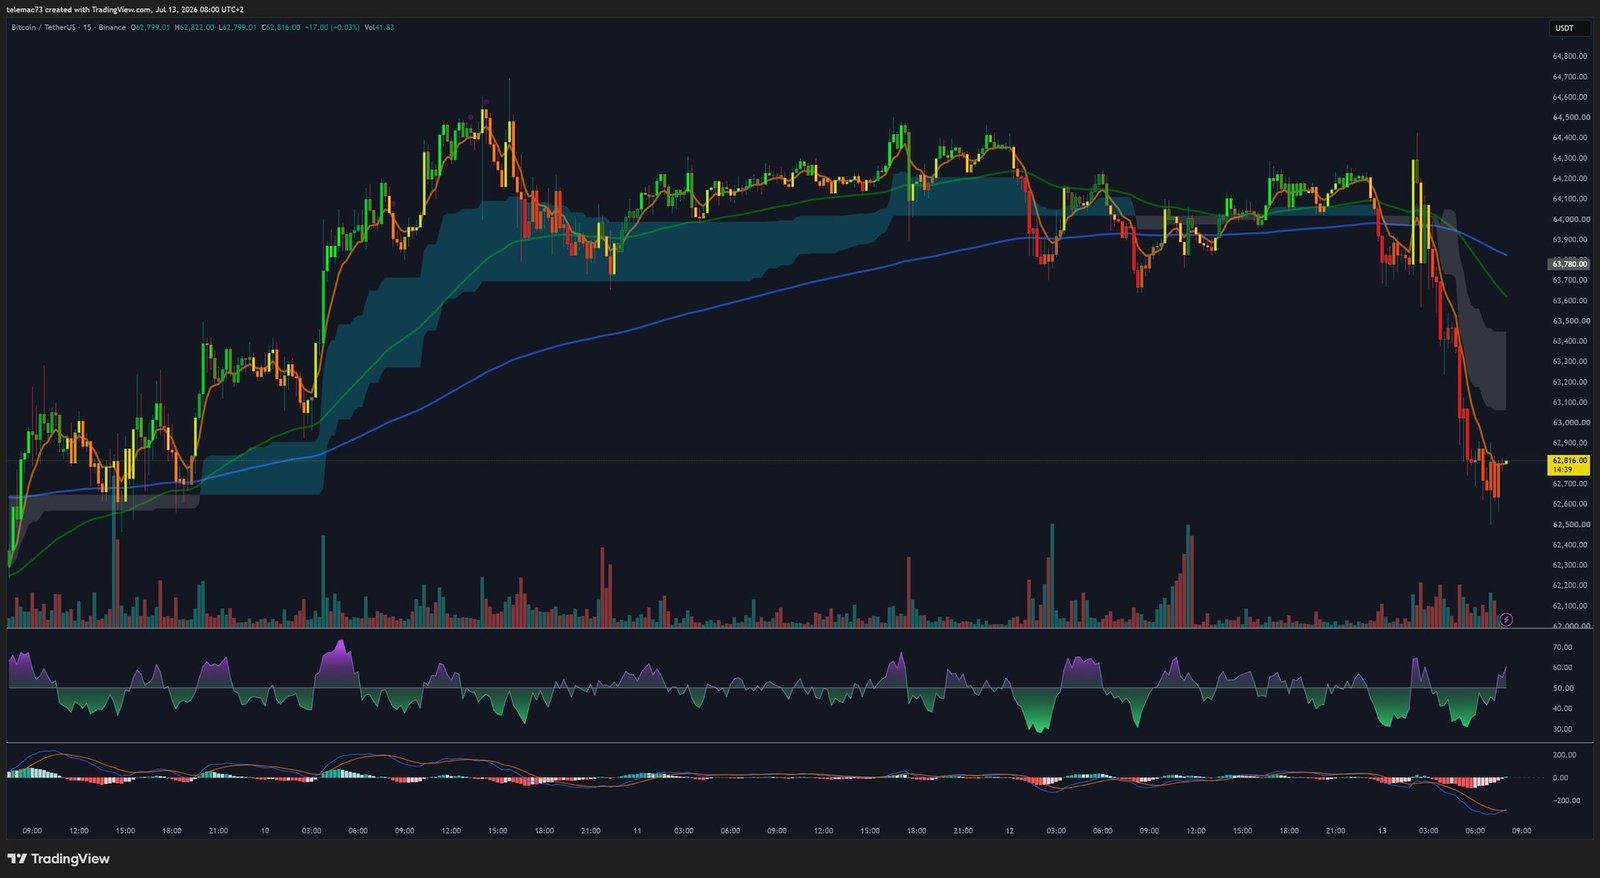
15-Minute: price action is dominated by high-frequency trading, with deep wicks around the $62,000 pivot. No exploitable long-term directional trend is visible on this timeframe — the market is rebalancing inventory ahead of the CPI catalyst.
Oscillators and Momentum
The daily MACD remains below its signal line in a mild bearish cross, confirming fragile momentum. Bitcoin’s Sharpe Ratio has fallen to its lowest level since the 2022 collapse, while the Crypto Fear & Greed Index sits around 23 (« Extreme Fear »). From a contrarian standpoint, this combination has historically coincided with the formation of major market bottoms.
Chart Structure
The bull flag identified before the rejection at $64,000 was invalidated by the break below $60,000. It has given way to broad symmetrical compression triangles on higher timeframes, setting up an explosive breakout whose direction will depend on the next macro catalyst. A rising wedge observed during the previous rally attempt further illustrates structural buyer exhaustion, which drove the recent reversal.
Key Level Summary
| Level (USD) | Significance |
|---|---|
| ~$76,645 | 200-EMA — ultimate cycle-change resistance |
| $67,645 | Short liquidation pole ($2.26B) |
| $66,343-$66,946 | 50-EMA — short-term bullish correction limit |
| $63,800-$64,500 | Ceiling of recent consolidation channel |
| $62,000 | Current psychological pivot |
| $60,000-$60,900 | Fracture level (leverage flush) |
| $58,000 | Floor support — institutional demand |
| $53,485 | Structural abyss — target on breakdown |
Two Scenarios Ahead
Bullish scenario: a softer-than-expected CPI would force the Fed to soften its rhetoric. BTC would break through $64,000, then its 50-EMA near $66,900, triggering the liquidation of $2.26 billion in short positions around $67,645 — a short squeeze propelling price toward $70,000, potentially $75,000.
Bearish scenario: a hot CPI combined with geopolitical escalation would force the Fed to hold or even tighten policy further. A loss of the $58,000 support would open the path toward the $53,485 liquidity void, in a prolonged capitulation phase.
Conclusion
Bitcoin is walking a tightrope between institutional maturity and macroeconomic vulnerability. Regulatory, accounting, and political fundamentals have never looked stronger, but short-term price action remains dictated by U.S. monetary policy arbitrage and the upcoming CPI release. Holding the $58,000 support remains the essential technical condition for preserving the long-term bullish thesis.
Disclaimer: This article is provided for informational and educational purposes only. It does not constitute investment advice or a recommendation to buy or sell. Investing in cryptocurrencies carries significant risk of capital loss. Always do your own research (DYOR) and consult a licensed financial advisor before making any investment decision.

