
In early March 2026, Bitcoin (BTC) is navigating a period of rare complexity. With price oscillating nervously between $66,000 and $70,500, retail psychology approaching capitulation, silent institutional accumulation, and deeply contradictory technical signals — the market stands on the precipice of a major directional resolution. This comprehensive analysis dissects the anatomy of this market structure through macroeconomic, on-chain, microstructural, and multi-timeframe chartist lenses.
1. Market Overview and Macro-Structural Context
Bitcoin’s dominance over the broader crypto market stands at 58.51%, a level that is literally starving altcoins of liquidity while keeping the ecosystem’s total market cap at $2.28 trillion. This capital concentration toward the most liquid asset reflects pronounced risk aversion, further exacerbated by declining daily transaction volumes stagnating around $273.54 billion.
This volume contraction within a short-term downtrend is the classic symptom of a distribution phase where directional conviction is absent — leaving room for erratic volatility driven by derivatives liquidations rather than genuine spot price discovery.
2. Macroeconomic Environment and Exogenous Shocks
The backdrop of early 2026 is dominated by the persistent specter of stagflation — a theoretically hostile environment for high-beta assets like Bitcoin.
Escalating tensions between the US, Israel, and Iran have propelled crude oil beyond the critical threshold of $110 per barrel, reigniting expectations of persistent global inflation. Meanwhile, US economic data paints a concerning picture: a net loss of 92,000 jobs in February — versus a consensus of +54,000 — pushed unemployment to 4.4%, while hourly wage growth remains abnormally robust at +0.4% month-on-month.
Faced with this stagflation configuration, the CME FedWatch tool signals a 95.6% probability that the Fed will hold rates in the restrictive range of 3.50%–3.75%. The absence of a monetary pivot maintains a high opportunity cost for holding non-yielding assets like Bitcoin, suppressing fresh institutional liquidity inflows.
Meanwhile, physical gold is trading between $5,123 and $5,363 per ounce, propelled by safe-haven demand. This massive rotation toward the yellow metal is compressing the BTC/Gold ratio — though financial history suggests a geopolitical normalization could trigger a violent mean-reversion rally for Bitcoin.
| Macro Indicator | Value (March 2026) | Implication for Bitcoin |
|---|---|---|
| Crude Oil (WTI) | > $110 / barrel | Inflationary pressure, delays rate cuts |
| US Unemployment Rate | 4.4% | Economic slowdown, stagflation risk |
| Fed Funds Rate | 3.50%–3.75% | Restricted liquidity, high capital cost |
| Gold Spot | $5,123–$5,363 / oz | Safe-haven rotation, BTC demand starved |
| Bitcoin Dominance | 58.51% | Capital concentration, altcoins under pressure |
| Fear & Greed Index | 10 — Extreme Fear | Capitulatory sentiment, often a reversal precursor |
3. On-Chain Dynamics: What the Blockchain Reveals
On-chain analysis allows us to transcend simple price fluctuations and observe the real movement of capital. An extreme psychological dichotomy currently separates retail investors from institutional whales.
Despite an ice-cold Fear & Greed reading of 10, large-wallet analysis reveals methodical accumulation: the number of addresses holding at least 1,000 BTC rose from 1,264 to approximately 1,280 in just weeks, and reserves in the 10,000–100,000 BTC cohort swelled to approximately 2.24 million coins. Smart Money is clearly exploiting retail panic-selling to build strategic positions.
Among Long-Term Holders (LTH), the picture is more nuanced. The Net Position Change for coins dormant for 155+ days surged by 650% (from 5,434 to 41,107 BTC stored), breaking two consecutive months of distribution. However, the very old coin cohort (3–5 year holders) is seeing its share of total supply decrease from 11.49% to 10.94%, creating structural selling pressure concentrated around $69,400 and $70,600 — a fundamental glass ceiling representing ~1.5% of total supply.
On the mining front, resilience is remarkable. Players like Crypto Blockchain Industries (CBI) maintain stable annualized returns of 7%–10% with BTC around $70,000, and the dominant strategy remains HODLing — limiting new coin supply to exchanges.
4. Microstructure and Order Book Heatmap
The order book heatmap provides a three-dimensional X-ray of future market liquidity — showing where price will be mechanically attracted to match the maximum volume of orders.
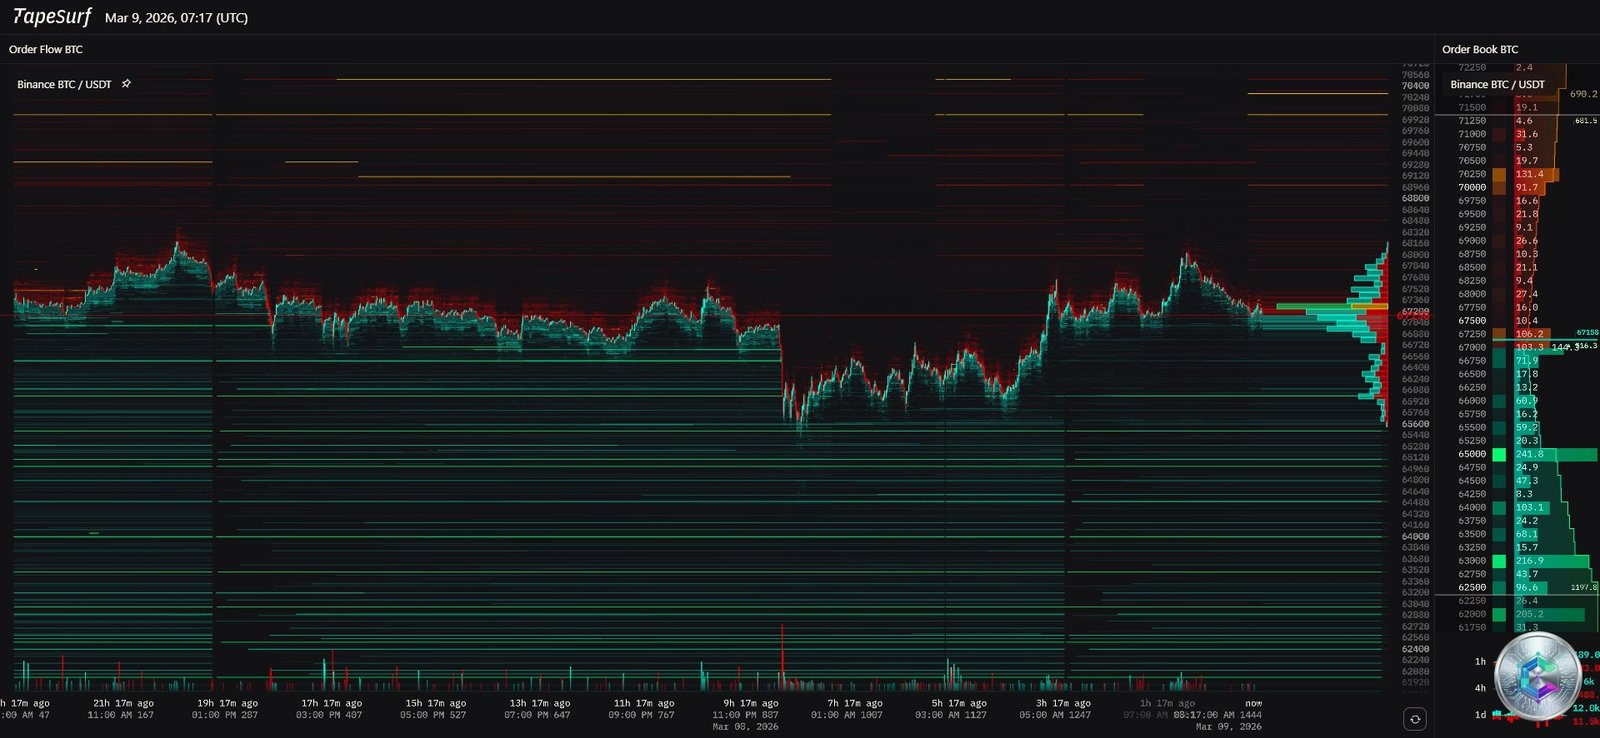
The heatmap reveals a glaring asymmetry: above current price, an incandescent red band signals extreme concentration of limit sell orders and liquidation thresholds clustered around $71,800. This zone is saturated with heavily leveraged short positions (50x–100x). The imbalance is stark: $798 million in short positions against only $430 million in longs.
If buying momentum pushes price into this zone, a self-reinforcing short squeeze mechanism could ignite: each forced liquidation generates a market buy order that propels price toward the next liquidation threshold. Approximately $375 million in liquidations are stacked in this narrow corridor — a fuel reservoir capable of instantly propelling Bitcoin toward $75,000.
⚠️ However, between $72,000 and $76,000, the heatmap reveals a liquidity void. If organic demand doesn’t take over from the short squeeze, price risks a brutal collapse — creating a devastating bull trap that could send the asset back below $60,000.
5. Chart Analysis — Daily Timeframe
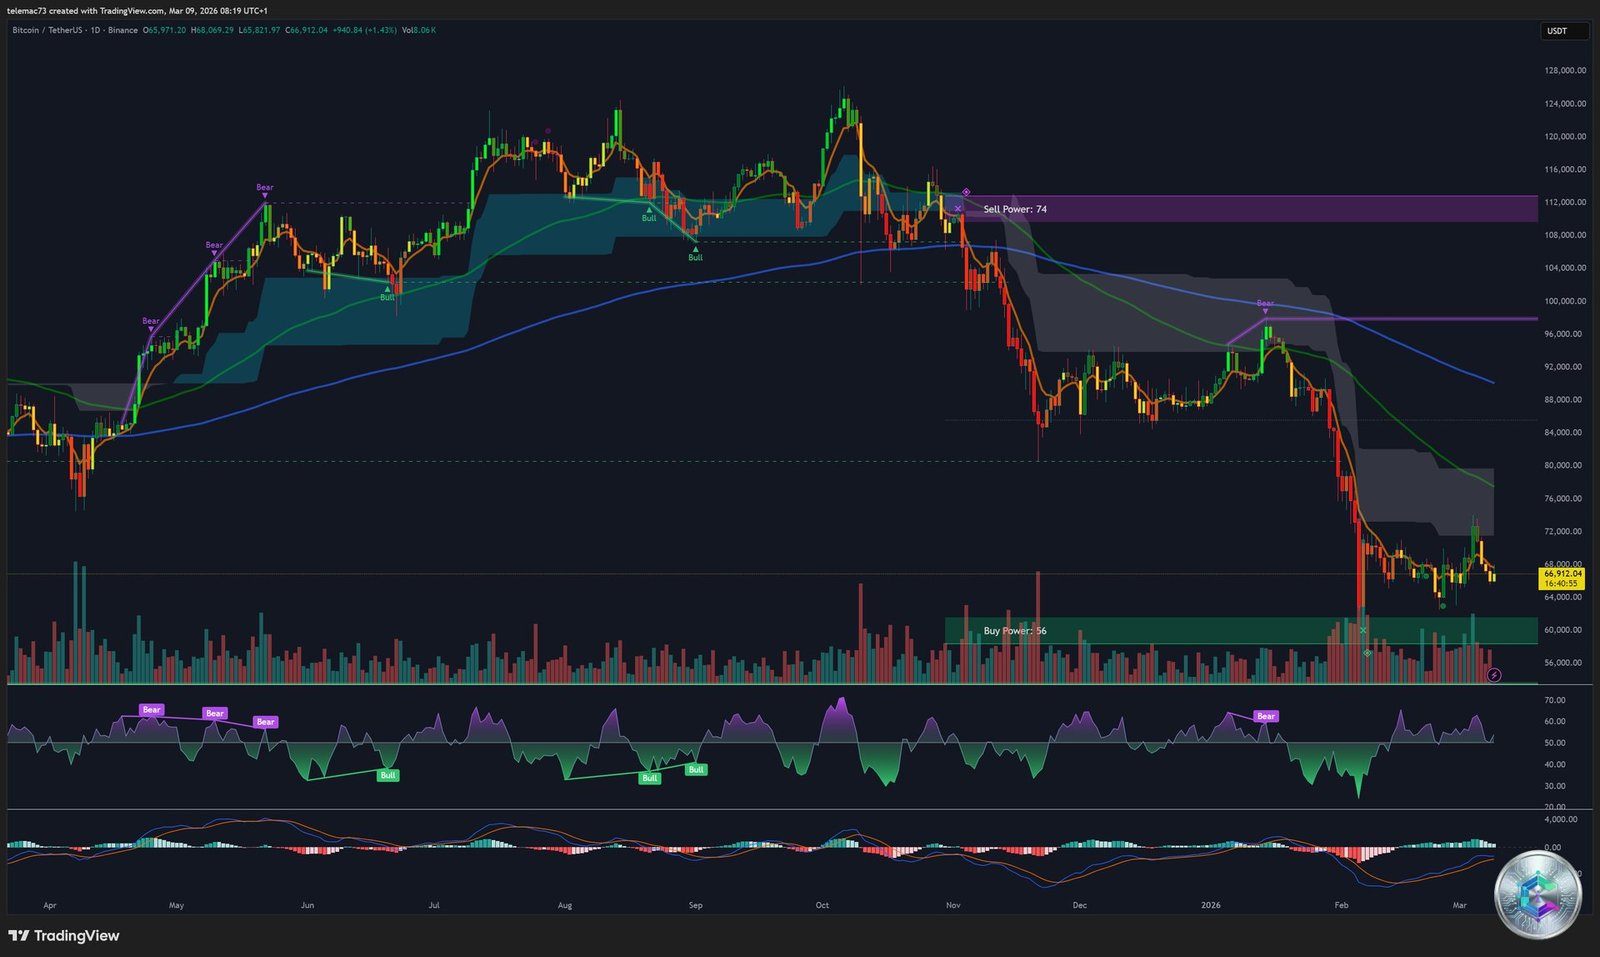
The daily chart depicts the slow formation of a classic bullish continuation pattern: the Cup and Handle. The cup’s morphology, marking a long rounded accumulation phase, was drawn from early February through March 4th. Price is currently locked in the handle formation — a descending consolidation characterized by volatility contraction and declining volumes.
The neckline forms a resistance zone extending from $70,800 to $74,500 (anatomical peak at $74,100). A confirmed daily close above this corridor would project a theoretical target of +18%, pointing to a precise technical objective around $88,100. Conversely, a break below $62,400 would completely invalidate the bullish paradigm.
However, oscillators temper structural optimism:
- RSI (14 periods): between 38.46 and 54.30 — a hybrid zone signaling exhaustion of buying momentum
- MACD (12,26): deeply negative, ranging from -117.3 to -323.6, evidencing sustained selling force dominance
- Moving Averages: MA50 ($67,430) and MA200 ($68,632) act as dynamic overhead resistance. Their bearish convergence raises the specter of a Death Cross
6. Chart Analysis — 4-Hour Timeframe (4H)
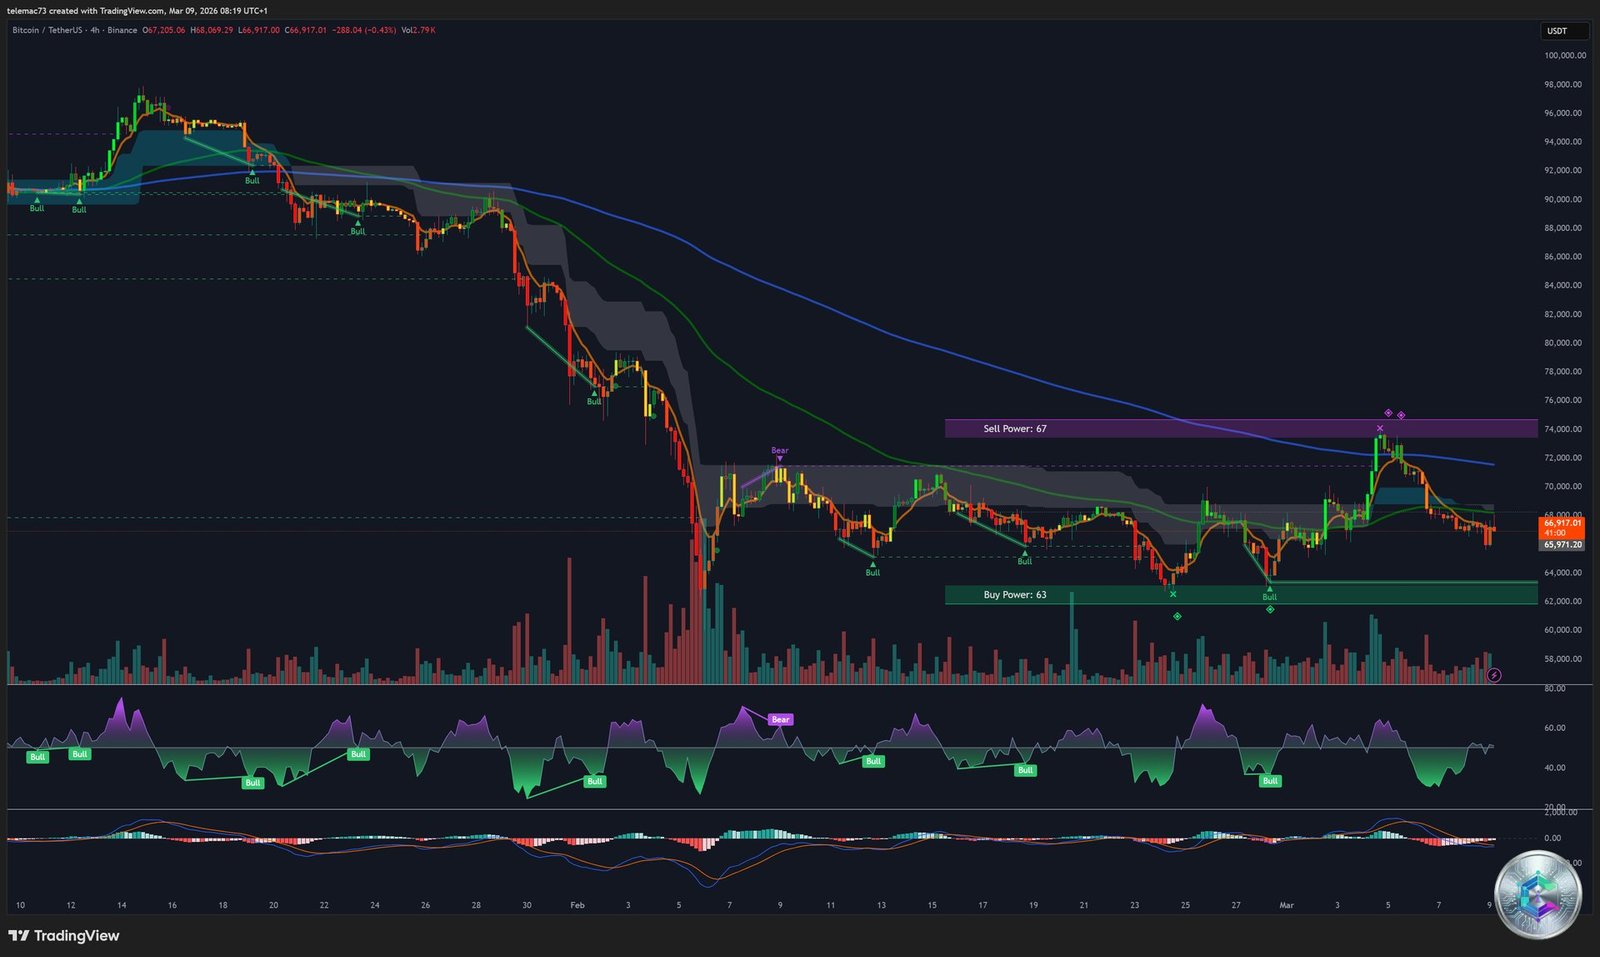
The 4H chart zooms into the internal structure of the daily handle, revealing a particularly precarious architecture: a complex Head and Shoulders (H&S) reversal pattern.
The head is anchored at $74,100. The critical neckline is drawn at $67,800. A 4H candle close below this level would validate the reversal pattern, projecting:
- First target: $65,300
- Final pattern extension target: $61,100
To neutralize this bearish scenario, buyers must force a 4H close above $68,600. The 4H MACD has already sealed a clear bearish crossover (local Death Cross) with an expanding red histogram — momentum belongs squarely to sellers on this timeframe.
7. Intraday Micro-Dynamics — 15-Minute Chart
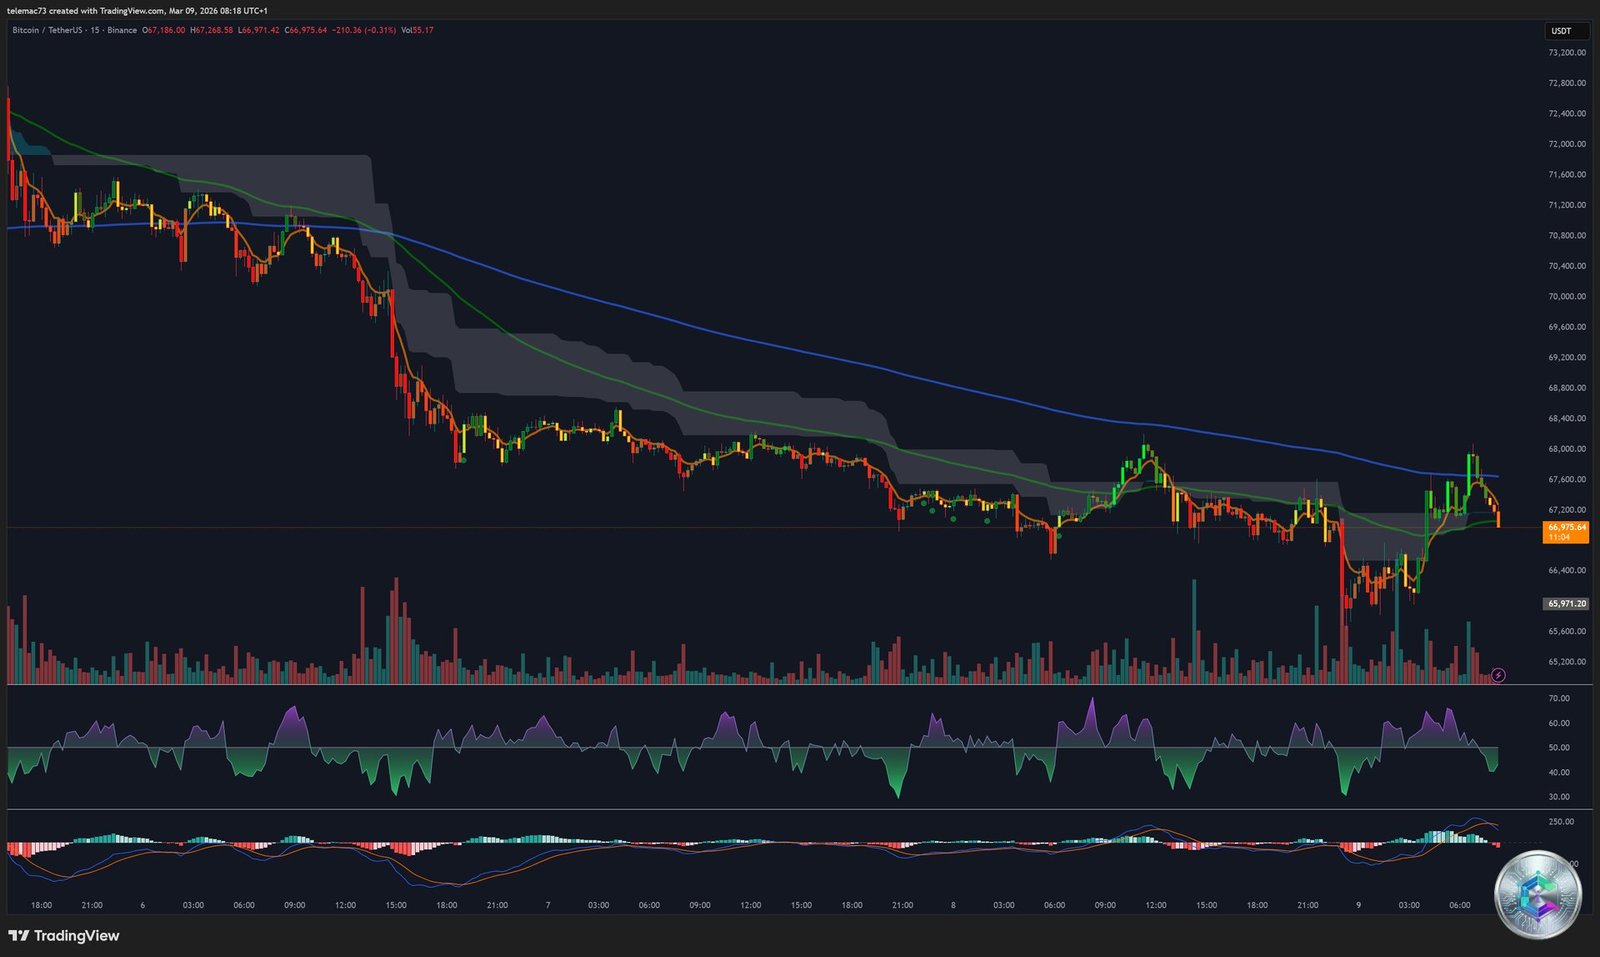
The 15-minute chart is the arena of high-frequency algorithmic battles. The recent sequence is dominated by a parabolic sell-off materialized by a long red engulfing candle, leaving in its wake long lower wicks — the digital fingerprints of institutional TWAP/VWAP algorithms passively buying the panic to accumulate at best cost.
Price action forms a succession of bear flags and pennants: the market isn’t bouncing in a « V » shape, but rather drifting sideways from a lack of additional sellers, before a new liquidation wave drags it one step lower. In an environment where volume has collapsed by 58% from monthly highs, the market is extremely vulnerable to any unusual-sized transaction that could pierce the structure and resolve the compression pattern violently.
8. Key Levels and Pivot Point Mapping
| Technical Level | Price (USD) | Strategic Implication |
|---|---|---|
| 🎯 Major Bullish Target | $88,100 | Cup and Handle breakout target (+18%) |
| 🔴 Invalidation Zone (Top) | $74,100–$74,500 | H&S head and daily macro neckline |
| ⚡ Short Squeeze Cluster | $71,800 | Heatmap epicenter — massive squeeze trigger |
| 📊 Pivot Resistance R1 | $70,507 | First calculated mathematical barrier |
| ⚖️ Central Pivot Point (PP) | $69,143 | Market equilibrium — failure to hold confirms bearish bias |
| 🔴 4H Neckline (ST Support) | $67,800 | H&S trigger — break = massive technical selling |
| 🟡 On-Chain Structural Bulwark | $63,700 | Boundary identified by blockchain metrics |
| 🟢 Macro Buy Power Support | $60,000 | Institutional confluence level and psychological boundary |
| 💀 Capitulation Targets | $52,400–$50,000 | Technical abyss in systemic panic scenario (-30%) |
9. Three Probabilistic Scenarios for Q1–Q2 2026
📊 Scenario 1 — Prolonged Sideways Consolidation (Predominant)
With the Fed holding rates and oil-driven inflation persisting, institutional demand for risk assets remains bridled. Bitcoin should remain imprisoned in the $60,000–$69,143 channel. This scenario implies a slow purge of open interest (already down 43%), forcing temporary retail capitulation while whales continue their silent accumulation campaign.
🚀 Scenario 2 — Short Squeeze and Macro Structural Validation (Explosive)
If a breakout above $70,500 triggers the $71,800 liquidation cluster, the annihilation of ~$400 million in shorts would propel price through the liquidity void up to $76,000. This move would irrefutably validate the daily Cup and Handle, attracting FOMO capital toward the $88,100 theoretical apex — or beyond $110,000 according to some optimistic institutional models.
📉 Scenario 3 — Structural Breakdown and Systemic Capitulation (Devastating)
If macro pressure (stagflation, geopolitical escalation) triggers massive de-risking, the $67,800 neckline will give way on the 4H. The Head and Shoulders validation would trigger an algorithmic chain reaction. A subsequent breach of the vital on-chain threshold at $63,700 would signal the official start of a generalized redistribution phase, with a potential purge toward $52,400–$50,000.
Conclusion
The Bitcoin ecosystem stands on the threshold of a major kinetic resolution. The abyssal divergence between the extreme gloom of short-term momentum indicators (MACD, 4H RSI, potential Death Crosses) and the power of macroscopic accumulation structures (growing institutional reserves, preserved mining profitability, daily continuation pattern) guarantees that the break out of the current compression zone will dictate BTC’s uncontested trajectory for the remainder of fiscal year 2026.
In this high-uncertainty environment, risk management and patience remain the most reliable allies of any informed trader.
⚠️ Disclaimer: This article is written for informational and educational purposes only. It does not constitute investment advice, nor a recommendation to buy or sell Bitcoin or any other financial asset. Crypto-asset markets are highly volatile and carry significant risk of capital loss. Always do your own research (DYOR) and consult a qualified financial advisor before making any investment decision.