
As May 2026 begins, Bitcoin (BTC/USD) hovers around $78,115, locked inside a critical consolidation zone with high-stakes implications. Far from statistical coincidence, this price level represents the epicenter of an institutional battle between long-term accumulation forces and opportunistic distribution pressure amplified by major technical barriers. The following analysis offers an exhaustive radiography of price action, deconstructing market reality through a rigorous multi-timeframe study.
🗺️ Order Flow Mapping: What the Liquidation Heatmap Reveals
Understanding short-to-medium-term price dynamics requires going beyond the two-dimensional surface of candlestick charts. The BTC/USDT order book Heatmap below provides a cross-sectional view of market depth and the latent intentions of institutional and algorithmic operators — a fundamental tool for anticipating friction points and acceleration zones.
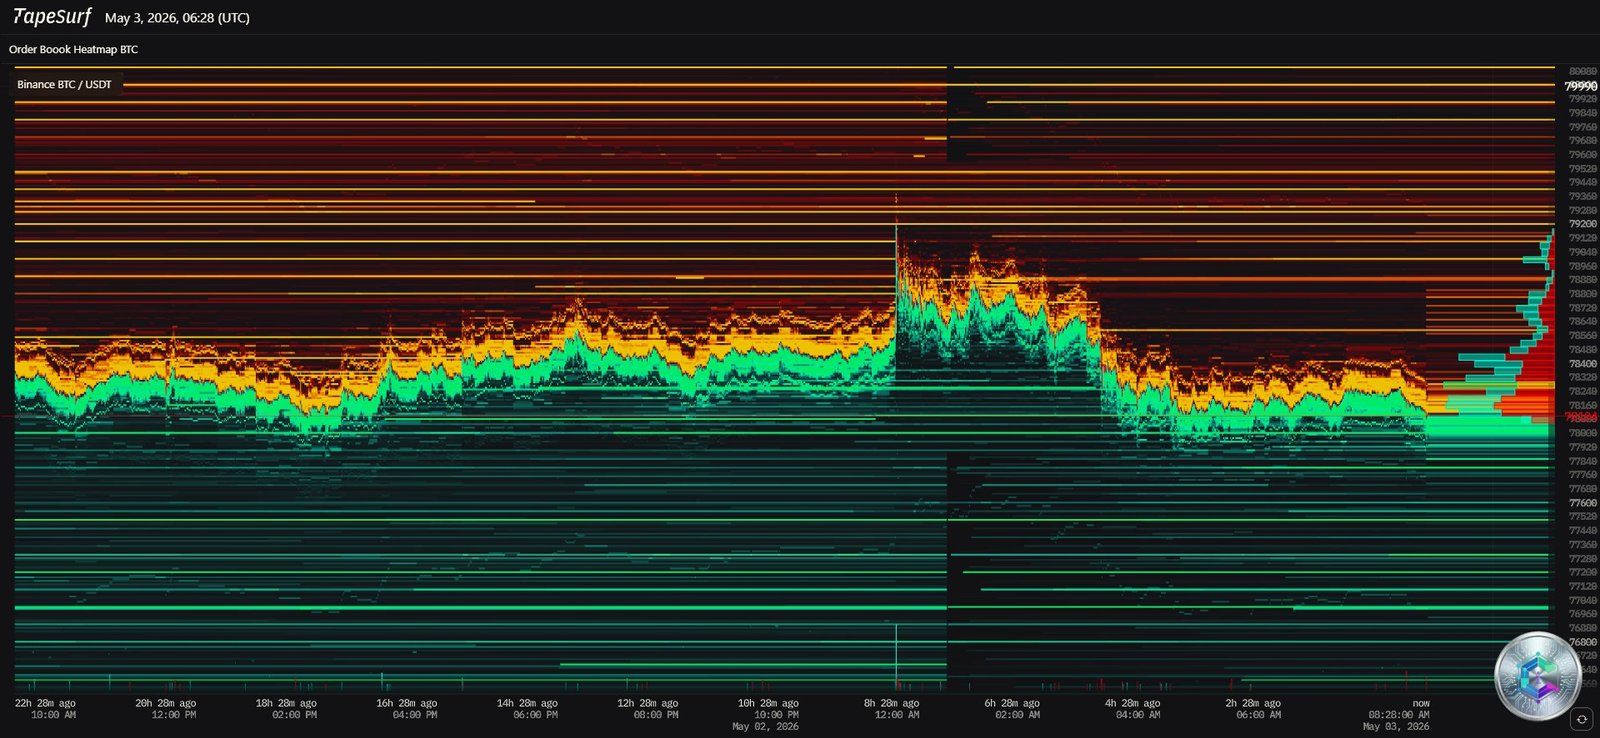
The Heatmap reveals a pronounced stratification of liquidity. Its most striking feature is an impressive sell wall above the current price: a massive concentration of red and orange lines extends from $79,000 to $80,000, acting as an electromagnetic glass ceiling. Every attempt to push higher collides with passive sell-side supply that aggressively absorbs buying pressure — mechanically explaining the repeated rejections observed in recent sessions. Market-making algorithms have parked their inventories in this zone, creating resistance that can only be broken by an exceptional injection of directional capital.
Below, blue and green strata (bid liquidity) form a dense safety net between $76,000 and $78,000. These algorithmic buy clusters, positioned by Smart Money, limit the probability of a sudden collapse without a severe macro-economic catalyst. Crossed with derivatives liquidation data, these signals reveal explosive latent dynamics: if price clears $79,200, a Short Squeeze chain reaction could propel BTC toward Fibonacci targets at $82,353 and $83,437. Conversely, a break below $75,000 would trigger a Long Squeeze cascade toward $73,000.
⚡ High-Frequency Microstructure: 15-Minute Analysis
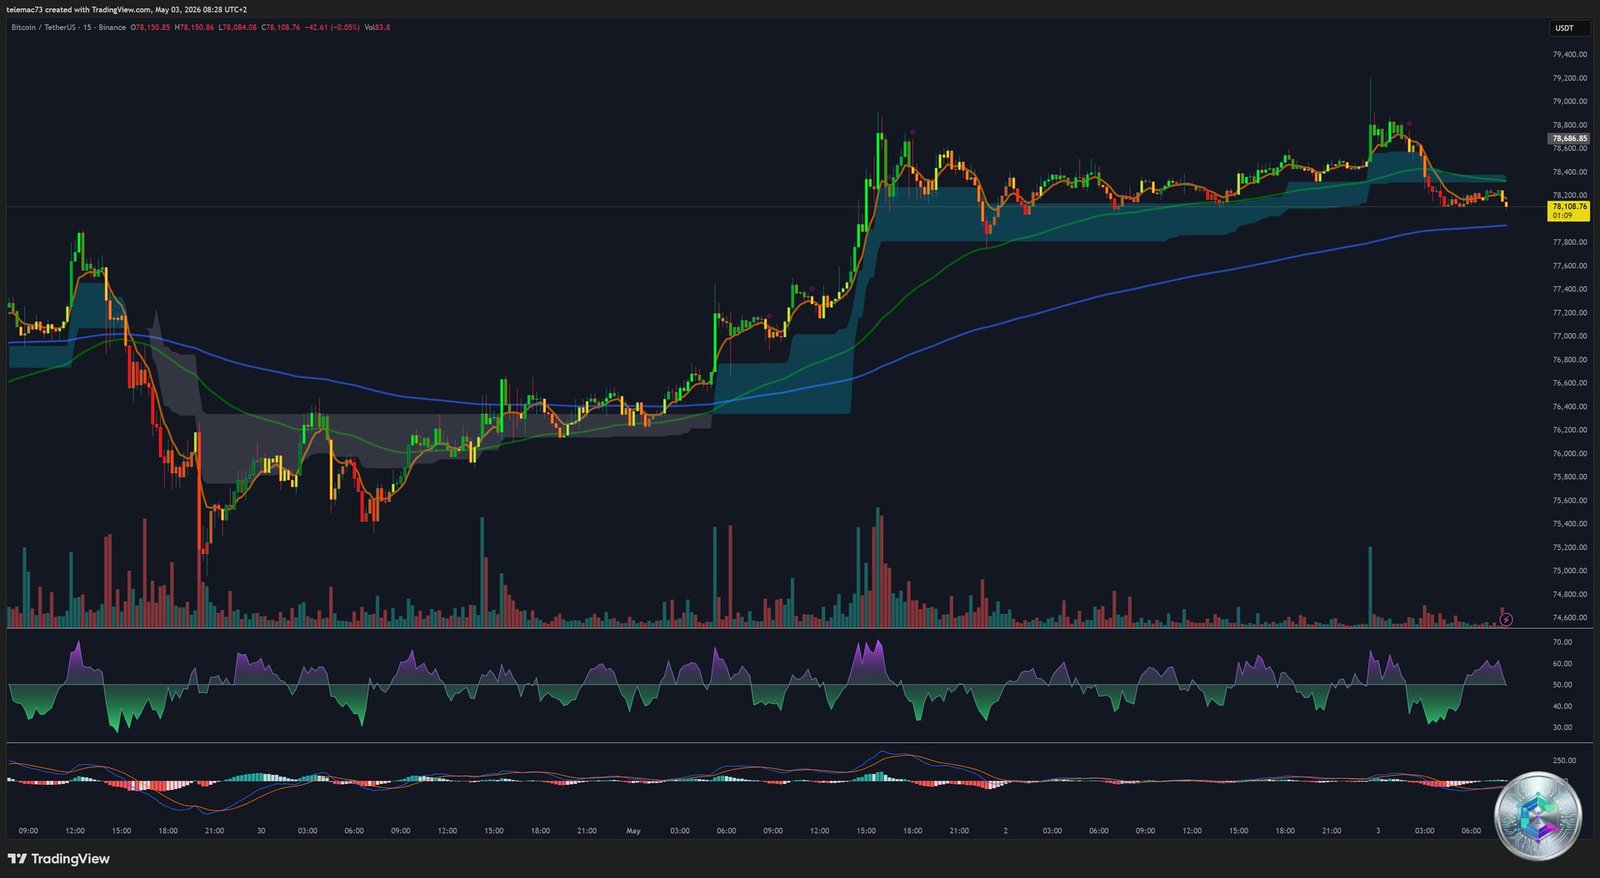
The 15-minute chart depicts an extremely choppy trading environment, characteristic of deep consolidation phases. Around $78,100, Bitcoin has entered a sideways sequence tracing a compression triangle — or potentially a complex Bull Flag: recent highs are progressively lower (lower highs) while lows hold horizontal or slightly ascending levels, signaling a delicate supply-demand equilibrium.
Oscillators confirm this state of stagnation. The RSI oscillates erratically around the neutrality line at 50 without printing extreme readings — the hallmark of a trendless market on the microstructure. The MACD shows its lines intertwined and pinned to the zero line, with a negligible histogram alternating rapidly between green and red. This confluence — neutral RSI, flat MACD, compression triangle — signals accumulating kinetic energy. The first impulsive move accompanied by a significant volume spike will determine the intraday trend direction.
⚔️ The Intermediate Battlefield: 4-Hour Analysis
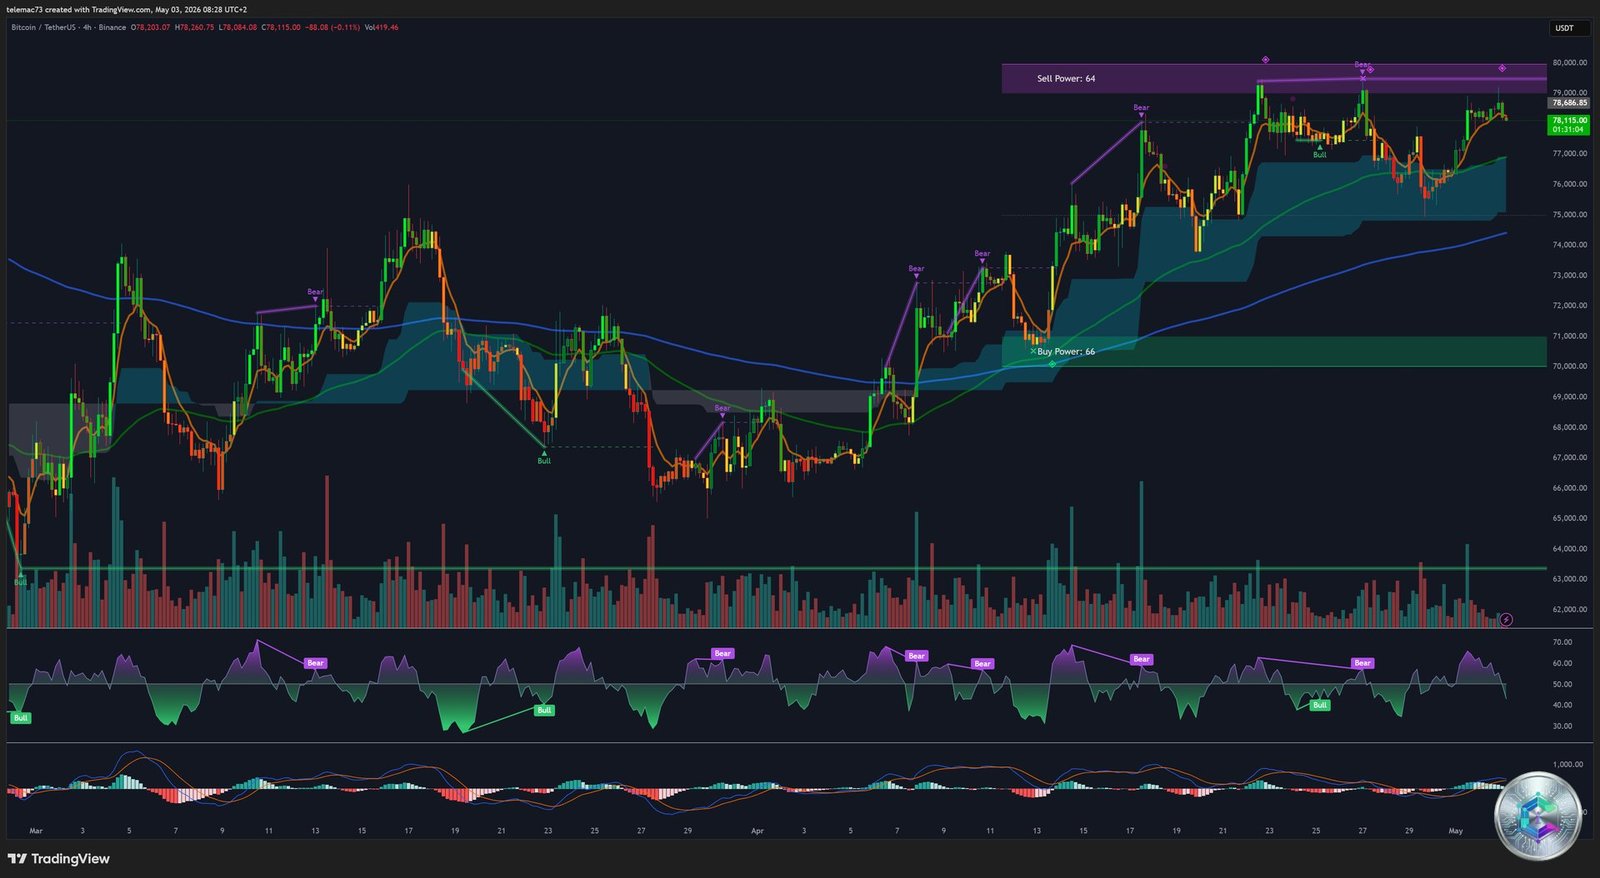
The 4-hour (H4) timeframe is the true battlefield where medium-term momentum is decided. The chart structure reveals an ascending dynamic initiated from a major trough — a series of higher highs and higher lows characteristic of a nascent bullish trend — but violently halted by upper resistances.
A descending trendline has formed from the local peak near $79,200, exerting constant downward pressure. Proprietary flow indicators read « Buy Power: 66 / Sell Power: 61 », indicating a slight dominance of buying absorption despite the corrective price appearance. Price is caught between the 50-period SMA at ~$77,452 and the 100-period SMA — a firm reclaim above the SMA-50 on a 4H close is the sine qua non condition for re-activating a bullish bias.
H4 oscillators reveal underlying weaknesses. A bearish RSI divergence materialized during recent top formation. The MACD displays a Death Cross: the fast line has crossed below the signal line, diving into negative territory with a red histogram. However, the morphology of this decline can be interpreted as a Bull Flag: a bullish breakout above the descending channel, coupled with a Golden Cross on the H4 MACD, would validate this continuation pattern and project price above $80,000.
📅 The Secular Trend: Daily Analysis
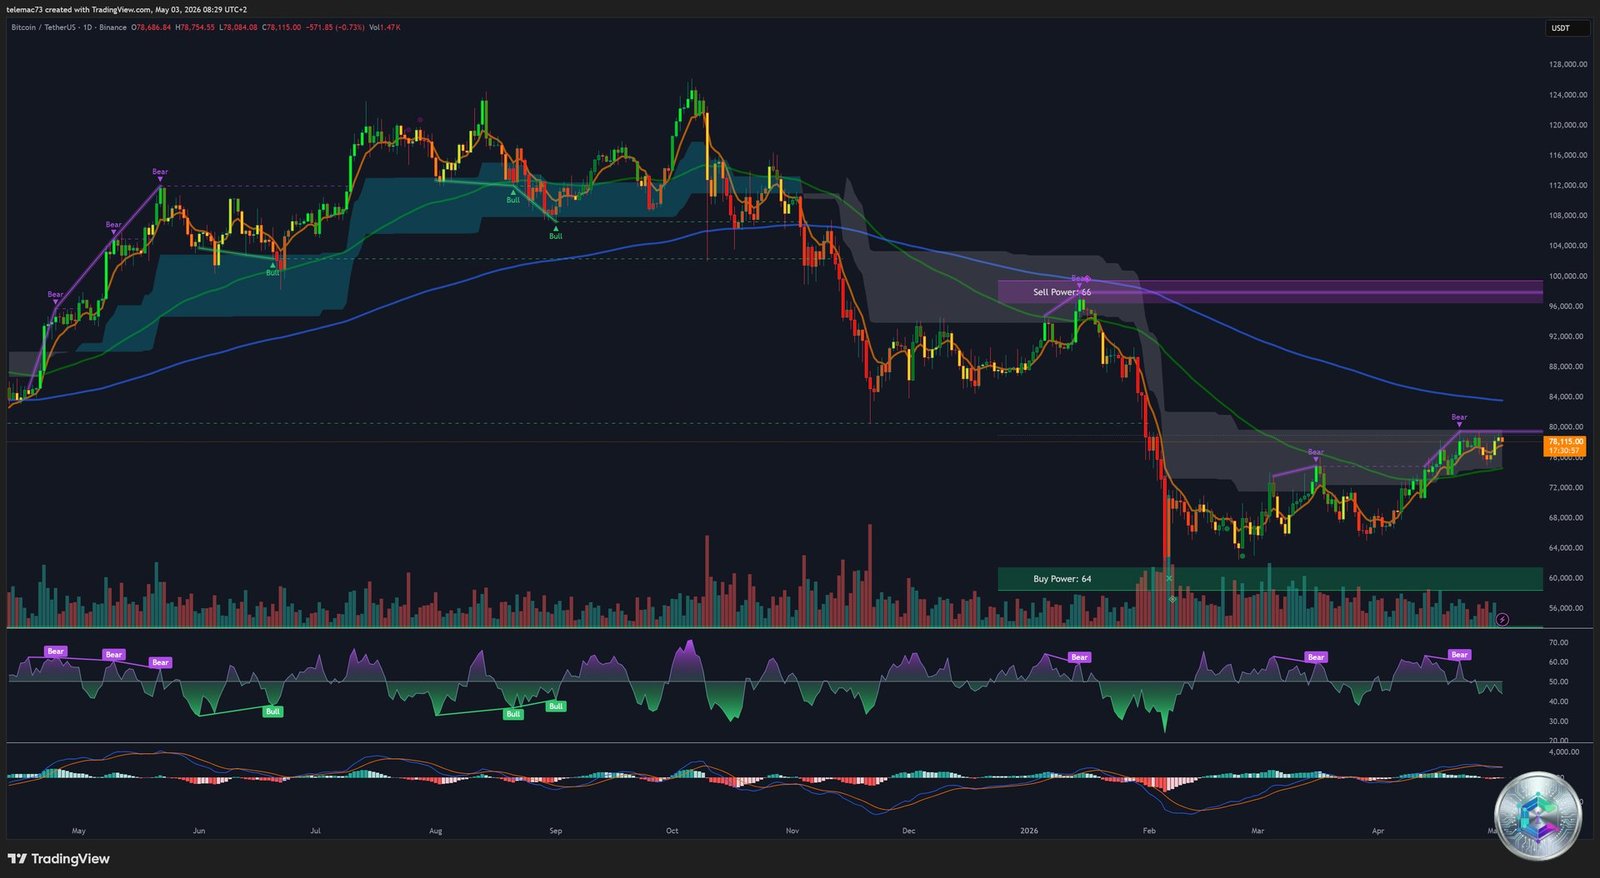
Despite the turbulence observed on lower timeframes, the daily perspective demonstrates that Bitcoin firmly maintains a constructive bullish bias. The asset preserves its structure above two major institutional ramparts: the 100-day EMA (~$75,645) and the 50-day EMA (~$73,660). Consecutive daily closes above the 100-day EMA represent an unequivocal resilience signal, demonstrating that macro-economic buyers systematically absorb supply during perceived opportunistic pullbacks.
A cyclically significant event recently occurred: the retest of the 21-week EMA — the absolute frontier between Bull Markets and Crypto Winters. Bitcoin managed to close marginally above this line, technically validating the resumption of the secular bullish trend. The bearish attack all the way to $73,000 — the top of a prior Double Bottom — was immediately rejected, suggesting a shakeout designed to flush weak hands rather than a genuine trend reversal.
Within the Fibonacci retracement framework, Bitcoin has successfully reclaimed the 38.2% level of its recent impulse. The daily dynamic now points toward the 50% retracement at $78,962 as immediate resistance. A break above this level would open the road to the Golden Pocket at 61.8% — $83,437, ahead of major structural resistance around $84,410.
📊 Quantitative Matrix: Pivot Points & Standard Deviations
Quantitative modeling eliminates cognitive biases inherent to discretionary chart analysis. The table below consolidates key levels computed via pivot points and statistical standard deviation bands for early May 2026:
| Quantitative Metric | Price Level (USD) | Implication |
|---|---|---|
| Modeled Price Target | $78,209 – $78,250 | Short-term price convergence zone |
| Pivot Point / Resistance R1 | $79,168 | Algorithmic validation of bullish breakout |
| +1 Standard Deviation | $78,709 | 68% statistical confinement (frequent test zone) |
| +2 Standard Deviations | $79,055 | 95% statistical confinement (heavy resistance) |
| +3 Standard Deviations | $79,321 | 99.7% statistical anomaly (extreme excess zone) |
| Recent High | $79,155 | Swing high to be cleared for continuation |
The attempted breakout toward $79,200 didn’t merely encounter a chart resistance — it collided with the +2 Standard Deviations barrier ($79,055) and grazed the extreme +3 SD zone ($79,321). Statistically, a move beyond +2 SD has only a 5% probability of occurrence, requiring a massive capital inflow to materialize — perfectly corroborating the supply accumulation identified on the Heatmap in this same zone.
🏦 Macro Catalysts: Halving, ETFs & Institutional Calendar
The Halving-induced supply shock continues to structure the market. Halving the mining block reward dramatically reduces sell-side liquidity as miners adopt retention strategies (HODL). Historically, the 12 months following a Halving constitute the most asymmetrically bullish volatility windows, explaining why dips toward the 21-week EMA are absorbed with such ferocity.
Institutional intervention via Spot Bitcoin ETFs has fundamentally transformed market structure. April 2026 recorded net inflows of nearly $1.97 billion, representing the longest consecutive inflow sequence of the year. The direct consequence: OTC desk reserves show a 30-day change of -20,700 BTC, reaching historical lows not seen since March 2025. This depletion will progressively force large institutional buyers to intervene directly on public exchanges — potentially the final catalyst to shatter the sell wall at $80,000.
May 2026’s institutional calendar is particularly dense: the market actively monitors US Clarity Act deliberations, Fed nominations, Consensus Miami (May 5-7) and the Abu Dhabi Digital Assets Forum (May 13). Meanwhile, significant Token Unlocks across SUI, ENA and other major altcoins — totaling over $670 million in nominal value — could dilute overall ecosystem liquidity in the short term.
🎯 Conclusion: Two Scenarios, One Pivot Point at $78,000
The synthesis of this three-dimensional analysis highlights the imminence of a directional volatility dislocation. Bitcoin is currently imprisoned in a near-perfect compression structure. Two trajectories clearly emerge from the statistical noise:
🟢 Bullish Scenario (Breakout)
This scenario rests on the preservation of daily EMAs (50 and 100-day) and the resilience of the 21-week EMA. The technical trigger would be a confirmed breakout above the H4 SMA-50 (~$77,452), combined with a compression structure break on the 15-minute chart. If price attacks the +2 Standard Deviations zone ($79,055) with velocity, the colossal concentration of short liquidation orders above $80,000 will ignite: the Short Squeeze would mechanically propel BTC toward the Fibonacci pockets at $82,353 and then $83,437.
🔴 Bearish Scenario (Breakdown)
Invalidation is conditioned by the inability to pierce the $79,000 wall. Should buying pressure capitulate below the critical threshold of $75,000, forced long liquidations would trigger a plunge toward the $73,000 support. Failure to defend this steel rampart would validate an Elliott Wave C configuration, imposing a deep structural correction targeting the accumulation zones between $60,000 and $70,000.
In conclusion, the market is navigating a Squeeze-type compressed volatility regime. The outcome of the millimetric confrontation around the $78,000 axis — between ETF fundamental liquidity and the algorithmic sell wall — will set the topography of Bitcoin’s next major secular move.
⚠️ Disclaimer: This article is written for educational and informational purposes only. It does not constitute investment advice, nor a recommendation to buy or sell any digital asset. Cryptocurrency markets are extremely volatile and carry significant risk of capital loss. Only invest what you can afford to lose, and consult a qualified financial professional before making any investment decision.