
As of April 28, 2026, Bitcoin (BTC) is trading in a tight range between $76,800 and $77,800, suspended at the precarious equilibrium of a massive ascending triangle. Markets are holding their breath ahead of two potentially historic catalysts: a possible Strategic Bitcoin Reserve announcement from the White House, and the Federal Reserve’s monetary policy decision scheduled for April 29. A comprehensive analysis of the forces at play.
A Painful Q1 2026, But Remarkable Resilience
The year 2026 began under dark auspices. The first quarter erased approximately 23% of Bitcoin’s value — the worst opening quarterly performance since the 2018 bear market. After peaking at an all-time high of $126,272 on October 6, 2025, the asset plunged to a low of $60,057 on February 6, 2026 — a discount of nearly 39% from its absolute zenith.
Yet since that February floor, Bitcoin has staged a vigorous technical rebound of nearly 30%, underpinned by robust institutional demand and continuous inflows into spot Bitcoin ETFs. Total crypto market capitalization stands at approximately $2.65 trillion, with BTC dominance hovering around 58% — a classic flight-to-quality dynamic within the digital asset class itself.
Macroeconomic Context: Stagflation, Trade Wars, and Geopolitical Risk
The global macroeconomic environment remains particularly hostile to risk assets. The Federal Reserve maintains its benchmark rates in an elevated range of 3.50%–3.75%, fueled by persistent inflation compounded by the energy crisis stemming from the U.S. naval blockade on Iranian ports. Crude oil prices are periodically brushing against the psychological threshold of $100 per barrel, raising the specter of global stagflation.
Paradoxically, since the formal onset of hostilities involving Iran on February 28, 2026, Bitcoin has appreciated 19% — significantly outperforming both the S&P 500 and physical gold over that window. This major behavioral divergence suggests that a growing fraction of institutional capital is reconsidering BTC as a sovereign, uncensorable hedge against systemic geopolitical risk — a fundamental paradigm shift.
Adding to this, the « Liberation Day » trade war imposed by the U.S. administration targets more than fifty countries with tariffs ranging from 10% to 50%. These protectionist measures exacerbate inflationary pressures and paradoxically reinforce Bitcoin’s investment thesis as a store of value with a mathematically fixed supply.
Institutional Adoption: Strategic Reserve and Imminent Supply Shock
April 2026 marks a fundamental turning point in Bitcoin’s sovereign integration. At the Bitcoin 2026 conference in Las Vegas (April 27–29), Patrick Witt, official White House advisor for digital assets, sent explicit signals regarding the imminent creation of a Strategic Bitcoin Reserve at the U.S. Treasury level. If the world’s largest economy begins formally accumulating BTC, a game-theory chain reaction across global central banks could be triggered.
On the corporate front, MicroStrategy now holds 815,061 BTC valued at approximately $64 billion. Spot Bitcoin ETFs recorded nine consecutive days of net inflows at end of April. Exchange reserves have fallen to 2.672 million BTC — their lowest level since 2017. Whales (wallets holding >100 BTC) accumulated 45,000 BTC in the single week ending April 18 — the largest weekly accumulation since July 2025. The mechanics of a supply shock are slowly materializing.
Derivatives Markets and Heatmap: Extreme Tension
Derivatives market analysis reveals rare mechanical tension beneath the surface. Aggregate Open Interest retreated from $34.02 billion on April 22 to approximately $32.89 billion, signaling a healthy deleveraging of over-leveraged positions. More revealing: perpetual futures funding rates have shifted firmly negative, oscillating between -0.0099% and -0.021%. Short sellers are paying a premium to long holders — an ideal configuration for a violent Short Squeeze if spot demand manages to push above $78,000.
However, the Coinbase Premium Index — measuring the price differential between Coinbase (U.S. institutions) and Binance (offshore) — collapsed from 0.064 to just 0.020, indicating a temporary pause in aggressive U.S. institutional buying ahead of the Fed decision.
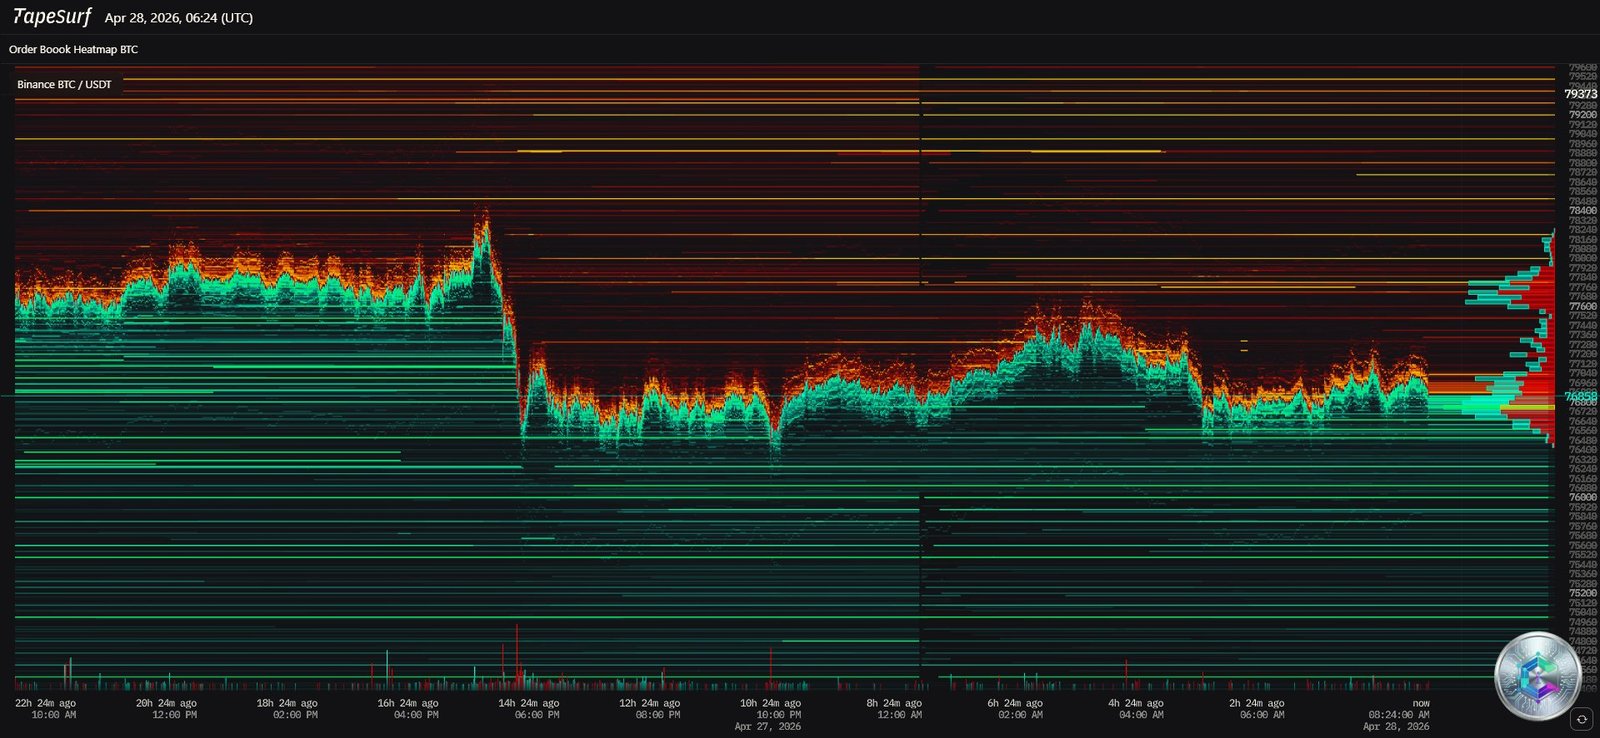
The order book heatmap paints a crystal-clear picture of market structure. A titanic sell wall is stacked between $79,500 and $80,500 — under-pressure miners and institutional profit-takers concentrate their limit orders there. On the downside, a massive buy wall between $73,000 and $74,000 reflects late institutional capital and mean-reversion algorithms. The intermediate zone ($76,000–$78,000) is relatively thin, explaining the brutal 2%–3% intraday swings.
Technical Analysis — Daily Chart (1D)
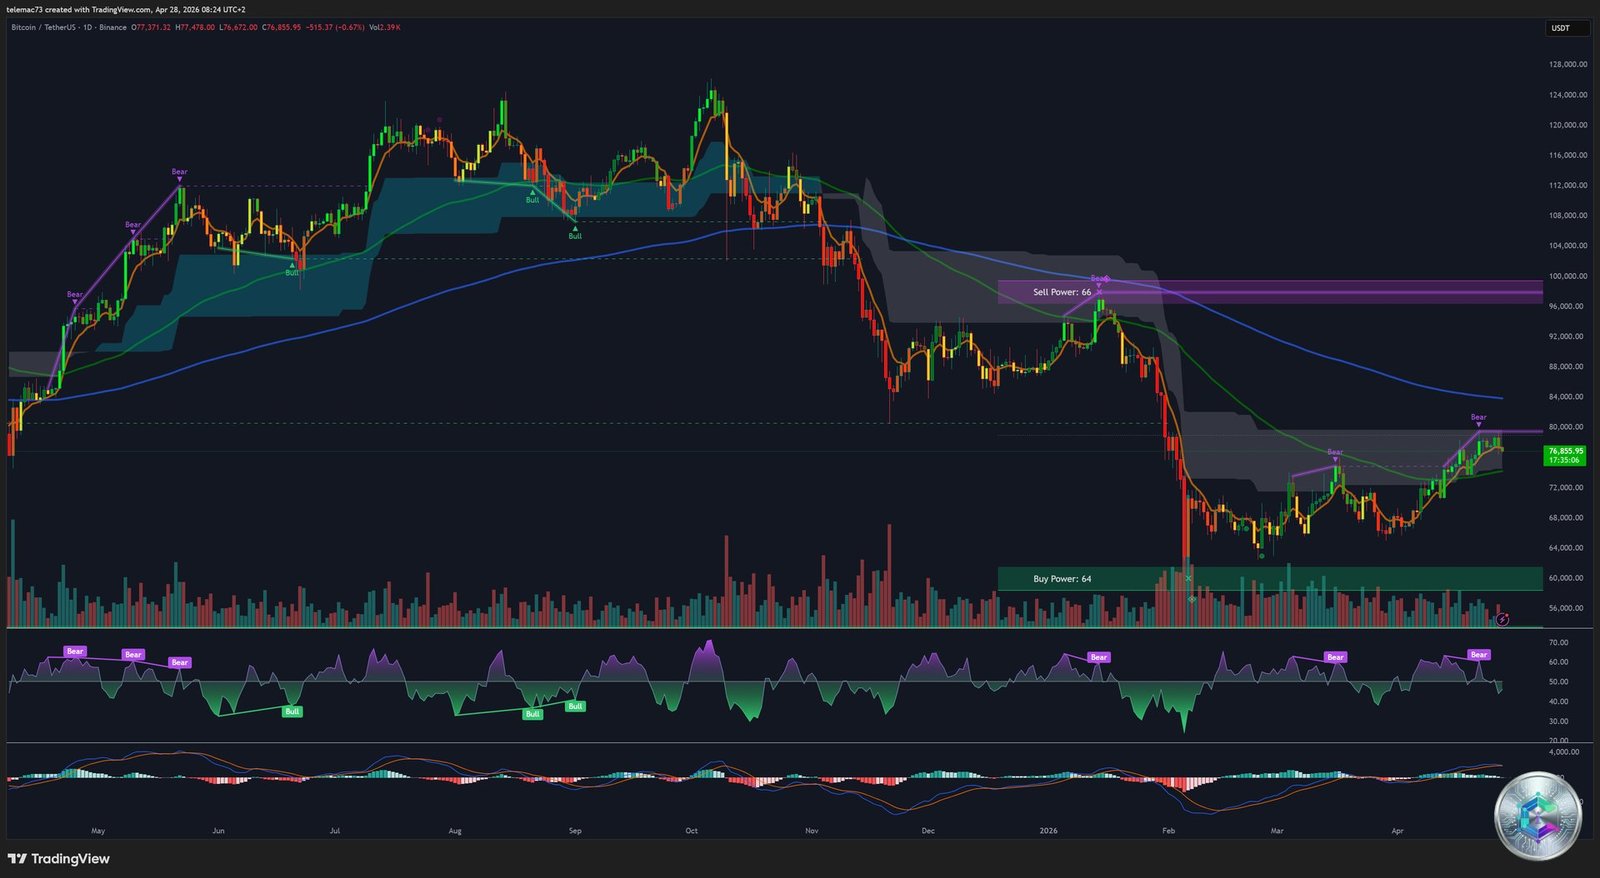
The daily chart reveals the market’s dominant structure: a large-scale Ascending Triangle. The horizontal resistance sits precisely at $80,000 (a psychological glass ceiling coinciding with the Heatmap’s sell wall), coupled with an ascending lower trendline connecting successive higher lows since February: $60,000 → $63,000 → $73,000.
Bitcoin holds above its 200-day SMA (~$77,141) — undeniable technical proof that the secular bullish trend remains intact. The EMA 50 (~$70,000–$72,000) remains above the EMA 200, preserving the macro Golden Cross. However, the daily MACD shows a Death Cross with an expanding negative histogram (-102.1), confirming that momentum is temporarily dominated by sellers. The RSI 14 sits at 43.29 — neutral to slightly bearish — but with an enormous runway before reaching overbought territory, which paradoxically constitutes a hidden strength signal.
A confirmed breakout above $80,000 mathematically projects a target in the $85,000–$90,000 region. To the downside, the SMA/EMA 200 (~$72,850) represents the first institutional floor.
Technical Analysis — 4-Hour Chart (H4)
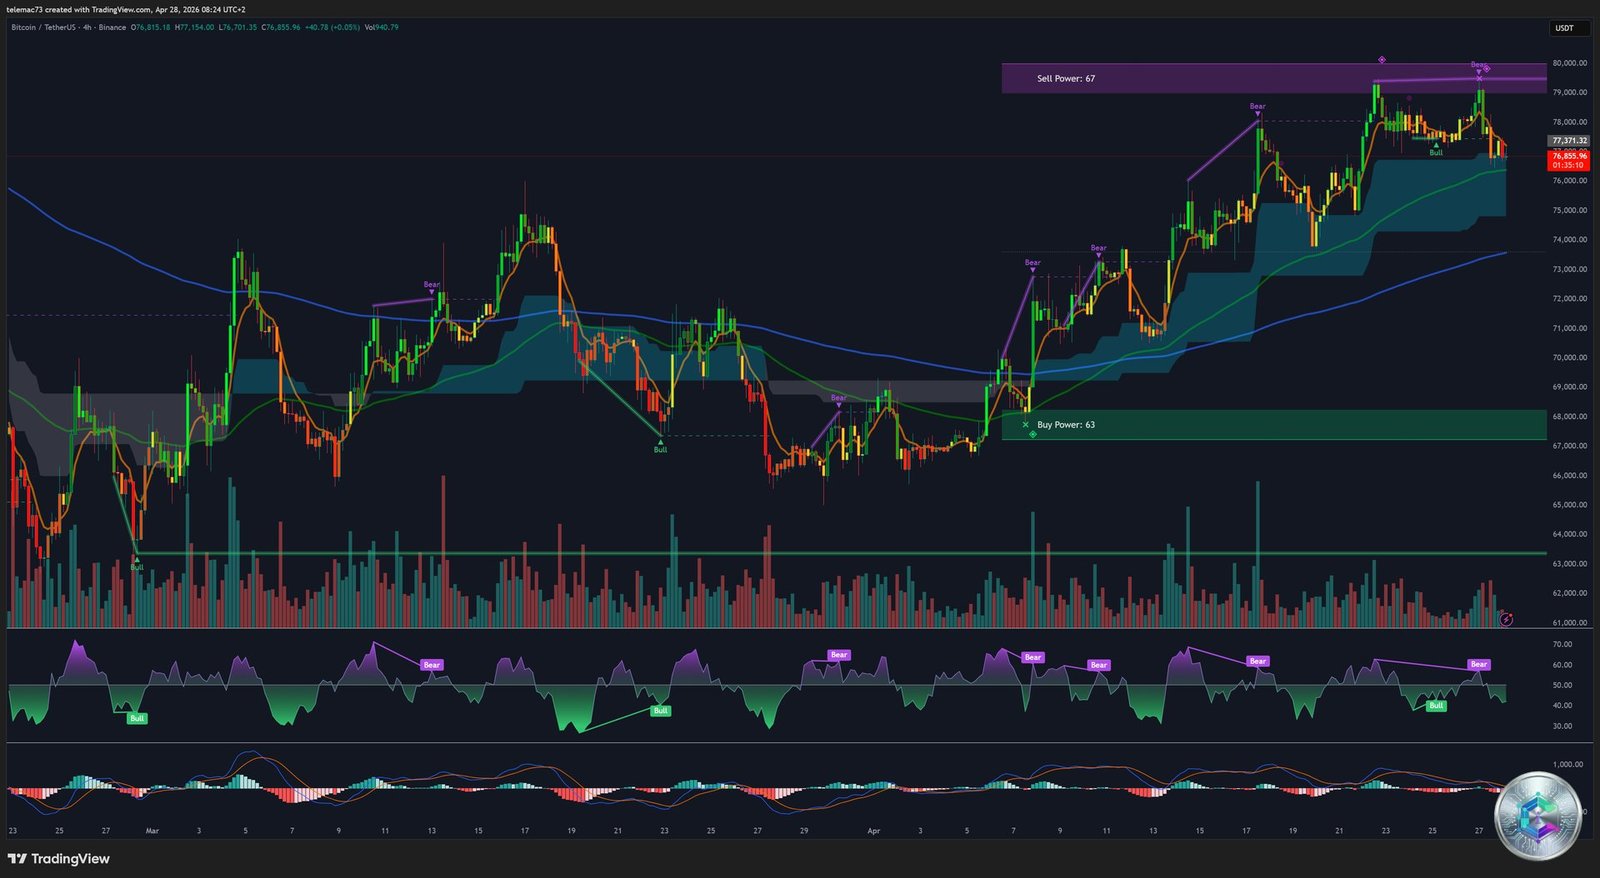
On the 4-hour timeframe, price action has been contained within a well-defined ascending channel. Following a severe rejection during a failed attempt to break $80,000, the asset is undergoing an orderly pullback morphologically resembling a Bull Flag continuation pattern — a classic consolidation setup before resuming the dominant bullish trend.
The 21-period H4 SMA (~$77,000) acts as the key dynamic float line. A H4 close above this level opens targets at $78,500, then $79,600. Conversely, a decisive break below the lower channel boundary (~$75,000) would invalidate the short-term bullish structure and reopen the path to the H4 EMA 200 at ~$72,850 — a zone that coincides with the Heatmap’s buy wall.
Micro-Structure — 15-Minute Chart (15m)
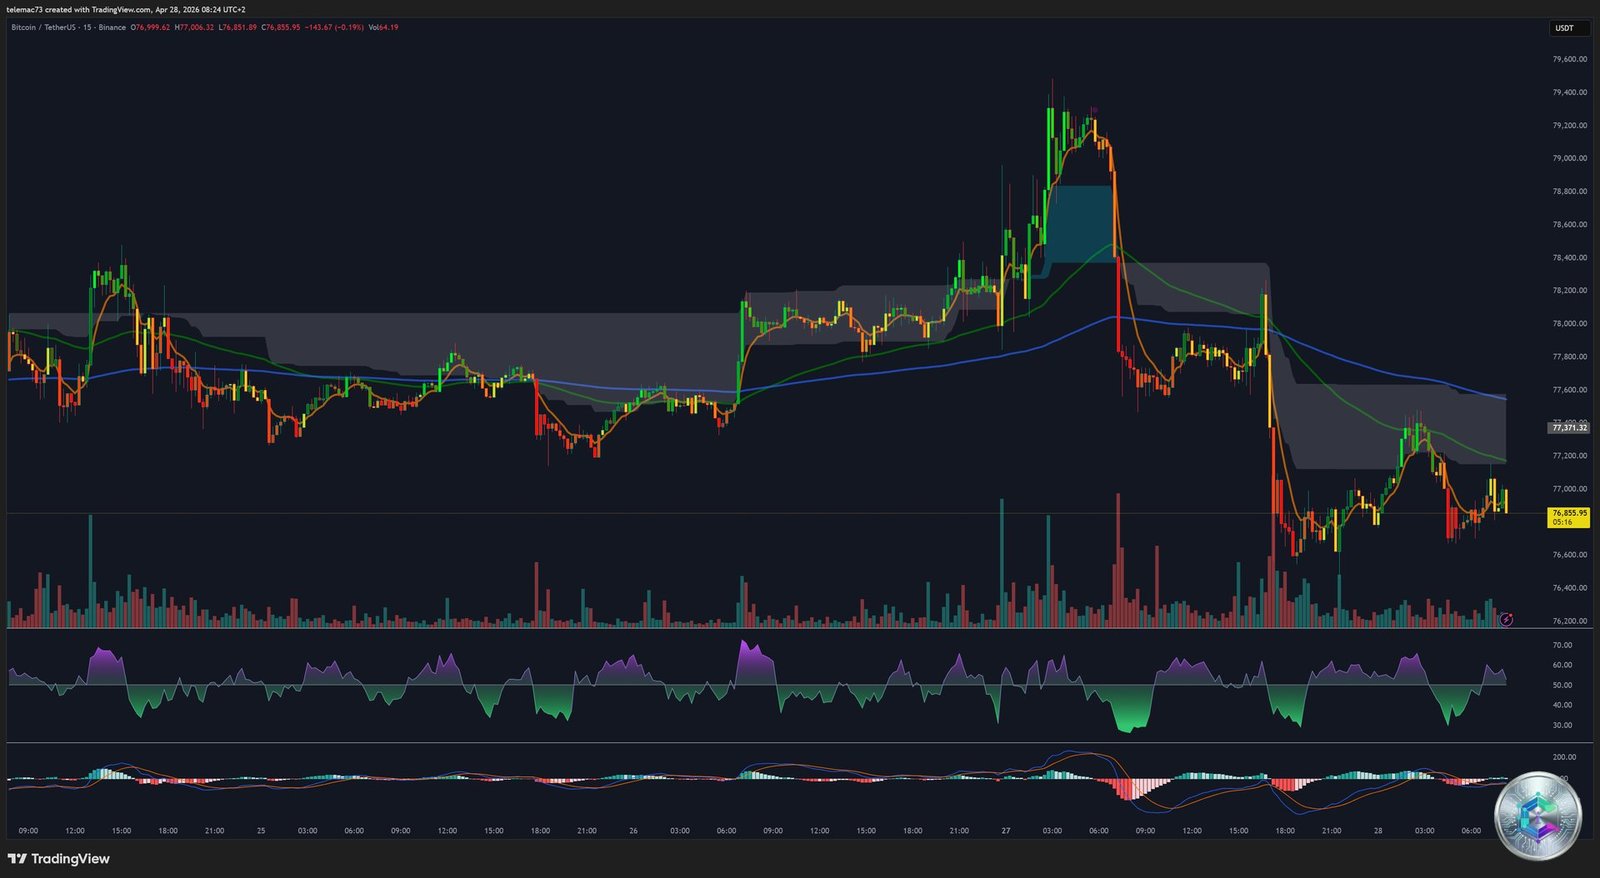
The 15-minute chart exposes the microstructure dominated by high-frequency trading algorithms (HFT). Price action forms successive compression triangles while Bollinger Bands tighten into Squeeze mode — systematically forecasting an imminent directional energy release. Fast moving averages (EMA 5/10) alternate relentlessly above and below EMA 20/50, the clinical symptom of a market deeply range-bound between $76,500 and $78,200.
For institutional or position traders, this timeframe serves exclusively for entry and exit optimization — directional bias remains defined by H4 and Daily charts.
Critical Pivot Points — April 28, 2026
The unanimous convergence of four calculation methods (Classic, Fibonacci, Camarilla, Woodie) around a central pivot of $77,800 is a remarkable mathematical singularity that elevates this level to the absolute inflection point of the trading session.
| Method | S2 | S1 | Pivot (P) | R1 | R2 |
|---|---|---|---|---|---|
| Classic | $77,469 | $77,633 | $77,800 | $77,964 | $78,131 |
| Fibonacci | $77,595 | $77,674 | $77,800 | $77,926 | $78,005 |
| Camarilla | $77,736 | $77,767 | $77,800 | $77,827 | $77,858 |
| Woodie | $77,468 | $77,631 | $77,799 | $77,962 | $78,130 |
Sustained trading below $77,800 keeps the intraday bearish bias active. Resistance R1 at $77,964 is the first kinetic barrier to clear before contemplating a new assault on $80,000. In a total structural breakdown scenario, a last-resort macroeconomic support is identified near $71,948.
Price Scenarios: May–June 2026
🟢 Bullish Scenario — Parabolic Breakout (Preferred probability over medium term)
The primary catalyst: the official White House announcement of a Strategic Bitcoin Reserve. Mechanically, solid support holding at the $76,000 zone (H4 EMA 200) followed by an accommodative Fed signal would trigger an aggressive breakout above $78,000. CTA algorithms would flood in, igniting the Short Squeeze. Shattering the $80,000 resistance would propel price into a structurally unobstructed zone up to the long-term SMA 200 projected at $85,500, with the ascending triangle’s mathematical target anchored at $90,000.
🔴 Bearish Scenario — Capitulation and Purge (Asymmetric short-term risk)
Repeated failure to breach $80,000 exhausts buying energy. A confirmed breakdown below $74,000 would trigger cascading liquidations of leveraged long positions. Price would slide toward the major institutional support zone between $68,750 and $72,850 (macro SMA/EMA 200). Such a purge, while painful, would recreate optimal accumulation conditions for a second-half 2026 recovery.
Conclusion: The Asymmetry of This Moment
Bitcoin stands at a critical crossroads as April gives way to May 2026, pulled between forces of titanic proportions. The systemic drain of exchange supply, aggressive whale accumulation, ongoing institutional validation, and the prospect of unprecedented sovereign adoption create a fundamentally upward-oriented return asymmetry over the medium term. Any weakness pushing prices toward $72,000–$74,000 should be interpreted structurally as a transient price inefficiency — not the return of a bear market.
In the short term, however, technical mechanics demand caution: the negative daily MACD and fading Coinbase Premium require strict risk management and measured directional exposure while awaiting the triangle’s compression resolution.
⚠️ Disclaimer: This article is published for informational and educational purposes only. It does not constitute investment advice, a recommendation to buy or sell, or an inducement to invest in digital assets or any other financial instrument. Cryptocurrency markets are highly volatile and carry the risk of total capital loss. Only invest what you can afford to lose and consult a licensed financial advisor before making any investment decision.