
April 22, 2026 — Bitcoin is consolidating around the critical threshold of $77,500 against a backdrop of intense macroeconomic pressure. US-Iran geopolitical tensions, sticky inflation, and a hawkish Federal Reserve narrative are all weighing on risk assets. Yet the digital asset holds firm, underpinned by record-breaking institutional accumulation. A complete multi-timeframe deep dive.
Macroeconomic Context: Inside the Eye of the Storm
The expiration of the US-Iran two-week ceasefire agreement — with critical negotiations currently underway in Islamabad — is casting a long shadow over global financial markets. The American naval blockade of Iranian ports and the resulting strategic paralysis in the Strait of Hormuz have triggered a violent repricing of energy markets: Brent crude settled above $95/barrel with intraday spikes flirting with $98. This energy surge feeds directly into inflationary pressure, with the US CPI posting a 3.3% annual increase in March 2026, driven by a 12.5% surge in energy costs.
In response to this inflationary stickiness, futures markets now price a 99.5% probability of the Fed holding rates steady in the 3.5%–3.75% range at the upcoming FOMC meeting. Kevin Warsh’s confirmation hearing before the Senate Banking Committee reinforced this hawkish bias, dashing hopes of any politically motivated rate cuts. Despite a brief intraday dip to $75,500 following Warsh’s remarks, Bitcoin absorbed the pressure and snapped back to $77,500 — illustrating a fundamental paradigm shift: Bitcoin is no longer a fringe speculative asset but a bona fide macro hedge instrument.
The most telling signal remains the divergence between price action and sentiment. The Fear & Greed Index sits firmly in extreme fear territory (21–33/100) while price holds near local highs. This dissociation reveals a massive transfer of positions from retail investors toward institutional entities with long-term mandates and structurally different risk tolerances — steadily improving the quality of the holder base.
Microstructure Analysis: The Liquidity Heatmap
Analyzing the order book via the liquidity heatmap (Binance BTC/USDT, TapeSurf) reveals a profoundly asymmetric market architecture. On the supply side, a massive sell wall has formed between $78,000 and $80,000, with peak concentrations around $79,000 and the decisive psychological threshold of $80,000. These limit sell orders — visualized as thick warm-colored (red-orange) horizontal bands — effectively cap any spontaneous bullish impulse.
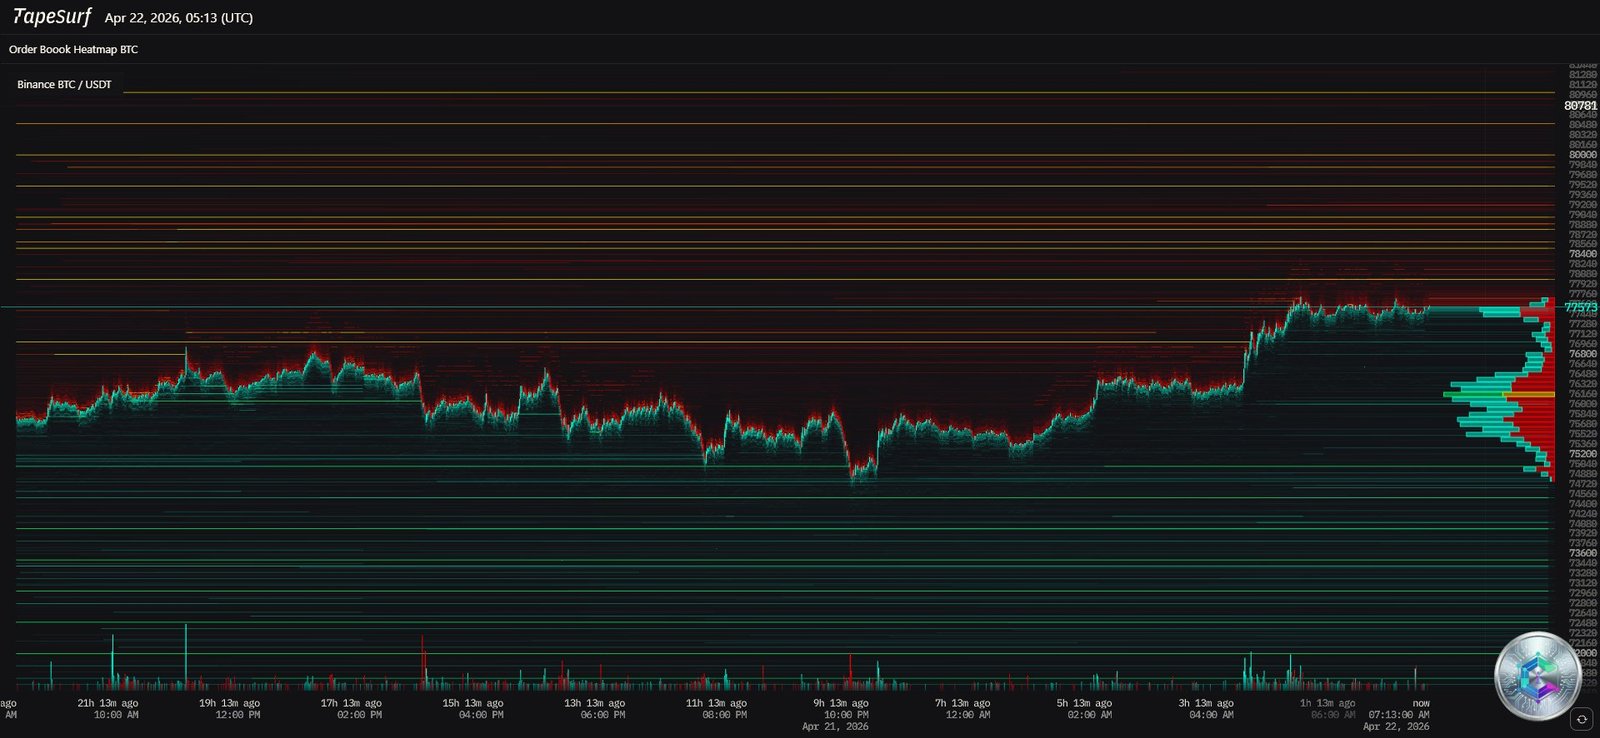
On the demand side, buy limit orders appear around $76,000 and more densely near $74,000, though visually less impenetrable than the upper resistance wall. The Volume Profile Point of Control (POC) sits precisely at $77,500, confirming a short-term fair value consensus where buying and selling forces are temporarily balanced.
Two critical data points complete the picture: over $2.22 billion in long liquidations are clustered below $73,610, forming a potential « trapdoor » that could trigger a cascade toward $65,000–$70,000 if breached. Conversely, approximately $913 million in short liquidations lurk in the $78,000–$81,264 range, ready to fuel an explosive short-squeeze on any bullish breakout. The negative funding rate sustained for a record 46 consecutive days — the longest streak since the FTX collapse in late 2022 — underscores this historic short concentration and the coiled upside energy.
Daily Chart (1D): The Long-Term Trend
The daily timeframe provides the panoramic view required to assess the underlying structural bias. The severe capitulation episode — a series of large bearish candles marking a « speed-run bear market » — terminated with the formation of a solid bottom, followed by a sharp V-shaped recovery. This pattern is characteristic of markets where strongly capitalized entities absorb retail selling pressure as a discounted accumulation opportunity.
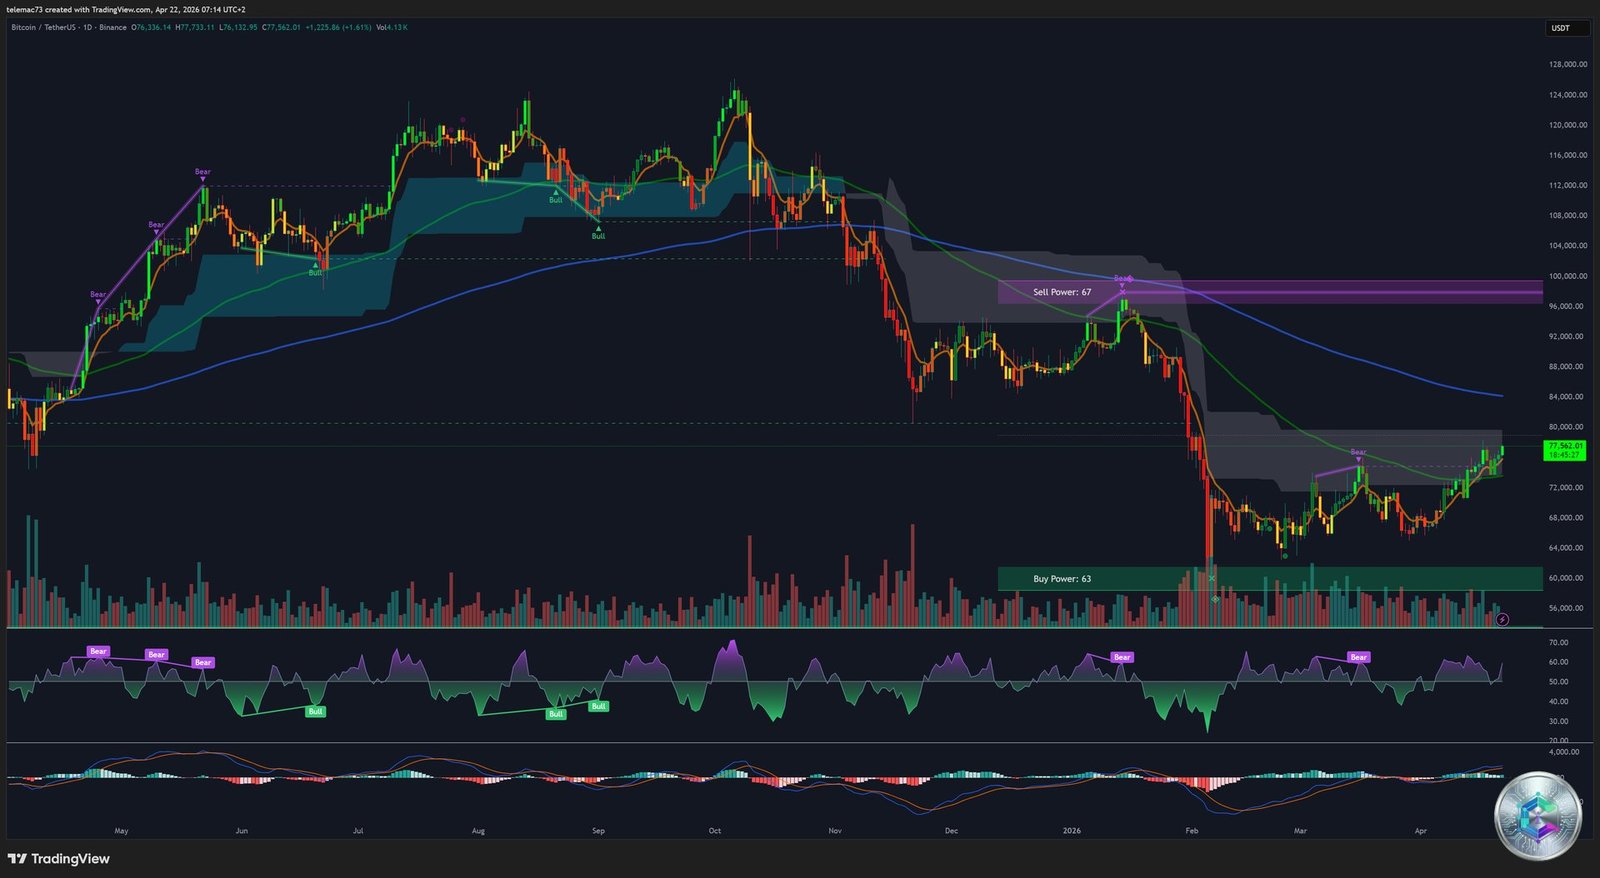
The moving average structure is particularly telling: Bitcoin trades above its 200-day SMA — the gold standard long-term bullish technical signal — while forming a « support sandwich » between the 50-day and 100-day MAs at $70,000–$74,000. The daily RSI has emerged from oversold territory and now sits in the constructive 50–60 range, providing technical runway for a continued rally. The daily MACD is approaching a bullish Golden Cross — historically a powerful signal of bull cycle expansion. A purple resistance block stretches from $78,000 to $80,000, representing the glass ceiling that must be broken to unlock the next structural move.
4-Hour Chart (4H): The Intermediate Trend
The 4H timeframe provides the tactical granularity needed for week-scale positioning decisions. Price is progressing within a well-defined ascending channel, connecting higher lows and higher highs. The current formation closely resembles a bull flag — a continuation pattern that forms after a strong directional impulse, where price consolidates laterally or slightly downward before statistically resolving with an upside breakout projecting toward $80,000–$85,000.
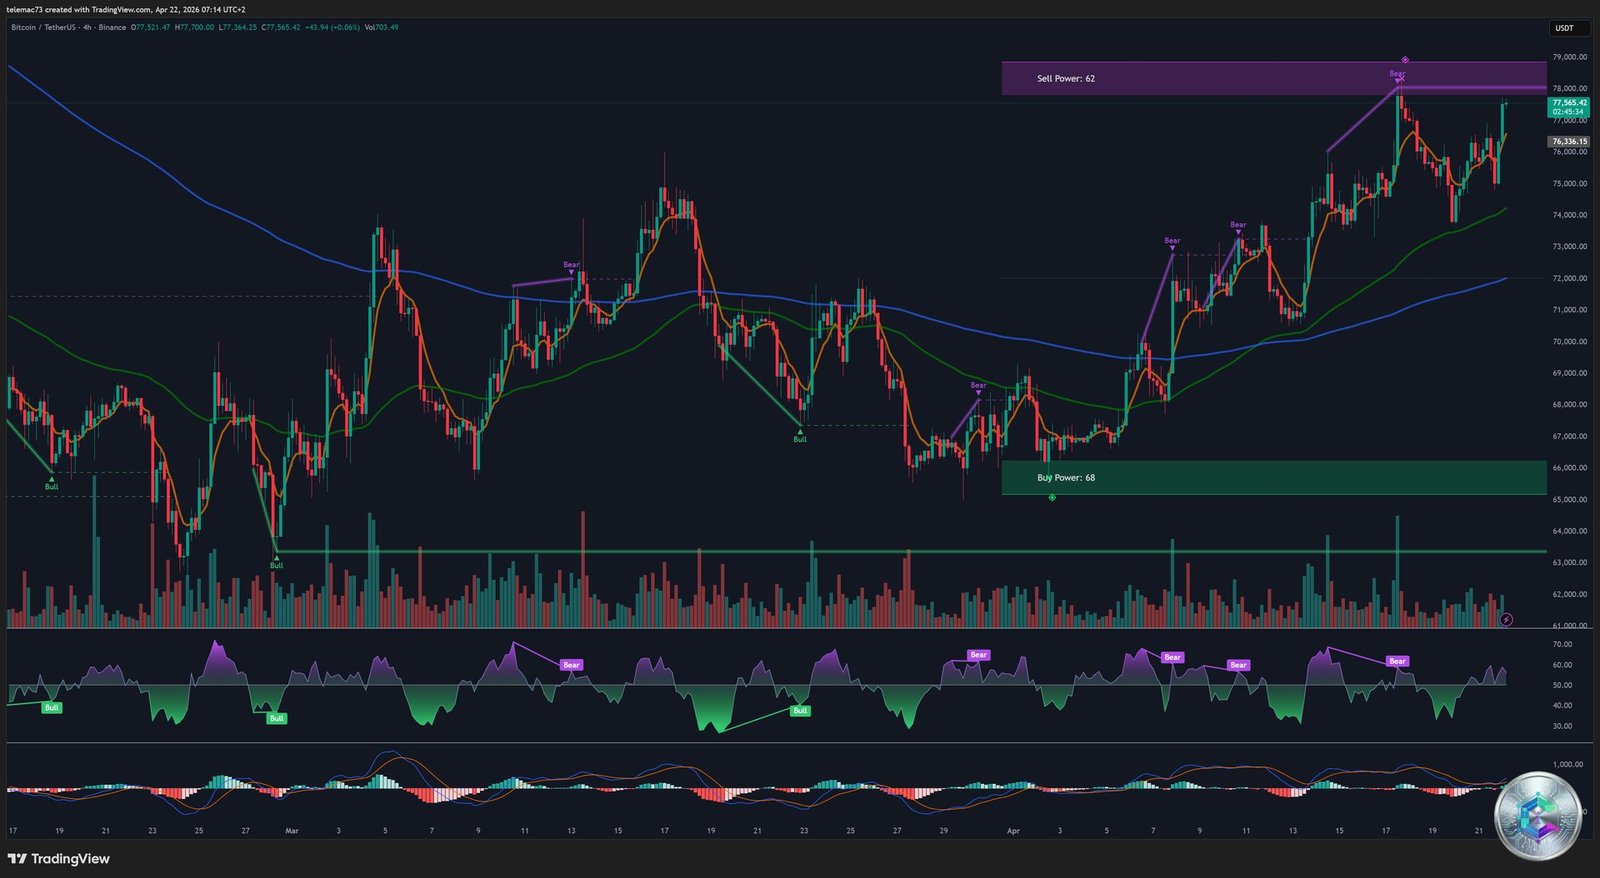
However, a critical nuance demands attention: the 4H MACD is forming a nascent bearish crossover (Death Cross), with the histogram flipping to negative territory. This discordance between constructive price action (bull flag) and deteriorating momentum (exhausting MACD) creates acute directional tension. Buy Power reads at 68 vs. Sell Power at 62 — buyers have the edge, but it is not yet decisive. Should consolidation persist without clearing $77,500, the risk of bull flag invalidation and a pullback toward the 4H EMA 50 near $74,600 grows materially.
15-Minute Chart (15m): Intraday Microstructure
The 15-minute chart dives into the DNA of high-frequency algorithmic trading. Recent price action features numerous long wicks — the signature of liquidity-hunting algorithms probing stops on both sides of the market. The most significant formation is a symmetrical compression triangle: descending resistance connecting lower highs and ascending support connecting higher lows compress price into an increasingly narrow range.
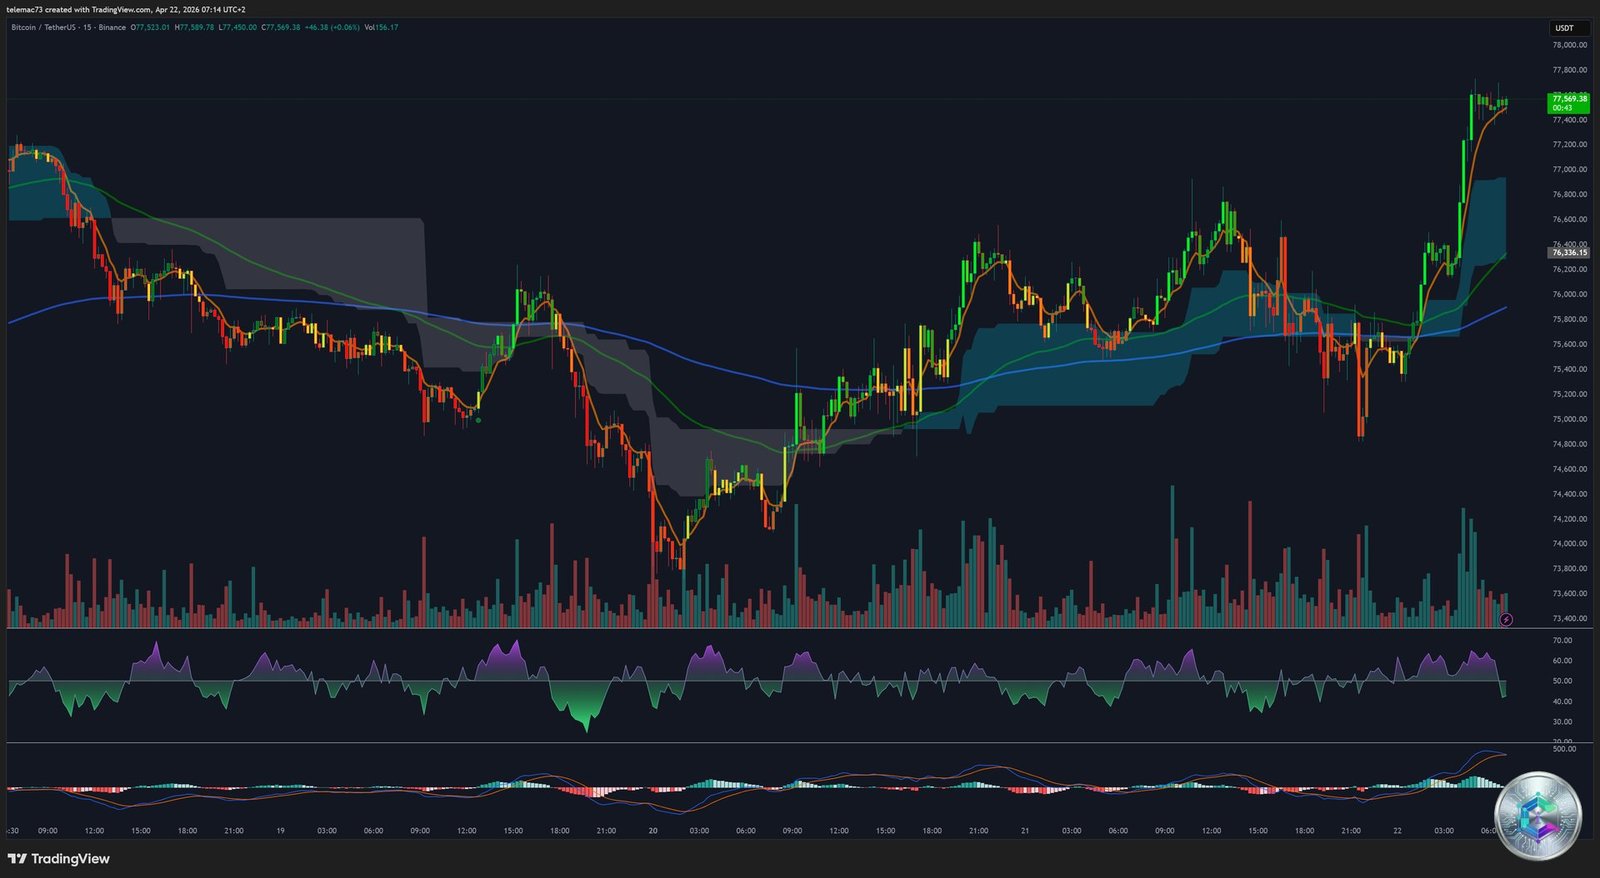
The 15m MACD oscillates erratically around the zero line; the RSI hovers near 50 — zero directional conviction. This triangle, like a coiled spring, is the precursor to an explosive move. For scalpers, the imperative is patience: wait for a decisive breakout confirmed by a volume spike before committing to directional exposure. Fakeouts are the dominant risk in this compression environment.
Institutional Flows and ETFs: The Safety Net
Technical analysis cannot exist in a vacuum — it is perpetually conditioned by fundamental capital flows. The week preceding April 22 saw US spot Bitcoin ETFs record net inflows of $996.4 million — the strongest weekly performance since mid-January — bringing the three-week consecutive inflow total to over $1.8 billion. BlackRock’s IBIT fund alone captured $906 million of those weekly flows. Morgan Stanley’s newly launched MSBT ETF accumulated $139 million in just nine trading days, demonstrating Wall Street’s ability to channel affluent client assets into Bitcoin at scale.
On the corporate treasury front, MicroStrategy added 34,164 BTC to its balance sheet ($2.54 billion), bringing total holdings to a staggering 815,061 BTC — surpassing IBIT’s reserves to become the single largest individual Bitcoin holder on the planet. This systematic institutional and corporate absorption removes liquid supply from exchanges, engineering a structural supply shock. The resulting rising price floor — increasingly resistant to macro headwinds — is the direct mechanical consequence of this sustained accumulation.
Key Technical Levels
| Zone | Price (USD) | Analytical Basis |
|---|---|---|
| 🎯 Major expansion target | $82,133 – $84,410 | Fibonacci 161.8% extension + R3 long-term pivot — confirms new super-cycle |
| 🔴 Psychological resistance | $80,000 – $80,734 | Major mental threshold, R2 Pivot — requires a powerful exogenous catalyst |
| 🔴 Immediate resistance | $77,500 – $78,197 | 4H channel upper boundary — breach activates short-squeeze |
| ⚖️ Pivot zone | $74,500 – $75,000 | Current center of gravity — intraday bullish/bearish barometer |
| 🟡 Critical support | $73,610 – $74,145 | 100-day EMA + long liquidation cluster — « trapdoor » if lost |
| 🟢 Structural support | $70,000 – $70,650 | 50-day EMA — institutional accumulation zone (support sandwich) |
| 🟢 Macro floor | $63,000 – $65,000 | Capitulation low — last line of defense for the multi-year bull trend |
Probabilistic Scenarios
🟢 Bull Case — Geopolitical Resolution and Flow Dominance
A diplomatic de-escalation between the US and Iran would deflate energy risk premia and dampen inflation expectations. In this risk-on environment, the 4H bull flag resolves with a decisive break above $77,500, igniting a short-squeeze that burns through $913 million in short positions. Sustained by record weekly ETF inflows and the forming daily MACD Golden Cross, Bitcoin rapidly targets the Fibonacci confluence zone at $82,133–$84,000 and potentially makes a run at new all-time highs.
🔴 Bear Case — Monetary Pressure and Liquidation Cascade
Failed diplomatic negotiations would sustain the Strait of Hormuz blockade and entrench inflationary forces. The Fed’s hawkish stance deepens, the DXY rallies, and global liquidity contracts. The 4H MACD Death Cross is confirmed, the 15m triangle breaks lower, and price slices through the $75,000 pivot then the critical $73,610 support. This breach detonates the « trapdoor »: over $2.22 billion in forced long liquidations cascade the price toward the 50-day EMA at $70,500 — or in an extreme risk-off scenario, retests the macro foundation at $63,000–$65,000, offering a generational accumulation opportunity for deep-pocketed corporate treasuries.
Conclusion
On April 22, 2026, Bitcoin embodies a striking paradox: structurally bullish thanks to unprecedented institutional adoption, yet constrained by intense macro forces that cap short-term upside potential. The $77,500 zone is the absolute barometer: its conquest opens the door to new all-time highs; its loss triggers a liquidation cascade. Watch $73,610 on the downside and $78,000 on the upside as the decisive trigger levels for the resolution of this high-stakes standoff.
⚠️ Disclaimer: This article is written exclusively for educational and informational purposes. It does not constitute investment advice or a recommendation to buy or sell any cryptocurrency. Digital asset markets are highly volatile and carry a significant risk of capital loss. Only invest what you can afford to lose and consult a qualified financial advisor before making any investment decision.