
Analysis published May 2, 2026 — BTC/USDT
1. Market Overview: Bitcoin at a Critical Decision Zone
As of May 2, 2026, Bitcoin (BTC) is trading in a narrow range between $78,200 and $78,324, displaying remarkable resilience against a particularly hostile macroeconomic backdrop. The total crypto market capitalization stands at approximately $2.68 trillion, supported by robust 24-hour trading volumes oscillating between $79.8 billion and $85.6 billion. Despite these valuations near local highs, the Fear & Greed Index hovers between 39 (Fear) and 44 (Neutral), revealing a striking dichotomy between price action and retail investor sentiment.
Bitcoin dominance has climbed to 58.49%, reflecting a flight to quality within the crypto sphere. Ethereum (ETH) holds around $2,295 with 10.34% market share, while altcoins broadly stagnate — confirming an asymmetric rotation of capital toward assets benefiting from institutional regulatory approval. The 2026 market is no longer driven by the volatile retail speculation of previous cycles, but by calculated institutional capital allocation, powered by ETFs, algorithms, and corporate treasuries.
2. Macroeconomic Environment: The Vice Tightens
Geopolitical Crisis and Energy Shock
The geopolitical backdrop of 2026 is dominated by the escalating conflict involving the US, Israel, and Iran, causing major disruptions in the Strait of Hormuz. As a direct consequence, WTI crude oil prices have breached the critical $126 per barrel threshold, generating a violent ripple effect on US CPI, which rebounded to 3.3% year-on-year in March 2026 (up from 2.4% in February). Punitive tariffs imposed by the US administration — reaching 25% on several European nations — further entrench inflationary pressures throughout global supply chains.
The Fed’s « Higher for Longer » Stance
Faced with this persistent inflation, the FOMC maintained its benchmark rate in the 3.50%–3.75% range at its April 2026 meeting. Bond markets reacted immediately: the 10-year Treasury yield reached 4.42% while the 30-year approached 4.98%. By offering a guaranteed near-5% return, US Treasuries are mechanically draining liquidity that might otherwise flow into risk assets. Prediction markets (Polymarket) now price just a 15% probability of a near-term rate cut, cementing the « higher for longer » doctrine.
The « Warsh Risk Premium »: An Underappreciated Catalyst
A major risk factor remains underappreciated by retail participants: Kevin Warsh takes over as Federal Reserve Chair on May 15, 2026. Historical analysis is unambiguous — Fed leadership transitions have systematically triggered massive Bitcoin turbulence: -86% during Janet Yellen’s tenure, -74% during Jerome Powell’s. While Warsh is reportedly constructive on digital assets, arriving amid 3.3% inflation may compel him toward initially hawkish actions to establish credibility. Institutional models are already pricing in this « Warsh risk premium, » which explains the fierce resistance at the $80,000 psychological level.
3. Institutional Dynamics: ETFs Are Absorbing the Supply
Despite the severity of the macro backdrop, April 2026 emerged as one of the year’s most prolific months for US Bitcoin Spot ETFs, with net inflows between $1.97 billion and $2.43 billion. Total assets under management (AUM) now surpass the symbolic $102 billion threshold, with ETFs holding over 6.3% of the total circulating supply (versus 4.7% at the start of the year).
BlackRock’s iShares Bitcoin Trust (IBIT) remains the dominant force, capturing nearly $2 billion in April alone with single-day inflows peaking at $648 million. Notably, the Morgan Stanley Bitcoin Trust ETF (MSBT), launched April 8, 2026, has accumulated $194 million without a single day of net outflows, demonstrating Bitcoin’s growing penetration into traditional wealth management portfolios. In stark contrast, Grayscale’s GBTC continues its structural hemorrhage with $280 million in net redemptions in April.
On the corporate front, Strategy Inc. (formerly MicroStrategy) executed one of its largest recent strategic purchases, absorbing approximately $2.5 billion in Bitcoin during consolidation phases. This substitution of speculative « weak hands » by conviction-driven corporate « strong hands » is cementing an unprecedented structural price floor in Bitcoin cycle history.
4. On-Chain Metrics: Supply Alarm Bells Are Ringing
On-chain data corroborates the hypothesis of a critical supply squeeze. The net OTC desk balance has plunged to approximately -20,700 BTC, an unprecedented level since March 2025, indicating institutional buyers are massively transferring assets to long-term cold storage. The Coinbase Premium Index has returned to positive territory at 0.0037%, signaling a recovery in US institutional spot demand.
A particularly bullish contrarian signal: perpetual funding rates briefly turned negative (-1.8% on a 7-day average), the lowest since the 2023 bear market bottom. Historically since 2020, prolonged negative funding periods have generated average returns of +11.5% over 30 days with a 77% success rate. The recent purge of directional long leverage creates a healthy on-chain foundation conducive to a new price expansion cycle.
5. Order Book Heatmap: $3.1 Billion on the Line
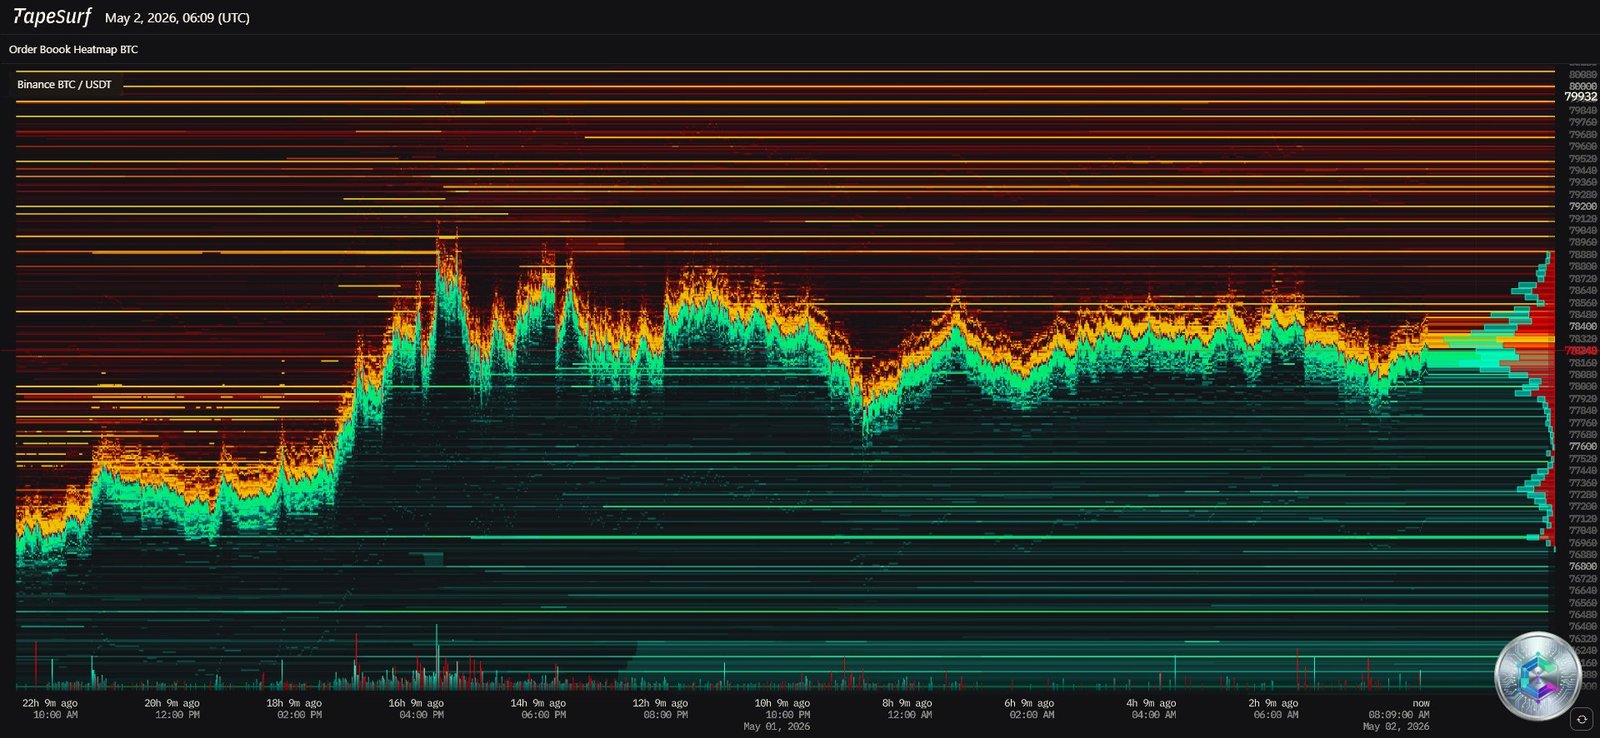
The TapeSurf heatmap reveals both a fascinating and precarious configuration. The Sell Wall ($79,000–$80,000): an extreme concentration of limit sell orders materialized by dense horizontal lines ranging from yellow to bright orange, acting as a lead ceiling over price action. The market must absorb colossal buy-side volume to « eat through » these orders and advance to new highs.
The liquidation minefield (Coinglass data): two quantitative boundaries define the battlefield:
- The « Trapdoor » at $73,610: a break below this level would trigger the forced liquidation of $2.221 billion in long positions, potentially precipitating a crash toward $70,000.
- The Short Squeeze Zone at $81,264: a decisive break above $80,000 would force the buyback of $913 million in short positions, catapulting price toward $88,000–$90,000 in near-instantaneous fashion.
6. Daily Chart Analysis (1D): Bullish Macro Trend Validated
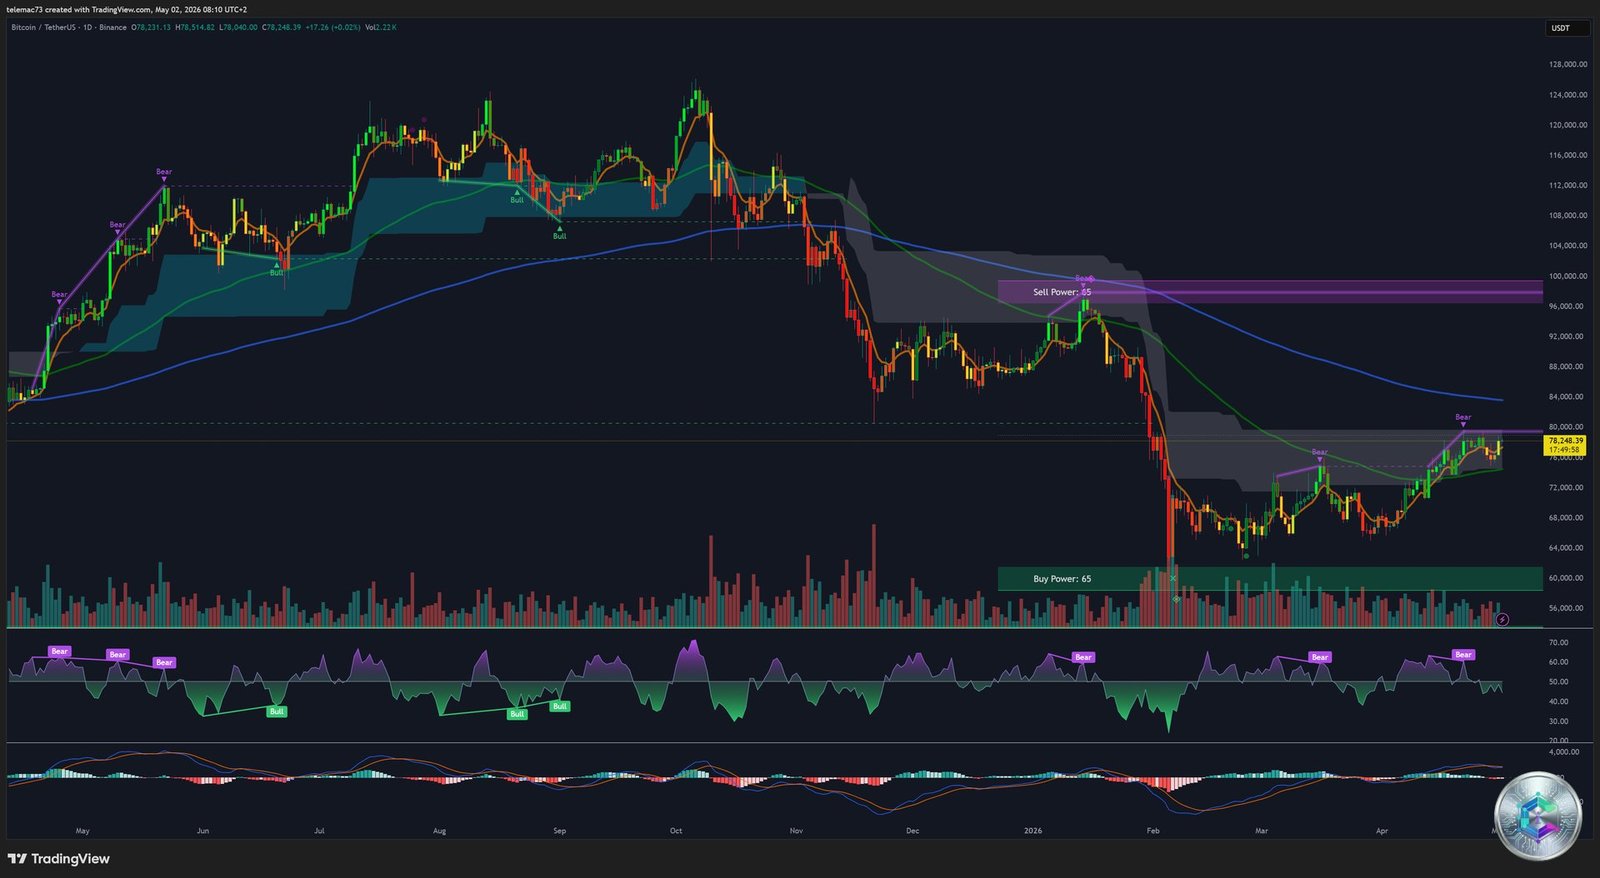
The daily chart paints a fundamentally constructive macro picture. After correcting approximately 39% from the $126,000 ATH (October 2025) — a moderate decline compared to the 83-84% drawdowns of previous cycles — Bitcoin executed a remarkable V-shaped recovery. The custom algorithmic indicator printed a « Buy Power: 65 » signal at the exact correction low, marking the onset of massive institutional entry via ETFs.
Price now trades firmly above the Ichimoku cloud (Kumo), formally validating the return to a long-term bullish trend. The upper « Sell Power: 61 » band materializes the $79,500–$80,000 resistance, confirmed by the long upper wicks on daily candles. All daily moving averages are unanimously bullish:
| Indicator | SMA Value | Signal |
|---|---|---|
| MA 5 (Very short-term) | $78,251 | ✅ Strong Buy |
| MA 20 (Short-term) | $77,989 | ✅ Buy |
| MA 50 (Medium-term) | $76,966 | ✅ Buy |
| MA 100 (Dynamic support) | $76,771 | ✅ Buy |
| MA 200 (Long-term trend) | $77,286 | ✅ Buy |
The daily RSI navigates between 59 and 62 — moderately bullish territory with ample room before the overbought zone. The MACD displays a short-term Golden Cross, confirming an acceleration of buying momentum.
7. 4-Hour Chart Analysis (4H): Critical Compression Triangle
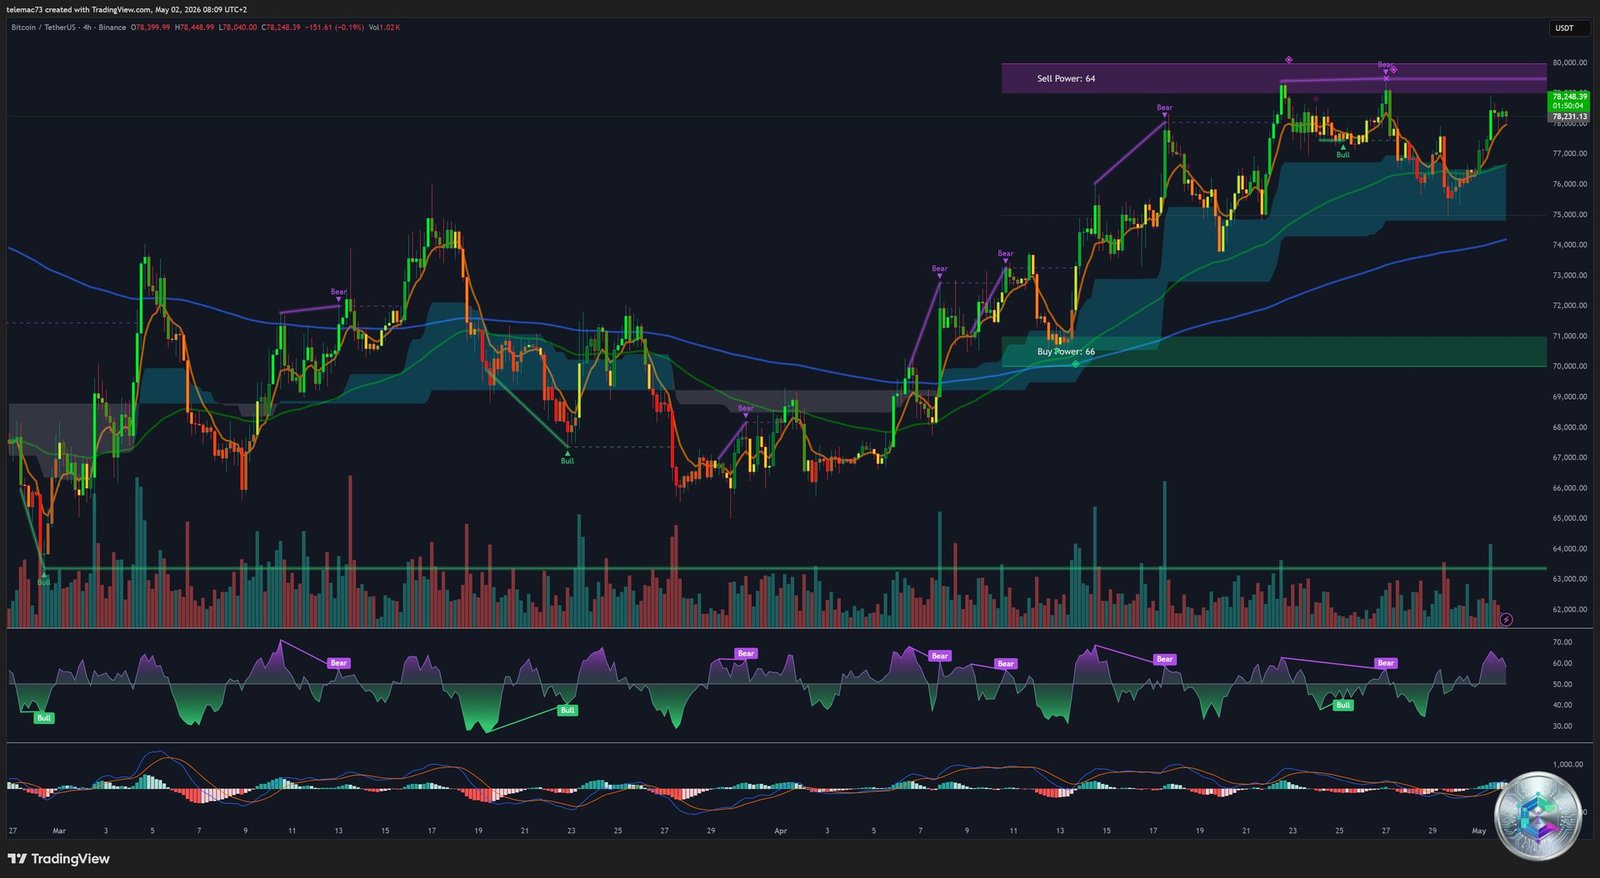
The 4-hour timeframe reveals Bitcoin locked inside an acute compression phase: the market is printing lower highs against the « Sell Power: 61 » resistance (~$79,000), while lows are being bought progressively higher. This classic Symmetrical Triangle (or Bull Pennant) pattern is characteristic of a market digesting before an explosive directional breakout.
The 4H Ichimoku cloud provides dynamic support from below, acting as a launchpad. A convincing close above the triangle’s descending resistance line would serve as the unambiguous technical trigger to propel the asset toward the $81,264 short squeeze zone. Conversely, the 4H SMA 50 near $78,197 represents the critical breakout pivot.
Declining volume and a flat MACD oscillating around zero confirm the absence of directional momentum — but this « silence » is precisely the precursor symptom of a violent imminent breakout. The 4H RSI stagnating near 50 is quietly accumulating kinetic energy.
8. 15-Minute Chart Analysis (15M): The HFT Algorithm Battleground
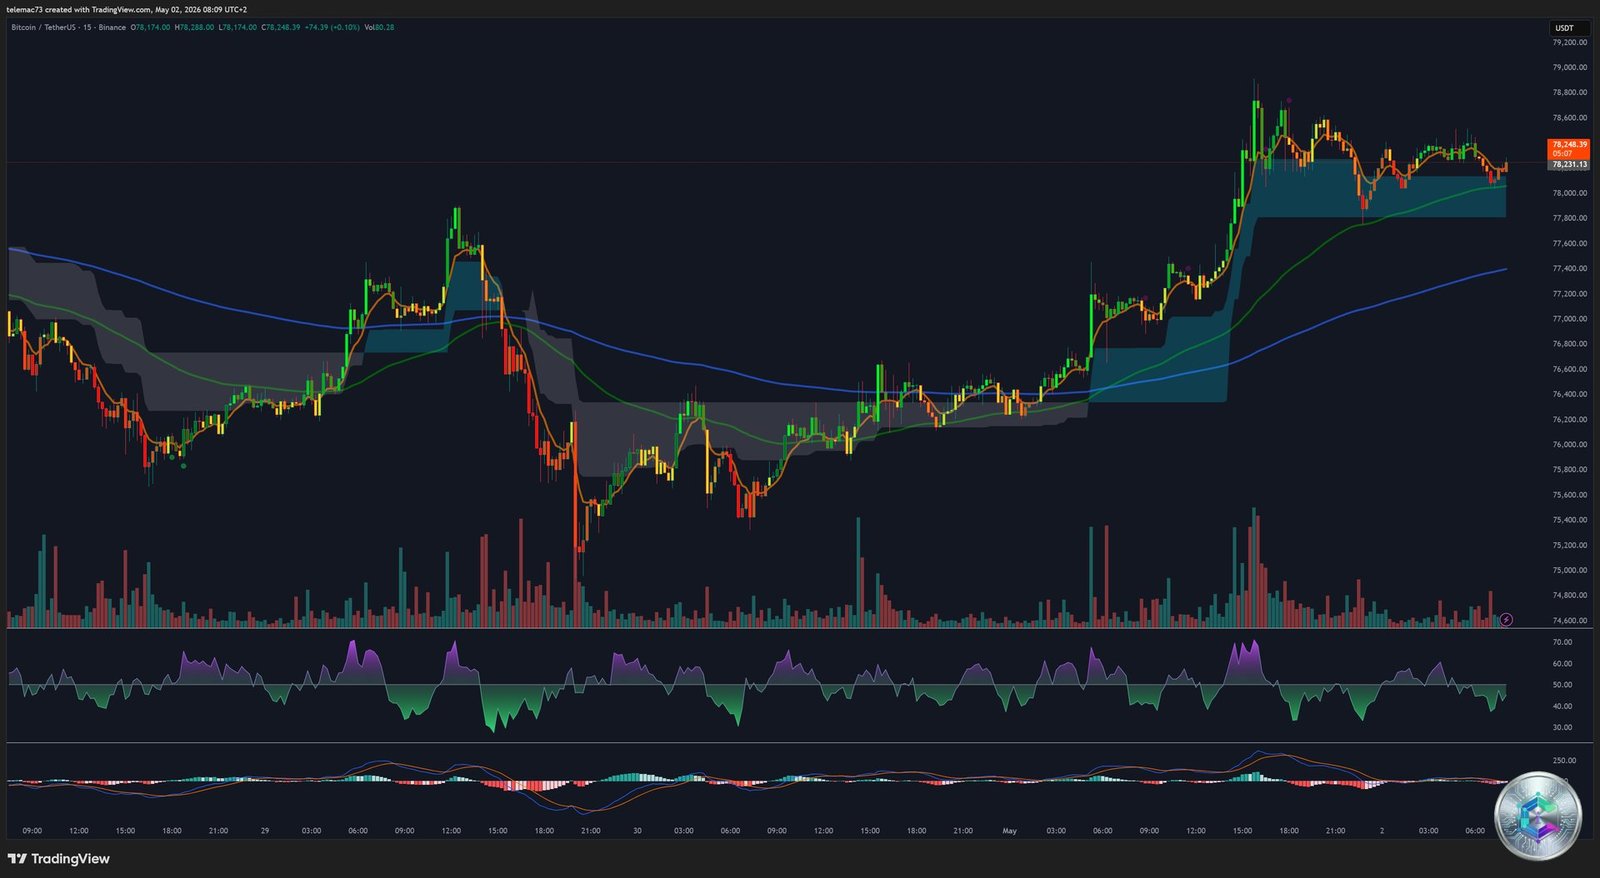
The 15-minute timeframe is the exclusive domain of high-frequency trading (HFT) algorithms and autonomous AI agents. The chart exhibits an extremely high level of noise: deep wicks hunting liquidity in both directions, with repetitive short-term double top and double bottom formations.
The mechanics are readable: every dip into the $76,500–$77,000 support zone is violently rejected by « Buy-The-Dip » algorithms, while every incursion toward $78,500 triggers systematic short selling. For the professional analyst, this timeframe carries no macroeconomic predictive value — it serves exclusively to tactically optimize entry and exit points during institutional block execution, minimizing market impact (slippage).
9. Strategic Price Level Matrix — May 2026
| Strategic Level | Price Zone (USD) | Implication |
|---|---|---|
| 🎯 Macro Resistance (Target) | $88,000–$90,000 | Mid-term institutional target. A break here confirms the bull market return. |
| ⚡ Short Squeeze Zone | $81,264+ | $913M in short liquidations. Parabolic move toward $88-90K. |
| 🔴 Sell Wall (Glass Ceiling) | $79,500–$80,000 | Sell Power: 61. Major psychological resistance. Programmed profit-taking. |
| 🔑 4H Pivot (Breakout Point) | $78,197 | 4H SMA 50. Close above = institutional buy signal. |
| ⚖️ Combat Zone (Current Price) | $77,452–$78,300 | Equilibrium epicenter. Intense algorithmic noise. |
| 🟢 Consolidation Support | $75,000–$75,880 | Triangle lower boundary. Bullish RSI divergences on 15M. |
| 💣 The « Trapdoor » (Fatal Trap) | $73,610 | $2.221B in long liquidations if breached. Brutal Long Squeeze. |
| 🛡️ Macro Support (Ultimate Floor) | $70,000–$72,000 | 200-day MA. Generational accumulation point for corporate treasuries. |
10. Conclusion: The Kinetic Energy of a Market Holding Its Breath
The Bitcoin market architecture at the dawn of May 2026 presents a configuration of fascinating return asymmetry. On one side, a heavily oppressive macroeconomic environment: 3.3% inflation, a Fed frozen at 3.75%, oil at $126, and an imminent Federal Reserve leadership transition. On the other, an internal market infrastructure of exceptional robustness: $102B in ETF AUM, aggressive institutional absorption, negative funding rates as a contrarian signal, and extreme technical compression.
Bullish Scenario (Primary): A break above $79,500, catalyzed by fresh IBIT inflows or a CLARITY Act legislative breakthrough, would trigger the $913 million short squeeze at $81,264, propelling the asset toward $88,000–$90,000 in near-instantaneous fashion through a gamma squeeze effect.
Bearish Scenario (Secondary): A breach of the $75,000 support, triggered by an exogenous shock (US-Iran escalation or surprise Fed action), would activate the $73,610 « fatal trapdoor » and its $2.221 billion long liquidations, forcing a retreat toward $70,000–$72,000 (200-day MA) — historically the generational accumulation level before the true post-halving parabolic phase.
In conclusion, the market is holding its breath at the center of an asymmetric minefield. The kinetic energy stored within this narrow consolidation band guarantees a directional volatility expansion of exceptional violence in the weeks ahead. The question is not whether it will happen, but which direction it will break.
⚠️ Disclaimer: This article is written for educational and informational purposes only. It does not constitute investment advice, a recommendation to buy or sell, or a financial solicitation of any kind. Cryptocurrency markets are extremely volatile and past performance does not guarantee future results. Only invest what you can afford to lose, and consult a licensed financial advisor before making any investment decisions.