
Introduction
Assessing Bitcoin’s market dynamics on April 17, 2026 demands a multidimensional analytical approach. This report integrates granular order book microstructure analysis, multi-timeframe chart technicals (intraday, medium-term, and macroeconomic), and a rigorous evaluation of recent fundamental catalysts. BTC is trading around the critical pivot of $74,779 USD, at the intersection of opposing forces of rarely observed intensity.
1. Macroeconomic Context and Fundamental Drivers
Bitcoin’s valuation does not evolve in a vacuum. It is intrinsically linked to the global financial architecture, central bank monetary policies, and geopolitical fluctuations.
1.1. Geopolitics and Risk Appetite
The global geopolitical environment is showing signs of temporary de-escalation that are reshaping institutional investors’ appetite for risk. The anticipation of a ceasefire agreement between Israel and Lebanon has provided a more optimistic backdrop for US-Iran diplomatic negotiations. This easing of tensions immediately translated into a compression of the geopolitical risk premium, favoring capital redeployment toward high-beta assets.
The ripple effects on traditional financial markets have been spectacular: both the S&P 500 and Nasdaq reached new all-time highs, with the Nasdaq recording twelve consecutive daily gains — its longest winning streak since July 2017. In this wake, Bitcoin rebounded from its local lows around $73,000.
1.2. Monetary Policy and Yield Curve Disinversion
Federal Reserve expectations remain the primary driver of underlying liquidity. With inflation projected around 3.3% and the federal funds rate expected near 3.4% by end-2026, the market is closely monitoring bond market dynamics.
A pivotal development lies in the US Treasury yield curve (10-year / 2-year spread). Historically inverted — a signal of economic stress — this curve is now showing tangible signs of disinversion. For macro investors, this pivot signals that the liquidity tap is beginning to reopen. Bitcoin thus finds itself in an asymmetric position: constrained in the short term by technical resistance, while accumulating latent bullish pressure akin to a tightly compressed spring.
1.3. Institutional Flow Dominance (Spot ETFs)
Q2 2026 demand structure is unequivocally driven by institutional accumulation via regulated spot ETF vehicles. On-chain data shows extraordinary demand resilience even during consolidation periods and tax-season liquidations. On April 14, 2026, US spot Bitcoin ETFs recorded daily inflows of $411.5 million, pushing 2026 net flows positive at ~$245M YTD and total AUM beyond $96.5 billion.
| Institution | Product (ETF) | Recent Flows / AUM | Strategic Dynamic |
|---|---|---|---|
| BlackRock | iShares Bitcoin Trust (IBIT) | +$696M over 5 days | Absolute market leader, massively absorbing circulating supply |
| Morgan Stanley | MS Bitcoin Trust (MSBT) | +$100M in 6 trading days | Fierce appetite from affiliated wealth managers |
| Goldman Sachs | Filing in progress | Recent regulatory filing | Major institutional capitulation from a historical Bitcoin skeptic |
| ARK Invest | ARK 21Shares (ARKB) | +$113M (daily flow) | Strong traction among innovation-focused investors |
| Fidelity | Wise Origin (FBTC) | +$45M (daily flow) | Consistent participation despite adjacent market volatility |
A remarkable paradox: while the Crypto Fear & Greed Index displays Extreme Fear (score of 21), finance professionals are paradoxically increasing their exposure. 38% of them now view the sector as an asymmetric growth opportunity, often investing ahead of their own institutions’ formal allocation policies.
2. Order Book Microstructure Analysis (Liquidity Heatmap)
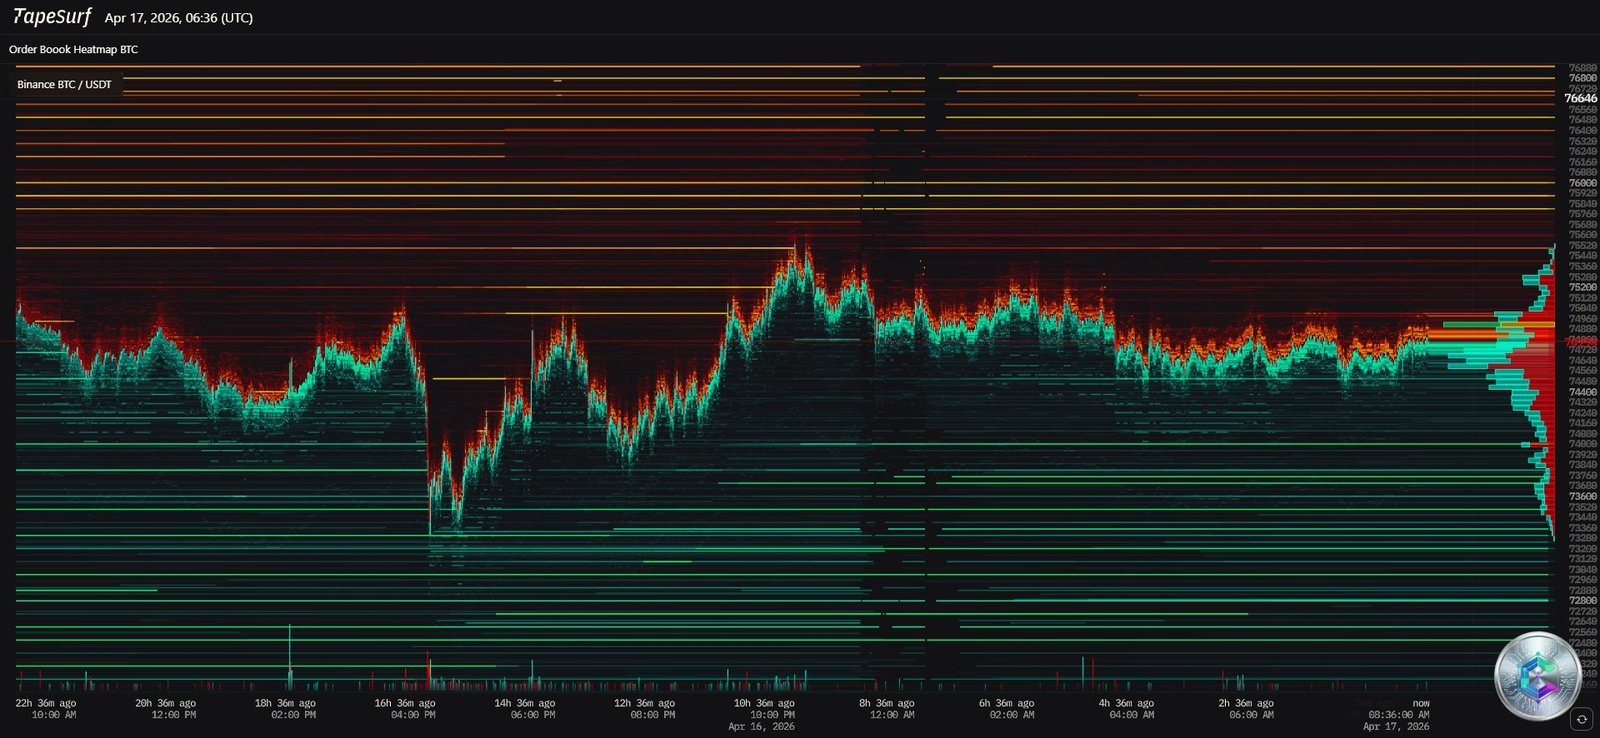
2.1. Supply Anatomy: Sell Walls
- Immediate glass ceiling ($75,000 – $75,500): Dense red horizontal strata appear immediately above $75,000. These sell walls generate constant friction, mechanically rejecting each bullish incursion.
- The $76,000 – $76,646 Fortress: An extremely thick, deep-red block stands at $76,646, representing tens of millions of dollars in queued sell orders — institutional profit-taking and miner hedging strategies converging at the same level.
- Distant gravitational magnets ($110,000 – $115,000): Colossal clusters of limit orders are identified far above current price action. These levels act as gravitational magnets for predatory algorithms seeking to trigger short squeezes.
2.2. Demand Anatomy: Buy Walls
- Nearby support ($74,000 – $73,500): Distinct green horizontal lines confirm substantial buying interest just below the current trading price, which recently absorbed a sharp drop with a violent V-shaped recovery.
- Macro protection screen ($72,000 – $70,000): ~$6 billion in heavily leveraged short positions are vulnerable in this corridor. Fierce defense of this zone prevents a cascade of long liquidations that would precipitate a price collapse.
3. Multi-Timeframe Chart Analysis
3.1. Daily Chart (1D) — The Macro Vision
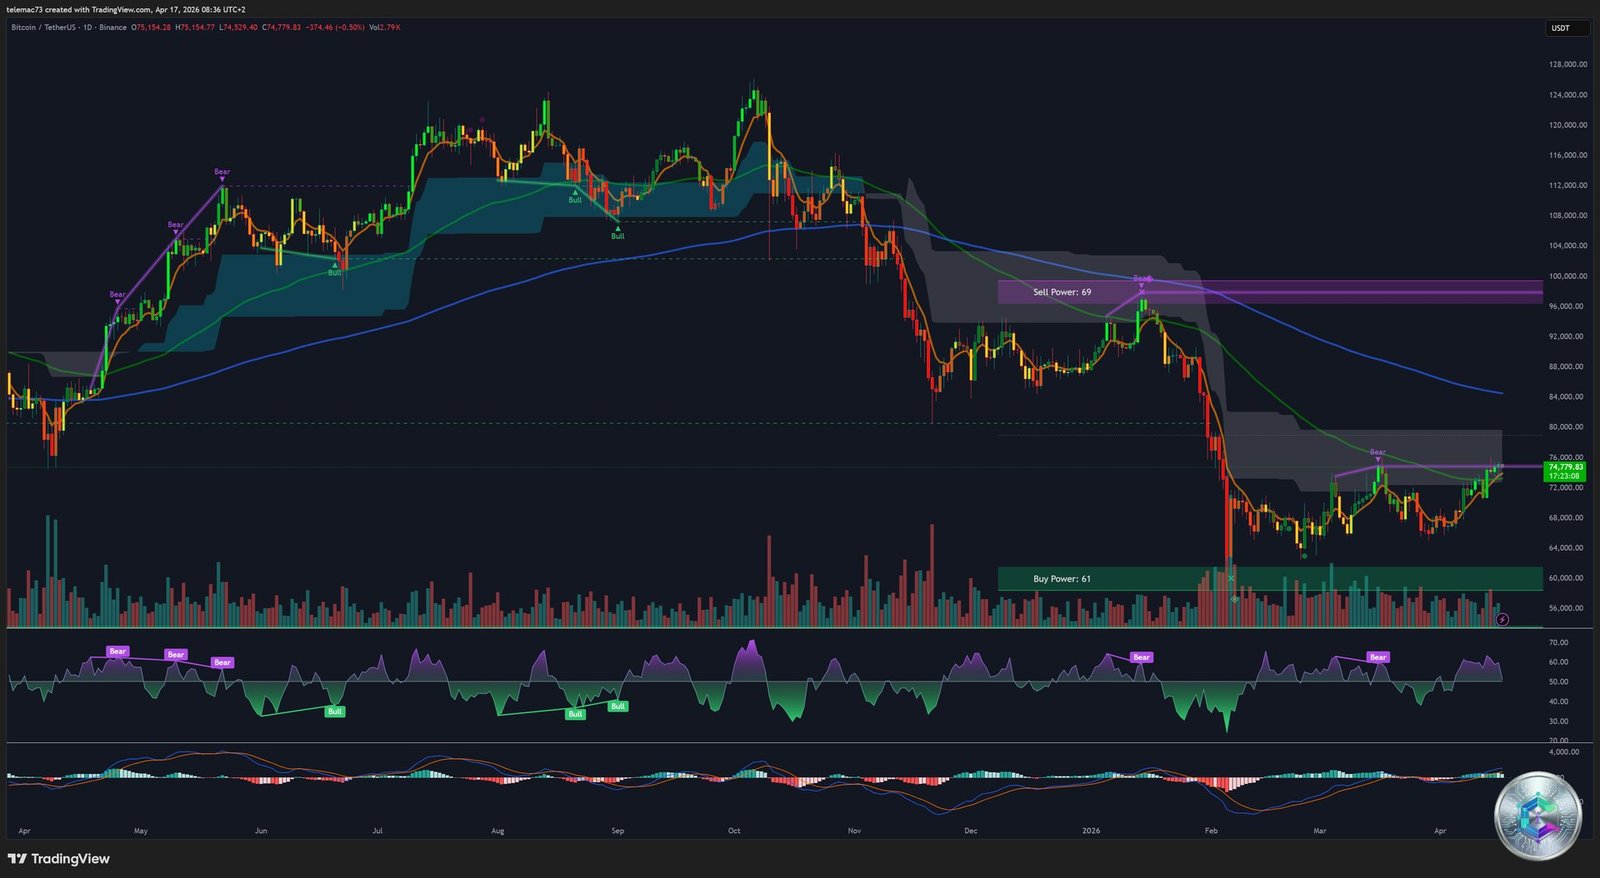
Bitcoin is displaying a clear reconstruction phase following the quadrennial cyclical collapse (historical drawdown of 60–80%). An unbreakable floor was established around $60,000, defended by waves of institutional ETF purchases.
The custom indicator places a Buy Power: 61 box at the $60,000 zone (macroeconomic accumulation center of gravity) and a purple Sell Power: 69 box in the $96,000–$100,000 region — dictating the next true macroeconomic battleground.
Oscillators (1D):
- MACD: A massive hidden bullish divergence is forming. The histogram is printing shallower and shallower troughs — the signature of exhausted macroeconomic selling pressure. A sustained cross above the zero line would officially mark the return to a bull market regime.
- RSI: Careful navigation in the neutral zone (40–60), with no extreme overbought conditions. A vast reservoir of potential energy remains before reaching a stage of irrational exuberance.
- Ichimoku & EMA: Bullish green Kumo cloud. The market survived a Death Cross threat last November. Probabilities now converge toward the emergence of a rare Golden Cross (50-day EMA crossing above the 200-day EMA). Historically, Bitcoin’s four previous Golden Crosses generated rallies of 33% to 87%.
3.2. 4-Hour Chart (4H) — The Acute Compression
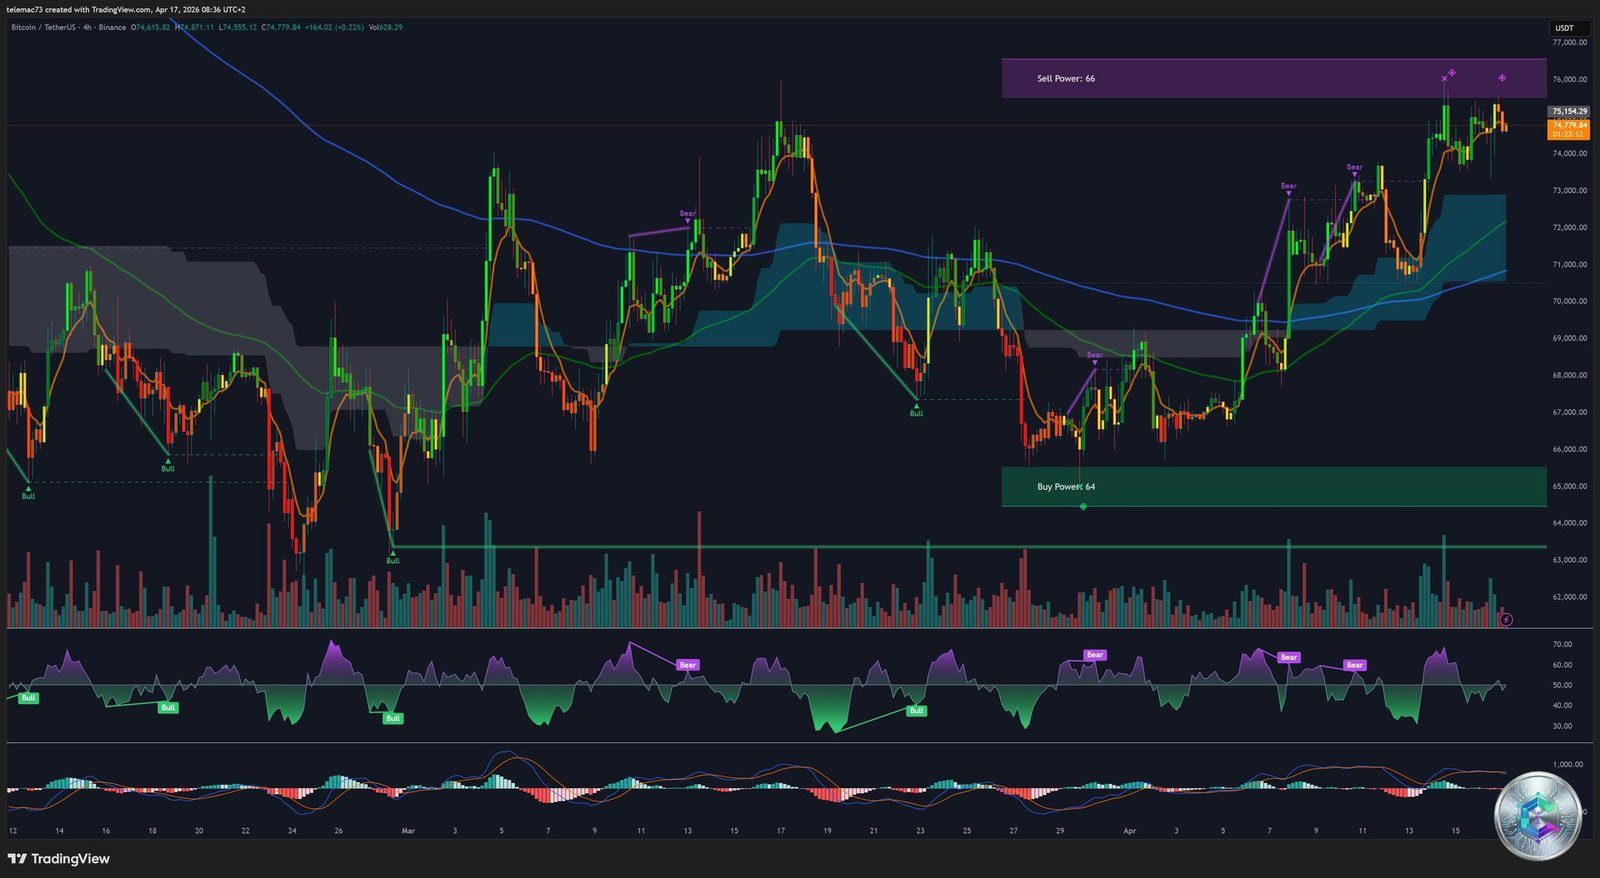
The 4H chart reveals an acute compression structure. The asset is trapped between a Sell Power: 66 zone ($76,000–$77,000) and a green Buy Power: 64 band ($64,000–$65,000). The morphology traces a falling wedge / symmetrical triangle whose price has reached the apex — signaling an imminent directional explosion.
Algorithmic signals (4H):
- MACD: Recent local Death Cross with bright red histogram — short-term momentum is controlled by sellers distributing into residual buying interest.
- RSI: Retreating toward 50, confirming total thermodynamic equilibrium awaiting an external catalyst.
- Semantic debate: Giant Bull Flag vs. ascending distribution channel. Peter Brandt rejects the « flag » classification: the structure has extended beyond four weeks and may result in distribution if supports give way.
3.3. 15-Minute Chart (15m) — The Intraday Turmoil
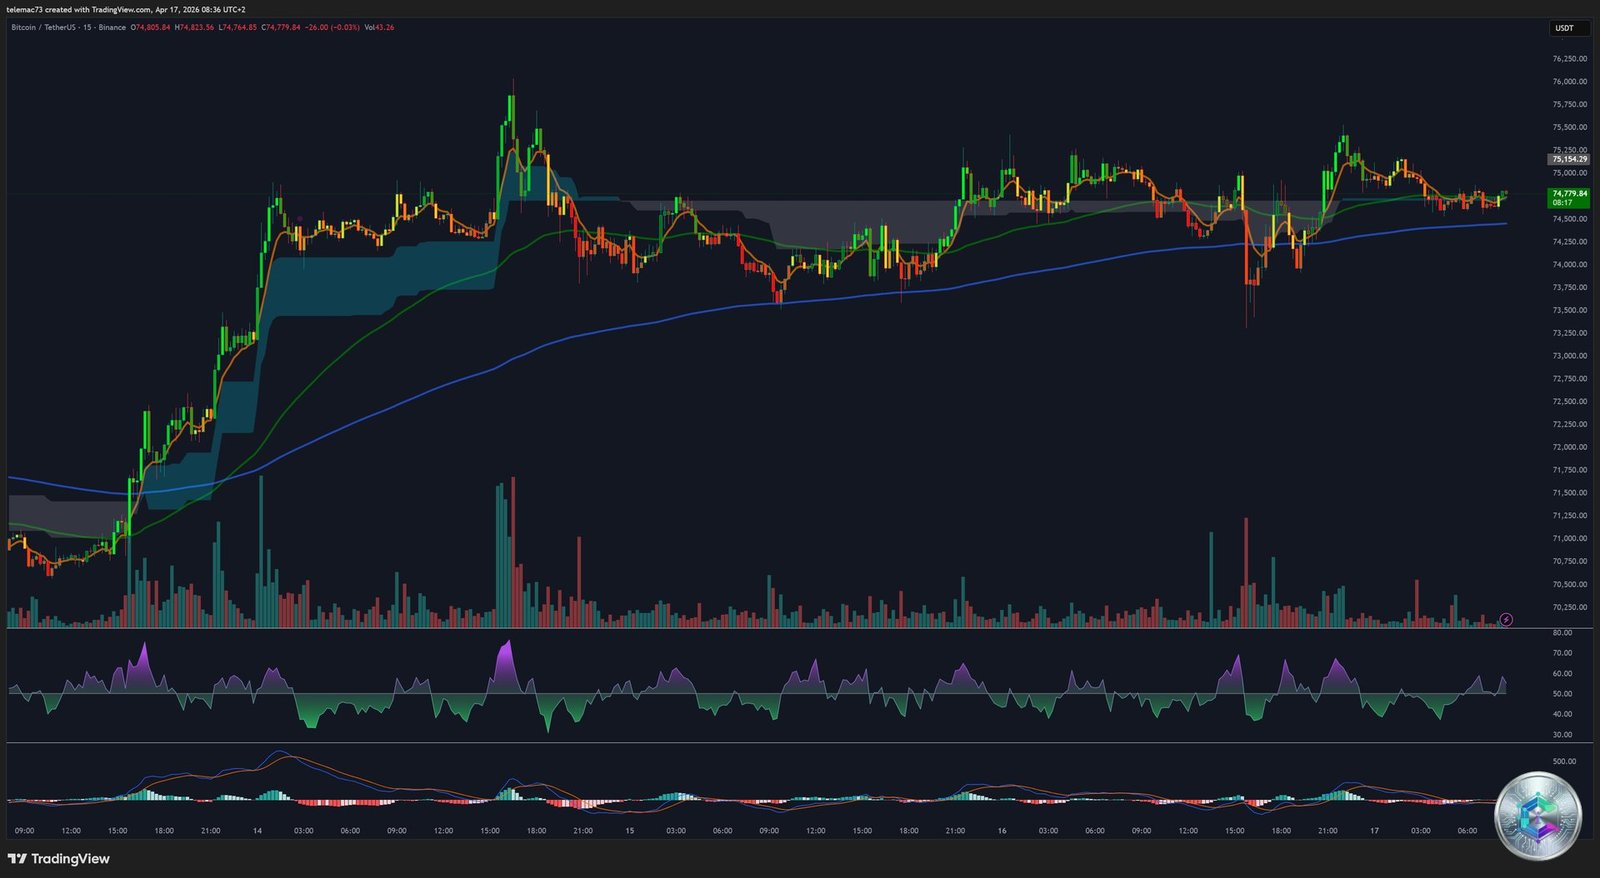
The 15m timeframe plunges into the domain of high-frequency algorithms and market making. Massive red volume pillars testify to flash crashes orchestrated by whales probing liquidity depth. The ascending channel that rebuilt itself perfectly illustrates the market adage: « Markets fall by elevator and climb by staircase. »
The dynamic EMA (blue curve) now acts as resistance after being breached, rejecting each bullish attempt with algorithmic precision. The MACD churns through Golden/Death Crosses at a dizzying pace — characteristic of high-consolidation periods with no directional trend (whipsaws).
4. CME Gaps and Market Mathematical Anomalies
CME futures contracts generate « pricing gaps » during their closure periods. These gaps act as gravitational magnets for institutional algorithms:
- Gaping hole: $116,050 – $119,170: An unfilled gap on June 2026 CME contracts. Represents the absolute asymptotic target of an unconstrained bull market — the « magnetic north » of the current cycle.
- Fair Value Gap: $112,000 – $118,000: A second overlapping FVG reinforcing the « magnet zone » concept.
- Algorithmic targets: Institutional take-profits are positioned at $117,100 and $116,436, anticipating surgical price reactions upon contact with these past inefficiencies.
5. Key Support and Resistance Map
| Price Level (USD) | Classification | Implications |
|---|---|---|
| $116,050 – $119,170 | Macro Magnet (CME FVG) | Unfilled gap — asymptotic target of a liberated bull market |
| $110,000 – $115,000 | Absolute Liquidity Wall | Extreme sell order concentration + potential liquidations |
| $96,000 – $100,000 | Macro « Sell Power » Zone | Historical distribution pressure identified on the 1D chart |
| $78,903 | Bullish Target (Fib 0.618) | Next major technical stop on confirmed breakout with volume |
| $76,000 – $77,000 | Immediate Glass Ceiling | Overwhelming sell walls + « Sell Power: 66 » on 4H |
| $75,296 | Strategic Pivot (Fib 0.5) | Daily close above = invalidation of local corrective trend |
| $74,508 | Intraday Fault Line | Recent daily low — breach triggers algorithmic stop hunts downward |
| $73,000 – $74,000 | Quick Liquidity Floor | Main tactical bounce zone absorbing immediate selling pressure |
| $72,200 – $73,500 | Leverage Vulnerability Cluster | $6B in exposed shorts = potential snowball short squeeze |
| $67,000 | Cyclical Pivot Support | Iterative low of the 2026 consolidation channel — must hold |
| $60,000 – $62,000 | Macroeconomic Foundation | Breach = entry into devastating cyclical bear market |
6. Directional Scenarios and Projections
🟢 Bullish Scenario: The Stratospheric Breakout
The genesis of a parabolic expansion rests on architecture already in place. The relentless accumulation by BlackRock, Fidelity, and Morgan Stanley, coupled with the yield curve disinversion prospect, constitutes an impeccable fundamental foundation.
Validation conditions: Golden Cross confirmation on daily EMAs + weekly confirmation of RSI hidden bullish divergence → obliteration of sell walls at $76,000 → 4H wedge breakout → short squeeze of ~$6B trapped shorts → trajectory toward $78,900 → $96,000 → CME FVG $116,000–$119,000.
🔴 Bearish Scenario: Structural Distribution
The recurrence of bearish RSI divergences on the 4H (price highs unconfirmed by relative strength) and MACD Death Crosses betray dominant operators’ intent to offload positions into residual buying enthusiasm.
Potential cascade: breach of $73,000 → stop-loss activation → plunge toward $70,000 → failure to hold $67,000 → gravitational pull toward the last-resort support at $60,000–$62,000 → breach = massive correction targeting the $50,000 zone.
Strategic Epilogue
Bitcoin’s ecosystem in April 2026 is the theater of a historic tug-of-war. The extreme ambient anxiety (Fear Index at 21) stands in opposition to the cold rationality of banking giants’ algorithmic accumulation. The suffocating density of order books surrounding the $74,800 level signals a pressure cooker on the verge of releasing explosive volatility.
The professional investor must subordinate all directional assumptions to the clinical observation of the geometric resolution of the 4H compression wedge, engaging only in the wake of genuine institutional volume — which alone possesses the power to breach the liquidity fortresses currently blocking the horizon.
⚠️ Disclaimer
This article is written for educational and informational purposes only. It does not constitute investment advice, nor a recommendation to buy or sell any digital asset. Cryptocurrency markets are highly volatile and carry significant risk of capital loss. Any investment decision should be made after consulting a licensed financial advisor and considering your personal financial situation. CryptoInfo.ch disclaims all liability for any losses arising from the use of this information.