


Introduction: A Market Undergoing Deep Structural Transformation
The digital asset ecosystem is navigating an exceptionally complex transition phase in April 2026. Exactly two years after the fourth halving in April 2024, market microstructure has diverged significantly from historical cyclical models that predicted an uninterrupted parabolic expansion phase. Instead, the market has entered a regime governed by the hyper-financialization of the asset, institutional liquidity flow dominance through spot ETFs, and heightened sensitivity to exogenous geopolitical shocks.
With Bitcoin trading above $74,000 and the total crypto market cap rebounding toward $2.52 trillion, analysis reveals a market in extreme compression — primed for a directional resolution whose repercussions will reshape the remainder of the financial cycle.
Macroeconomic Environment: The Strait of Hormuz Shock
Bitcoin’s Q2 2026 valuation is inseparable from global macroeconomic conditions, severely disrupted by geopolitical escalation in the Middle East. The collapse of peace talks in Islamabad and the U.S. imposition of a naval blockade on the Strait of Hormuz generated an asymmetric shockwave across energy and global liquidity markets.
With the Strait of Hormuz accounting for approximately 20% of the world’s daily oil supply, its partial closure triggered an immediate hydrocarbon price spike: WTI surged 7.8% past $104/barrel, while Brent soared beyond $108/barrel. This geopolitical shock initially sent Bitcoin tumbling into the $66,000–$67,000 zone, illustrating the mechanics of forced global dollar liquidity contraction: the oil spike compressed the Fed’s room to maneuver, pushing real 10-year Treasury yields to approximately 4.37% and aggressively appreciating the dollar.
| Macroeconomic Metric | Value (April 2026) | Crypto Market Impact |
|---|---|---|
| WTI Crude Oil | > $104/barrel | Drives global inflation, pressure on risk assets |
| Brent Crude Oil | > $108/barrel | Constrains institutional risk budgets |
| US 10-Year Yield | ~ 4.37% | Raises opportunity cost of non-yielding assets |
| DXY Index | Peaks > 100 | Downward pressure on global dollar-denominated liquidity |
Paradoxically, despite this theoretically toxic environment for a long-duration asset, Bitcoin demonstrated spectacular resilience, recovering all its geopolitical-shock losses to trade back above $74,000. Internal crypto market structure catalysts are now overpowering traditional macroeconomic headwinds.
The March 2026 U.S. CPI printed at 3.3% year-over-year (+0.9% monthly), almost entirely driven by energy (+10.9%, with gasoline posting a record +21.2% monthly gain — the largest since 1967). Core CPI held at 2.6%. The CME FedWatch tool now shows a 98.4% probability the Fed will hold rates at the 3.50%–3.75% range at the April 29 meeting, effectively burying near-term rate cut expectations.
The Institutional Revolution: ETFs Reshaping Liquidity
Bitcoin’s ability to shrug off macroeconomic turbulence stems from an ontological transformation in its microstructure. In 2026, price formation is no longer dictated by retail speculation but by the systemic integration of the asset into traditional finance (TradFi) capital flows.
Recent flow data is compelling. On April 6, 2026, in the midst of global uncertainty, U.S. spot Bitcoin ETFs recorded massive net inflows of $471.3 million — the sixth-largest single-day inflow of the year. The dominant force is BlackRock’s iShares Bitcoin Trust (IBIT) with $181.9 million, followed by Fidelity’s FBTC ($147.3M) and ARK 21Shares’ ARKB ($118.7M). Morgan Stanley’s MSBT launch attracting $34 million on day one illustrates the continued opening of new institutional wealth management distribution channels.
| ETF | Issuer | Net Inflows (April 6, 2026) |
|---|---|---|
| IBIT | BlackRock | $181.9M |
| FBTC | Fidelity | $147.3M |
| ARKB | ARK 21Shares | $118.7M |
| MSBT | Morgan Stanley | $34.0M (Day 1) |
Beyond ETFs, MicroStrategy recently acquired 13,927 BTC at an average price of $71,902 between April 6–12, deploying over $1 billion in capital — evidencing aggressive execution regardless of geopolitical conditions.
One of the most counterintuitive observations is the apparent inability of these massive flows to immediately trigger a parabolic breakout. This capping of price action is explained by institutional financial engineering: fund managers are massively deploying covered call strategies, selling their Bitcoin’s upside potential to generate steady recurring yield. This creates a mechanical sell wall above the market, drastically suppressing implied volatility and replacing explosive bubbles with prolonged, tiered consolidation.
The CLARITY Act: A Historic Regulatory Catalyst
The U.S. regulatory backdrop is undergoing a historic mutation. The market is pricing in the impact of the Digital Asset Market Clarity Act (CLARITY Act) of 2025/2026 — the most comprehensive legislation ever designed for the digital asset industry. At its core, it aims to end the SEC vs. CFTC jurisdictional war, establishing a clear taxonomy and transferring spot market regulation of « digital commodities » to the CFTC, widely perceived as a more principles-based, innovation-friendly regulator. Adoption of this framework would eliminate the legal risk premium still weighing on major institutional capital allocations, paving the way for Bitcoin’s full integration into pension and sovereign portfolios.
Chart Analysis: Daily Timeframe
On the daily chart, Bitcoin is evolving within a broad horizontal consolidation channel, between a solid macro support floor at $62,500 and a formidable resistance ceiling at $75,000. The current price of $74,449 remains far below the October 2025 all-time high of over $126,000, yet the macro structure remains intact and anchored in an accumulation dynamic.
- Key support levels: $62,500 (exceptional absorption), $66,000 (post-Hormuz shock low), $69,000 (critical psychological pivot).
- Resistance levels: $75,000 (range ceiling), $83,000 (200-day MA — the dividing line between current consolidation and resumption of the secular bull market).
- Oscillators: Daily RSI in neutral zone (50–55), reflecting methodical absorption of selling pressure. MACD below the zero line but histogram contracting — bearish momentum exhaustion underway.
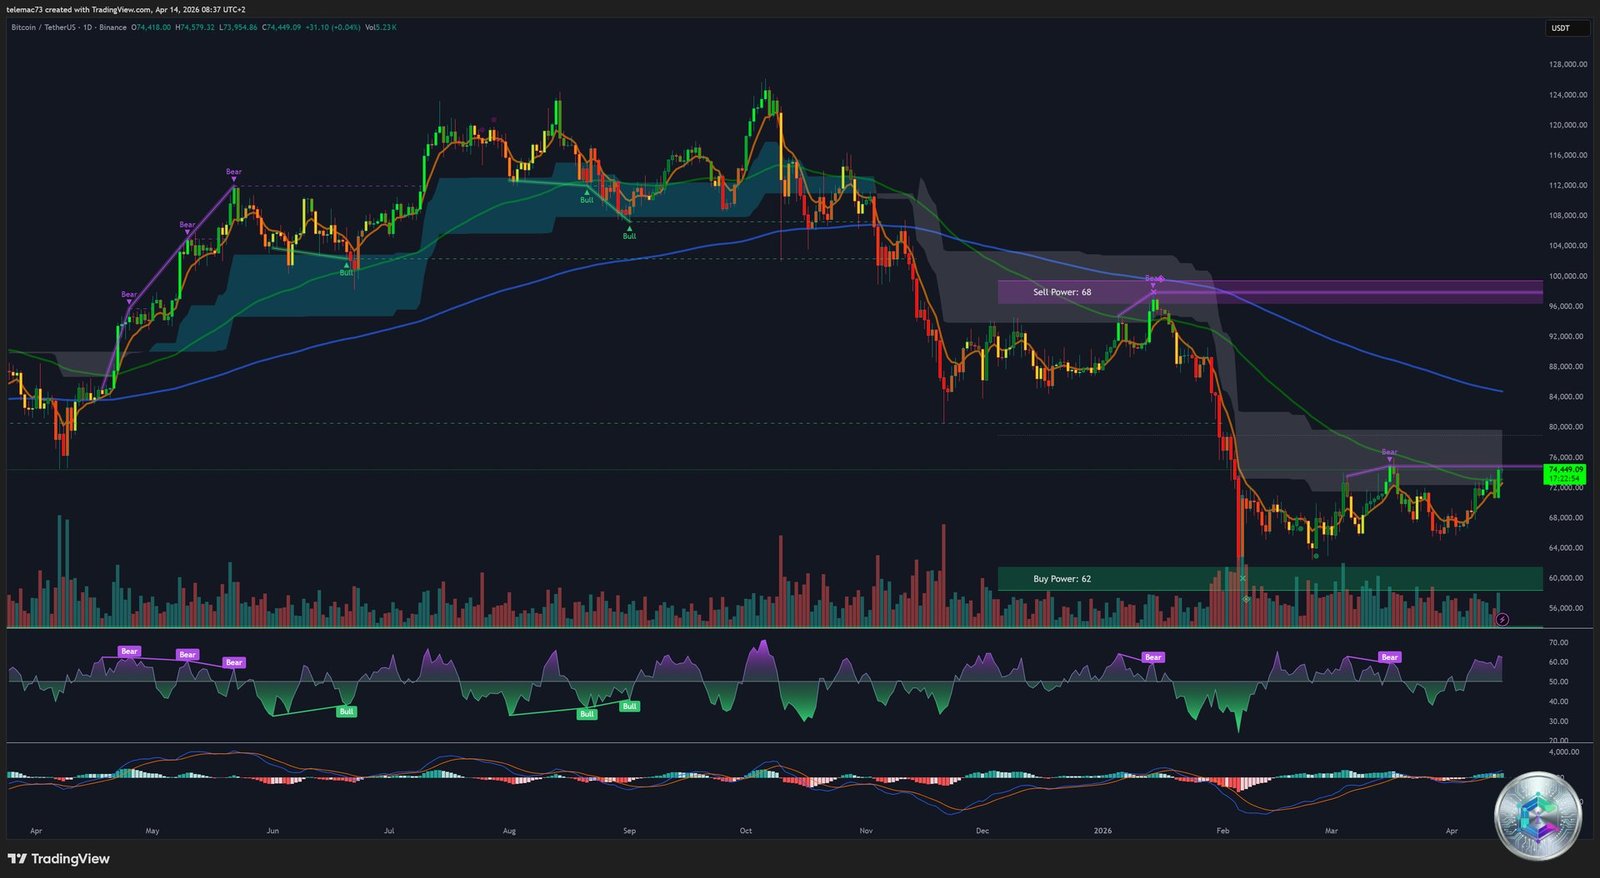
Chart Analysis: 4-Hour Timeframe
The 4-hour chart provides the clearest view of the post-Hormuz shock recovery mechanics. The price, establishing at $74,417, displays a spectacular « V-shaped » recovery from the $60,000–$66,000 zone.
- Chart patterns: Invalidation of an initial bear flag, formation of an ascending triangle with higher lows (HLs), resolved by an aggressive bullish breakout.
- MACD Golden Cross: Major technical signal — the fast MACD line crossed above the signal line, with histogram printing strongly expanding green bars. The key pivot at $71,979 acted as the breakout trigger.
- 4H RSI: Hidden bullish divergence at the trough, now advancing toward the overbought zone (60–70), confirming buyer momentum dominance.
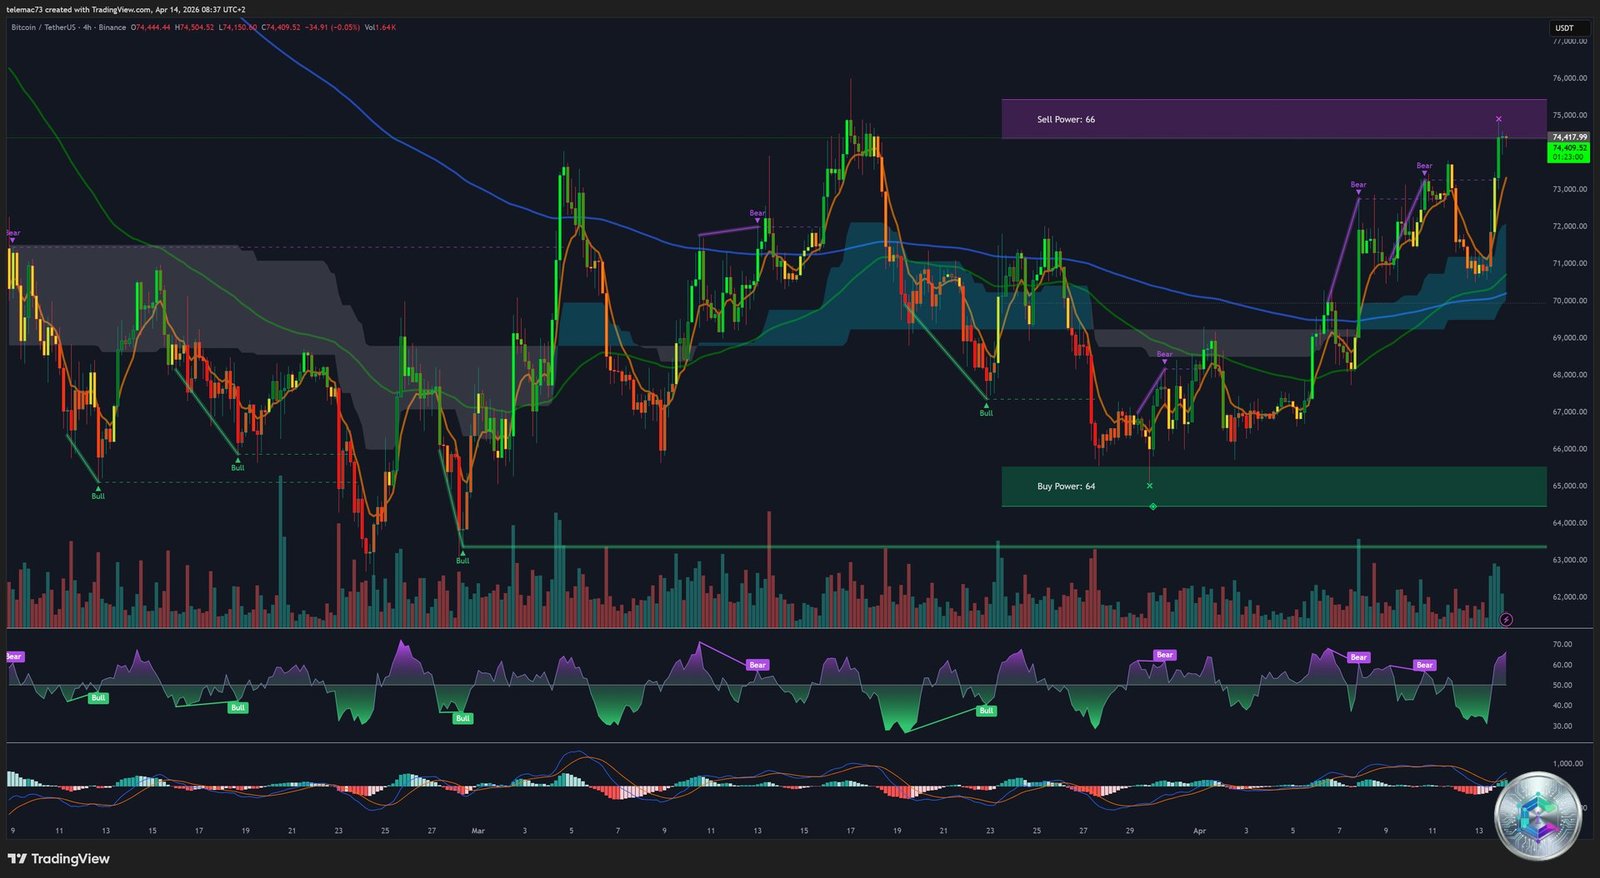
Chart Analysis: 15-Minute Timeframe — The Squeeze Microstructure
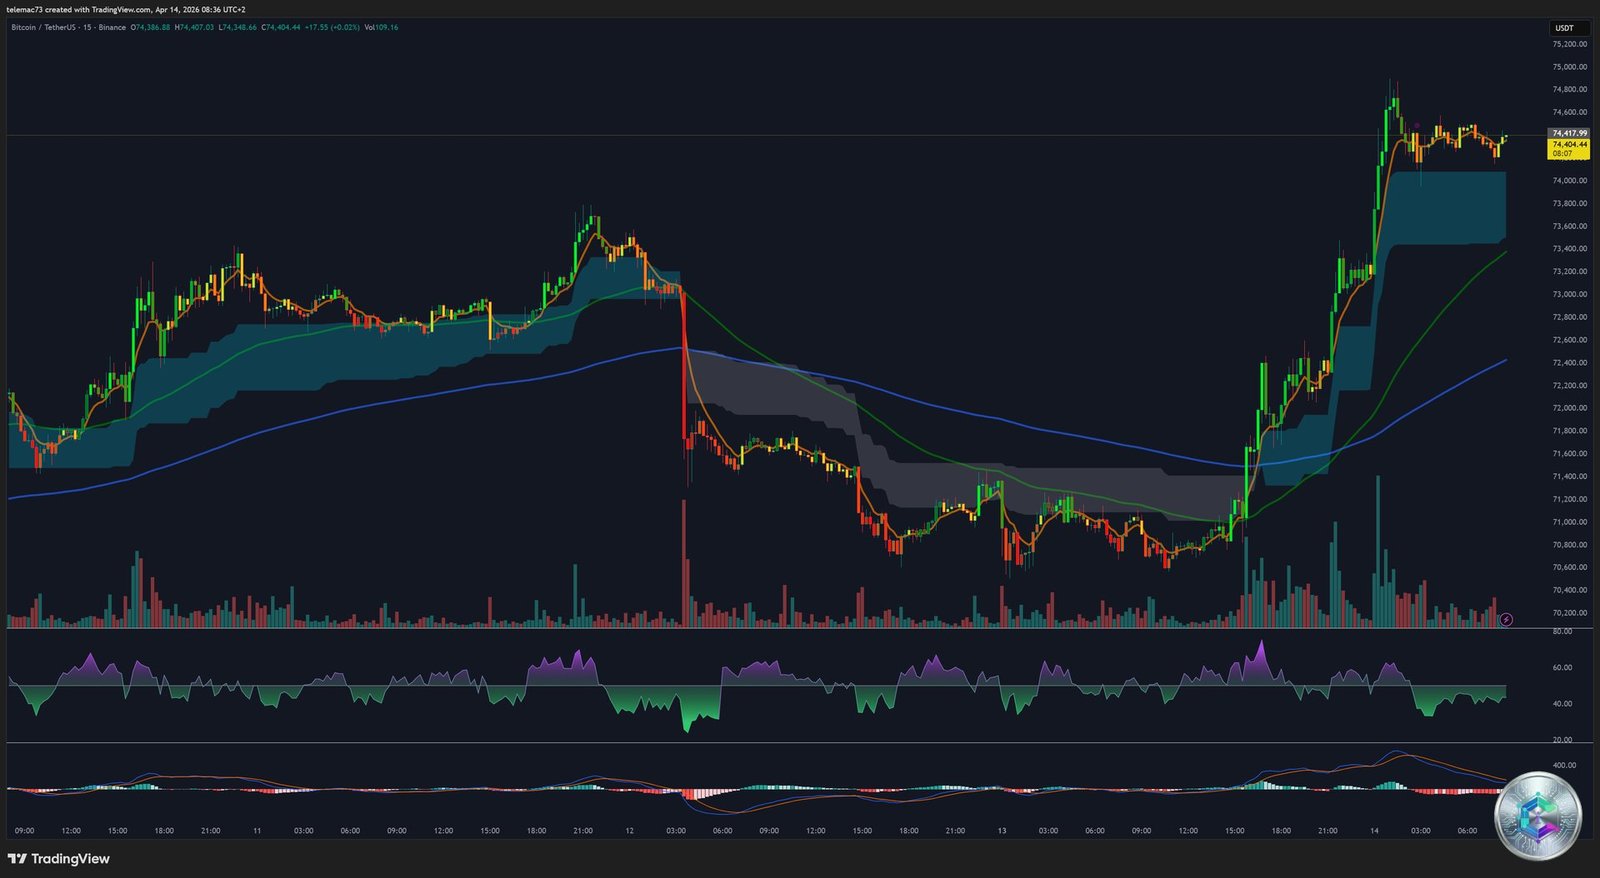
The 15-minute chart dissects the violence of the immediate microstructure, dominated by HFT algorithms and forced liquidation mechanics. Price action is characterized by an extremely steep ascending channel propelling price toward $74,434.
- Intraday bull flags: The rally is fractal — massive impulse candles followed by brief lateral consolidations whose breakouts are each accompanied by volume explosions, typical of forced buying phases.
- Spot CVD (Cumulative Volume Delta): A blazing +$63.9 million reading during the $70,500→$74,000 move. This metric certifies the rally is supported by organic spot buying demand — not merely short covering.
- 15m RSI: In extreme overbought territory (>80), a state that can persist during price discovery phases fueled by cascading forced liquidations.
| Timeframe | Major Support | Major Resistance | Dominant Signals |
|---|---|---|---|
| Daily (1D) | $62,500 / $69,000 | $75,000 / $76,000 | Consolidation channel, bearish MACD exhaustion, neutral RSI |
| 4-Hour (4H) | $66,000 / $70,500 | $74,000 / $75,000 | Bear flag invalidation, ascending triangle, MACD Golden Cross |
| 15-Minute (15m) | $72,200 / $73,500 | $74,500 / $80,000 | CVD Spot +$63.9M, successive bull flags, RSI >80 |
Liquidation Heatmap: Anatomy of the Short Squeeze
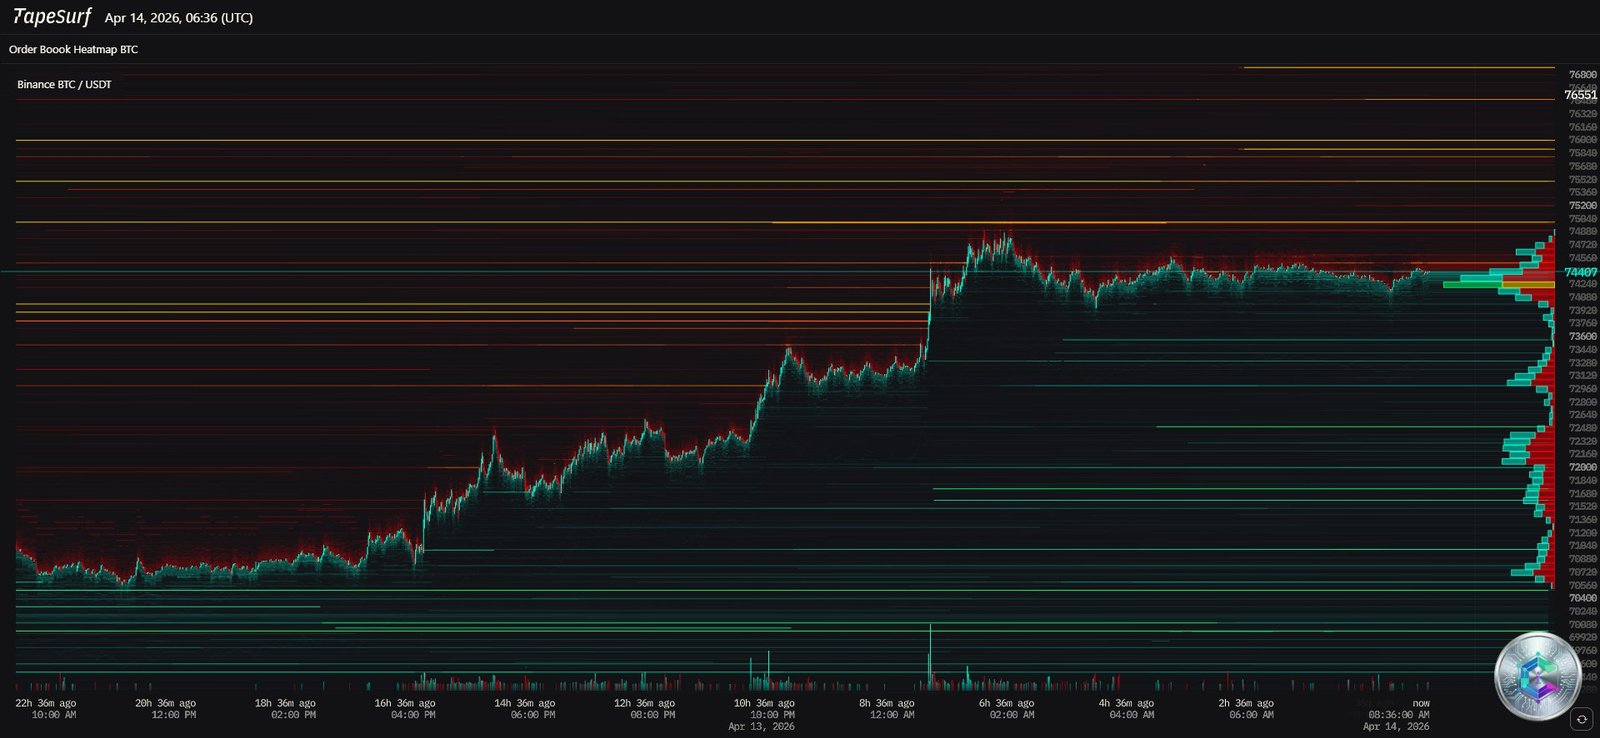
The liquidation order book heatmap reveals the precise mechanics of this explosive rally. Despite the surge past $74,000, the Fear & Greed Index remains frozen at 21 (Extreme Fear), and the retail Long/Short ratio on Binance sits at an excessively low 0.7 — a powerful contrarian signal exposing a structural vulnerability ruthlessly exploitable by institutional algorithms.
- $72,200–$73,500 zone: The short squeeze epicenter. Approximately $6 billion in high-leverage short positions had accumulated here during the geopolitical panic. The violent bullish impulse pierced directly through this zone, incinerating that capital and converting selling pressure into forced buying.
- $75,000–$76,500 resistance walls: Concentrated sell walls (yellow/red bands on the heatmap) — short-term price magnets for directional algorithms.
- $69,000–$70,000 support: Institutional bid walls forming a safety net ready to absorb any bullish reversal.
- $80,000 target: The psychological and liquidity node — the ultimate impulse target before a major consolidation. In just 60 minutes after the $74,000 break, nearly $100 million in short positions were liquidated.
| Price Zone | Liquidity Characterization | Notional | Macro-Structural Impact |
|---|---|---|---|
| $69,000–$70,000 | Bid walls / Long liquidations | Major support | Institutional safety net |
| $72,200–$73,500 | Short liquidation cluster | ~$6B | Short squeeze epicenter |
| $75,000–$76,500 | Sell walls / New liquidations | High density | Near-term directional algo magnet |
| $80,000 | Psychological & short liquidity node | Extreme | Ultimate bullish impulse target |
Quantitative Anomalies: BVOL Volatility, Z-Score & DXY Decoupling
Despite the ambient uncertainty, Bitcoin’s implied volatility indices (BVOL) are hovering at historic floor levels. In quantitative finance, periods of extreme volatility compression on a high-beta asset are the infallible precursors to violent kinetic expansions.
Applying the Z-Score model to the BTC/VIX ratio on a 52-week rolling basis reveals the Z-Score is holding in slightly negative territory — a configuration historically correlated with major cyclical bottom formations and structural accumulation opportunities (buying opportunities). This mathematical framework legitimizes ETF demand during recent price discounts.
The deepest fundamental mutation concerns the BTC/DXY relationship. The historical inverse correlation (coefficient of -0.7 from 2014 to 2020) has not only weakened to approximately 0.45 but has undergone notable positive inversions, confirmed by JPMorgan institutional research. When the DXY recently peaked beyond 100.24, supported by the « higher-for-longer » rate narrative, Bitcoin did not capitulate — it soared in tandem, breaking $72,000 then $74,000. This decoupling certifies that Bitcoin is no longer priced solely as an inverse derivative of fiat liquidity, but as a standalone asymmetric diversification asset.
Synthesis: Second and Third-Order Implications
1. The Definitive Smoothing of Post-Halving Cycles
The classical Bitcoin cycle theory — slow grind, parabolic mania, 80% crash — has been permanently disrupted by institutional adoption. Massive ETF injections (tens of billions) combined with institutional hedging strategies (covered calls) act as immense shock absorbers, limiting the probability of irrational upside mania while erecting a reinforced-concrete floor that renders a systemic 80% crash highly improbable. The market is entering an era of sustained « bullish compression », replacing parabolic frenzy with successive accumulation plateaus.
2. Bitcoin Hegemony and Peripheral Altcoin Drought
Institutional appetite is fiercely selective, concentrating capital flows almost exclusively on Bitcoin. BTC dominance formally sits in the 57%–58% zone (virtually above 72% per some analysts’ methodologies), methodically crushing Ethereum and Solana market share. During liquidity-tightening events, capital flees speculative altcoins to repatriate to Bitcoin — now firmly established as the sovereign « base collateral » of the digital economy.
3. Restructuring of Market Execution Architecture
The uninterrupted ETF inflow metamorphoses the functional role of traditional crypto exchanges, transforming them into critical bridge infrastructure facilitating arbitrage between spot markets and ETF NAV. Price action is now intimately synchronized with Wall Street trading hours, and the prospect of the CLARITY Act will inexorably accelerate convergence toward TradFi compliance standards.
Operational Conclusion
As of April 14, 2026, Bitcoin has achieved an advanced stage of institutional maturity, conferring the capacity to absorb systemic macroeconomic shockwaves with unprecedented resilience. The macroeconomic environment is undeniably restrictive — the Hormuz energy crisis reignited inflationary pressures and virtually eliminated near-term Fed easing prospects. Yet this negative impact is being methodically absorbed and neutralized by the structural power of institutional ETF flows, approaching half a billion dollars on uncertainty-driven trading days.
The charting architecture confirms this robustness: volatility compressed to historically low levels primed for explosive expansion, invalidation of bearish patterns, MACD Golden Cross on the 4H, organic spot CVD. The colossal cluster of $6 billion in short positions between $72,200 and $73,500 provided the fuel igniting the current impulse past $74,000. The psychological and technical resistance of $80,000 is now firmly in the crosshairs. In this new paradigm driven by institutional hyper-financialization, price deviations induced by exogenous panics must mathematically be treated as temporary valuation inefficiencies, destined to be ruthlessly exploited and arbitraged by long-term capital flows.
⚠️ Disclaimer: This article is written for educational and informational purposes only. It does not constitute investment advice, nor a recommendation to buy or sell any digital asset or financial instrument. Cryptocurrency markets are highly volatile and carry a significant risk of capital loss. Please consult a licensed financial advisor before making any investment decision.

