
The Bitcoin market is navigating a critical transition phase on this April 10, 2026, marked by a rare convergence between Middle Eastern geopolitical tensions, Federal Reserve monetary adjustments, and a profound restructuring of institutional liquidity. Following a turbulent fiscal year 2026 that saw a 23% decline from the October 2025 all-time high of $126,000, the asset is stabilizing its price structure around the psychological pivot of $71,000. This report presents an exhaustive technical and fundamental analysis, integrating 15-minute, 4-hour, and daily chart data, complemented by a liquidity heatmap study and on-chain flow analysis.
Macroeconomic Context and Market Fundamentals
Any structural analysis must account for the macroeconomic climate driving Bitcoin’s volatility. As Q2 2026 begins, investor attention is focused on the release of the Consumer Price Index (CPI) for March — the first report to capture the full inflationary shock triggered by the US-Iran military escalation, which pushed WTI crude oil prices above $100 per barrel.
Inflation Dynamics and Fed Policy
The Federal Reserve, facing persistent inflation and energy supply chain tensions, is maintaining a firmly hawkish stance. The target rate, currently set between 3.50% and 3.75%, shows no signs of declining soon, with markets pricing in an 89% probability of a hold at the April 28–29 FOMC meeting. This « higher for longer » outlook weighs heavily on risk assets, with Bitcoin increasingly behaving like a high-beta technology asset rather than an uncorrelated store of value.
| Economic Indicator | Forecast (March 2026) | Previous (Feb. 2026) |
|---|---|---|
| Annual CPI Inflation | 3.3% – 3.7% | 2.4% |
| Annual Core CPI Inflation | 2.7% | 2.5% |
| Non-Farm Payrolls | +178,000 | +186,000 |
| Consumer Sentiment (U. Mich) | Pending | 71.2 |
Geopolitics: The Fragile Ceasefire
The announcement of a conditional two-week ceasefire between Washington and Tehran acted as a relief catalyst, allowing Bitcoin to bounce from its February lows at $60,000 to retest the $72,000 zone. However, the fragility of this agreement — underscored by continued Israeli strikes in Lebanon — keeps the market in a state of heightened caution according to sentiment indices.
Liquidity Heatmap Analysis
The order book heatmap reveals a market structure dominated by significant liquidity walls bracketing the current price. The current distribution suggests an intense compression phase whose resolution will determine the next major directional move.
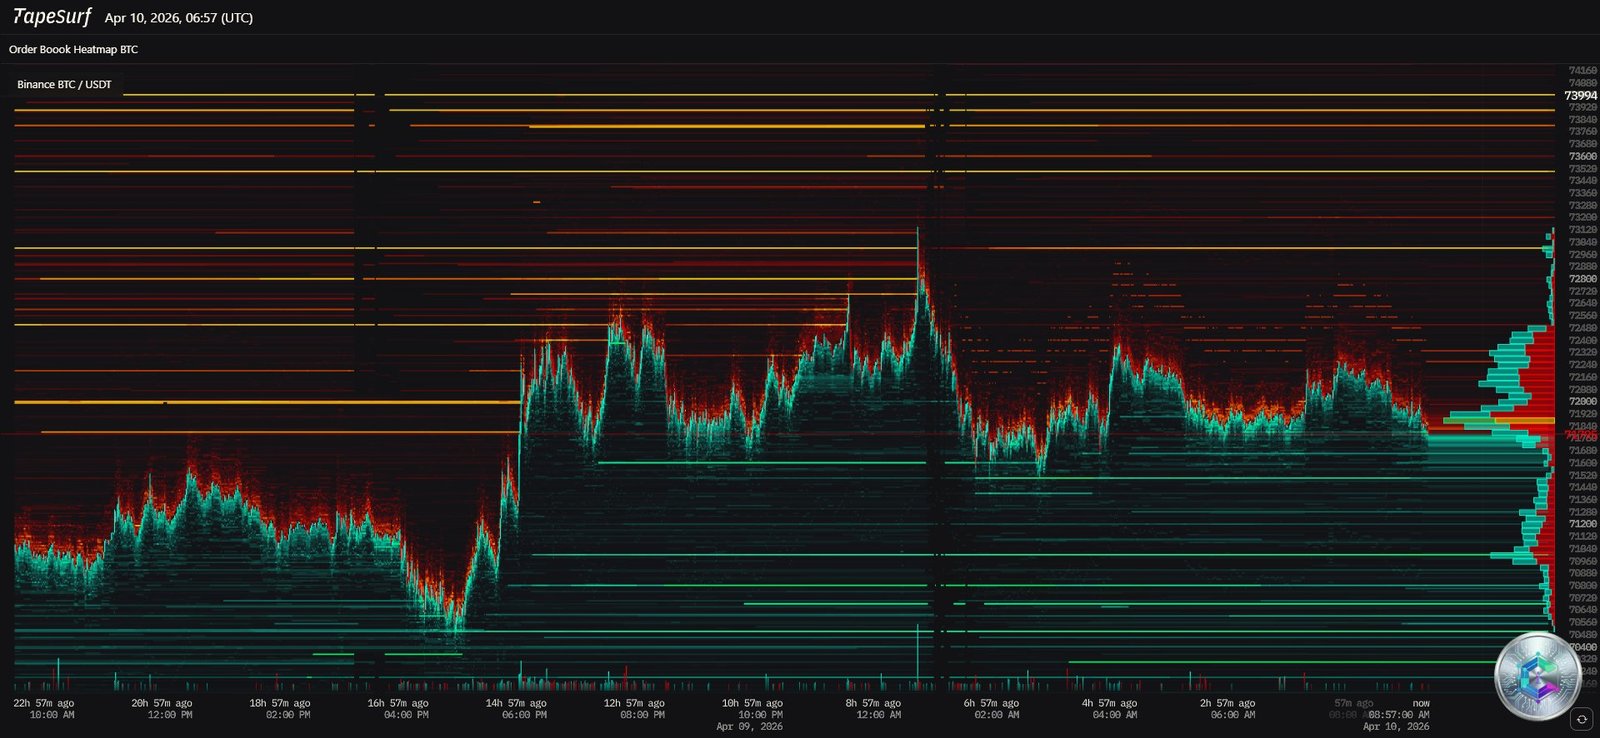
Resistance Walls and Short Squeeze Zones
The heatmap highlights a massive concentration of leveraged short positions between $72,200 and $73,500, representing approximately $6 billion in potential liquidations with a peak density around $72,500.
- $72,800 – $72,960: Institutional sell walls visible on the heatmap, corresponding to local weekly highs.
- $73,994: Extreme resistance level — the final barrier before an extension toward $75,000.
The short squeeze mechanism represents the most probable bullish breakout scenario. If spot demand absorbs these sell orders, the triggering of forced liquidations could propel the price toward $80,000 through a cascade effect.
Support Zones and Liquidity Magnetism
| Liquidity Zone | Order Type | Technical Implication |
|---|---|---|
| $73,500 – $74,000 | Sell (Walls) | Major resistance; consolidation ceiling |
| $72,200 – $72,500 | Short Liquidations | Squeeze zone; bullish volatility trigger |
| $68,000 – $68,700 | Buy (Support) | Dynamic support; bulls’ line of defense |
| $64,000 | Magnetism | Probable sweep zone before bounce |
Daily Chart Technical Analysis

The daily chart depicts a bearish underlying trend attempting to stabilize. The most striking feature of early 2026 is the formation of a « Death Cross » in March, when the 50-day EMA crossed below the 200-day EMA.
Moving Averages and Structural Pivot Points
The current price of $71,476 sits in a crucial battle zone. Bitcoin has managed to reclaim above the EMA 50 (around $70,500), constituting a short-term strength signal:
- EMA 50 ($70,609): First dynamic support. A daily close below this level would invalidate the current recovery attempt.
- EMA 100 ($75,459): Intermediate resistance, coinciding with the 23.6% Fibonacci retracement of the decline from the 2025 ATH.
- EMA 200 ($83,510): The true « trend divider. » As long as Bitcoin remains below this line, the market is structurally bearish.
Oscillators and Momentum (Daily)
The 14-day RSI sits at 54.86, reflecting neutral momentum with a slight bullish bias — leaving significant room to rally before reaching overbought territory (70+), potentially allowing a move to $75,000 without immediate exhaustion.
The MACD shows signs of recovery with histogram bars contracting toward the zero line, suggesting selling pressure is waning. A confirmed bullish crossover on the daily timeframe would be the first robust technical reversal signal since November 2025.
⚠️ A Bear Flag is visible on higher timeframes — a pattern warning that the current rally may be merely a technical correction before another leg down toward $50,000 if the channel support is broken.
4-Hour Chart Analysis
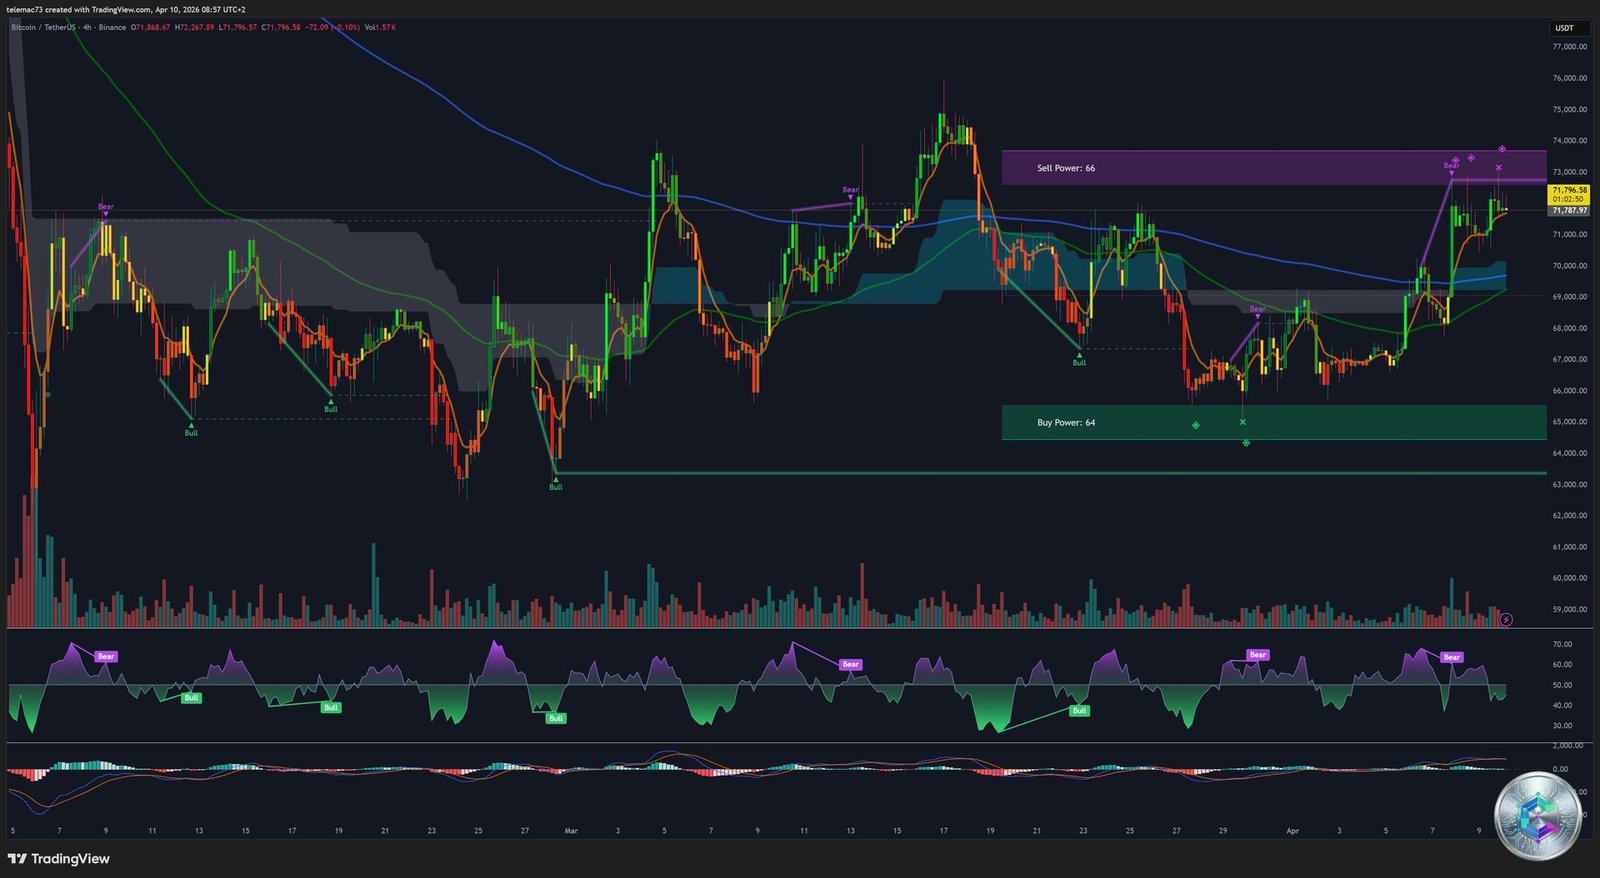
The 4H chart provides a tactical view of market participant psychology. Bitcoin appears to have formed a « higher low » after bouncing from the $70,000 level, placing buyers in relative control.
Ichimoku and Bollinger Bands
Price is struggling with the upper boundary of the Ichimoku Cloud (Kumo). A breakout above the cloud would confirm a volatility regime change. Bollinger Bands show a squeeze — an indicator of an imminent volatility explosion. Price oscillates near the upper band ($72,634), signaling strong buying pressure but also rejection risk if volume doesn’t confirm the breakout.
| Pivot Level (4H) | Value | Significance |
|---|---|---|
| Key Resistance | $72,700 | Local high; breakout failure on April 9 |
| Momentum Pivot | $70,000 | MA 50 and 200 confluence on 4H |
| Dynamic Support | $68,750 | Breakdown line toward bearish continuation |
| Major Support | $60,000 – $63,000 | Recent double bottom; massive accumulation zone |
15-Minute Intraday Analysis
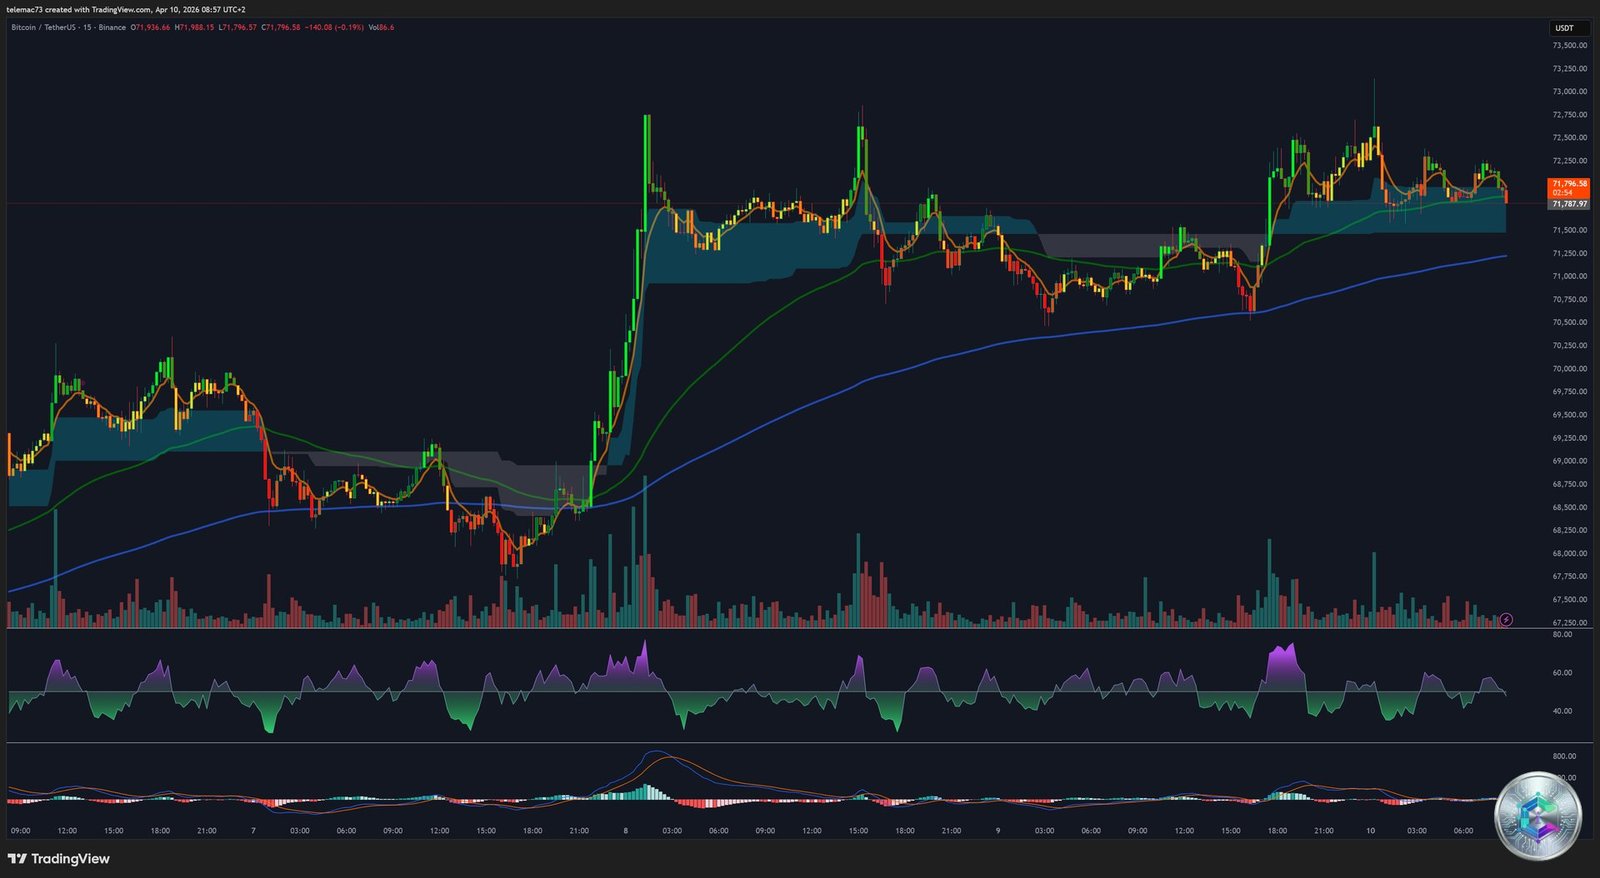
The 15-minute chart is essential for identifying price micro-structures ahead of the CPI release. A tight consolidation is visible between $71,000 and $72,000, forming a compression triangle / pennant just below the $72,300 resistance.
This configuration is typical of the wait-and-see posture before major macroeconomic announcements:
- 📈 Bullish breakout: target $73,500
- 📉 Bearish breakdown: return toward $70,000 pivot
The 15-minute Stochastic RSI shows overbought conditions (98.42), suggesting a need for a breather before the next push. Relatively low intraday volume increases the risk of a fakeout on the zone’s breakout.
Institutional Capital Flows and ETFs
The institutional landscape in April 2026 is the primary driver of Bitcoin’s resilient demand. US spot ETF flows act as a liquidity sponge, absorbing a significant portion of circulating supply.
BlackRock Dominance and Morgan Stanley’s Entry
BlackRock’s IBIT fund maintains its dominance with over 60% market share among spot ETFs. On April 6, ETFs recorded their strongest daily inflow since February at $471 million, signaling that « strong hands » view current levels as an accumulation opportunity. Morgan Stanley’s entry (MSBT) on April 9 ($30.6M in flows on day one) introduces a new wealth management client base that could stabilize prices above $70,000 through consistent demand.
Whale Behavior
For the second consecutive week in 2026, wallets holding more than 10,000 BTC are recording net inflows. This silent whale accumulation, independent of ETF flows, is a strong signal of preparation for a supply squeeze. Historically, such accumulation phases precede major consolidation breakouts toward new highs.
On-Chain Analysis: Network Psychology and Health
The global Realized Price stands at $54,000, while the « True Market Mean » is estimated at $78,000. The fact that the current price of $71,000 sits between these two boundaries indicates we are not in a euphoric phase, but in a structural transition zone. Only 59% to 61% of Bitcoin supply is currently in profit — historically low for a bull market — suggesting that the market has been « cleansed » of short-term speculators, creating a stronger base for a future rally.
The Short-Term Holder (STH) cost basis currently sits at $81,600 — a massive psychological resistance generating selling pressure at every rally from those seeking to exit at breakeven.
Pivot Point Matrix — April 10, 2026
The central pivot for the April 10, 2026 session sits at $71,539.
| Level | Price | Technical Significance |
|---|---|---|
| R3 | $74,578 | Extreme extension; massive profit-taking zone |
| R2 | $73,710 | Major resistance; Heatmap sell wall |
| R1 | $72,407 | First barrier; short liquidation zone |
| P (Pivot) | $71,539 | Central Pivot; market equilibrium |
| S1 | $70,236 | First support; daily EMA 50 |
| S2 | $69,368 | Secondary support; 15M channel base |
| S3 | $68,065 | Major support; weekly floor |
Q2 2026 Forecast Scenarios
🟢 Bullish Scenario: The « Supply Squeeze » Toward $80,000
If March CPI comes in at or below expectations (3.3%), the US-Iran ceasefire stabilizes, and Bitcoin breaks the short liquidation zone at $72,500, a mechanical rally toward $76,000 (EMA 100) then $80,000 becomes the primary scenario, fueled by whale accumulation and constant ETF inflows.
🔴 Bearish Scenario: Support Break and $60,000 Retest
If CPI exceeds 3.5%, the Fed could signal a potential rate hike, triggering a massive institutional capital withdrawal (« risk-off »). Bitcoin loses the critical EMA 50 support at $70,500 and falls back into the magnetic liquidity zone at $64,000. A close below $60,000 would open the path to a deep correction toward $50,000.
Summary and Key Monitoring Points
The combined analysis of multi-timeframe charts and the Heatmap suggests an accumulation phase under extreme tension. Bitcoin is in recovery mode but still trapped within a bearish structure inherited from late 2025.
- Monitor the $71,500 Pivot: Holding above this level is the intraday confidence barometer. Any incursion below weakens the recovery narrative.
- Daily RSI: An RSI approaching 60–65 will signal possible congestion before breaking $75,000.
- Heatmap — Walls at $73,994: If these walls begin to retreat, market makers are anticipating a bullish breakout.
- Macro Influence: Until the Fed meeting in late April, volatility will be dictated by bond yields and oil prices.
The breakout from the $68,000 – $74,000 consolidation zone will define the trend for the entire second quarter of 2026. The strength of the institutional infrastructure (ETFs) and the silent whale accumulation create a demand base that limits downside potential — but the market remains under the structural pressure of the Death Cross and the Bear Flag visible on higher timeframes.
⚠️ Disclaimer: This article is published for educational and informational purposes only. It does not constitute investment advice, nor a recommendation to buy or sell digital assets. Cryptocurrency markets are highly volatile and speculative. All investments carry risk, including the total loss of invested capital. Please consult a licensed financial advisor before making any investment decisions.