
Bitcoin is undergoing a profound structural transformation in May 2026. Oscillating within a tightly compressed volatility corridor between $75,500 and $82,270, the digital asset reveals a growing asymmetry between global macroeconomic dynamics and its intrinsic fundamentals. For the first time in its history, the four-year halving cycle has been relegated to the background, supplanted by institutional macroeconomics and planetary-scale liquidity management. This report dissects this new reality through an exhaustive study of macro factors, ETF institutional flows, and a rigorous multi-timeframe chart analysis.
The End of the Halving Paradigm
For over a decade, the dominant theory rested on the four-year halving cycle: a pre-halving accumulation phase, followed by a bullish euphoria peaking 12 to 18 months later. This model worked with formidable precision during the 2012–2013, 2016–2017, and 2020–2021 cycles. But the cycle initiated by the April 2024 halving failed to produce the expected euphoria for 2025.
Instead, Bitcoin marked an early all-time high (ATH) of $126,000 in late October 2025, before entering a prolonged distribution phase. Today, in May 2026, the market trades approximately 39% below that ATH. The microstructure is no longer dominated by miner supply, but by massive spot ETF flows, central bank monetary policies, corporate treasuries, and exogenous geopolitical tensions.
Macroeconomic Architecture: A Particularly Hostile Environment
The Iranian Energy Shock and Resurgent Inflation
The fundamental catalyst of current pressure lies in the escalating conflict involving Iran. Disruptions in the Strait of Hormuz have created a severe supply shock in energy markets, propelling WTI crude above $99 per barrel. The transmission to the real economy is quantifiable: the US Producer Price Index (PPI) surged +1.4% for April 2026 alone, mechanically pushing back any hopes of Fed monetary easing.
The direct consequence on bond markets: the yield on the 30-year US Treasury note surpassed 5.19%, an all-time high not seen since July 2007, preceding the Great Financial Crisis. Such a high discount rate mechanically drains liquidity from risk assets, as fund managers reallocate toward guaranteed-yield bonds. Notably, brief statements from Donald Trump about negotiations « nearing conclusion » with Iran were enough to temporarily stabilize Bitcoin around $78,000 — illustrating its total macro dependence.
The Historic US Sovereign Credit Downgrade
Moody’s downgraded the US sovereign credit rating from Aaa to Aa1, a historic decision driven by deteriorating fiscal parameters and the astronomical cost of debt service. Paradoxically, this downgrade — which should theoretically have favored Bitcoin as « digital gold » — instead triggered a wave of generalized risk aversion. Institutional portfolio managers, facing increased volatility in their bond portfolios, reduced exposure to the most volatile assets, dragging Bitcoin into a consolidation spiral around $77,000.
| Macroeconomic Parameter | Value (May 2026) | Impact on Risk Assets |
|---|---|---|
| US Treasury Yield (30Y) | 5.19% (Highest since 2007) | ⛔ Very negative |
| PPI Inflation (April 2026) | +1.4% | ⛔ Negative |
| WTI Crude Oil Price | > $99 / barrel | ⛔ Negative |
| US Sovereign Rating (Moody’s) | Aa1 (from Aaa) | ⚠️ Mixed |
| Bitcoin ATH | ~$126,000 (Oct. 2025) | — |
| Drawdown from ATH | -39% | 📉 Post-mania consolidation |
The Kevin Warsh Effect: The Fed Transition and Monetary Friction
The central event of the third week of May 2026 is institutional: on May 22nd, Kevin Warsh was sworn in as the 17th Chairman of the Federal Reserve Board of Governors, succeeding Jerome Powell. The ceremony, organized by Donald Trump at the White House, took place in an atmosphere of intense political polarization, with the Senate confirmation vote following strictly partisan lines.
Market reaction was immediate and brutal. Within minutes of the ceremony’s conclusion, Bitcoin collapsed from $78,000 to a low of $75,500, confirming a well-known heuristic in crypto markets: « Three Fed transitions, three crashes, zero exceptions. » Warsh publicly affirmed his commitment to strict monetary orthodoxy, creating an explosive dichotomy between political expectations of cheap money and the Fed’s legal price stability mandate. Wall Street now anticipates a possible rate hike by end of 2026 — a total reversal from the multiple rate-cut hopes that prevailed at the start of the year.
Institutional Flow Dynamics and the Spot ETF Ecosystem
Spot Bitcoin ETFs now dictate short-term directional momentum, completely supplanting the traditional impact of post-halving miner supply shocks. May 2026 flow data tell a story of unprecedented selling pressure:
- May 13: Net outflows of $635M — the largest daily withdrawal since January 2026.
- Following week: $648M in outflows on Monday, then an additional $331M on Tuesday.
- Wednesday: Dramatic slowdown to just $70M in outflows — a sign of seller exhaustion.
The mechanics are clear: when an institutional investor sells ETF shares, the Authorized Participant (AP) buys back those shares and liquidates the underlying Bitcoins on Coinbase, creating asymmetric and relentless selling pressure on the spot order book. This redemption cascade is precisely what prevented BTC from sustaining above $80,000.
Meanwhile, on-chain data reveals strategic accumulation: BlackRock transferred 1,587 BTC ($122.55M) to Coinbase Prime — an operational rebalancing, not a liquidation. SpaceX disclosed to the SEC holding 18,712 BTC on its balance sheet, surpassing its sister company Tesla. Abu Dhabi sovereign wealth fund Mubadala increased its stake in BlackRock’s Bitcoin ETF by 16% amid the turbulence — an extraordinarily strong long-term conviction signal.
| Institutional Dynamic | Entity | Volume / Value | Impact |
|---|---|---|---|
| Massive ETF net outflows | Various institutions | $635M, $648M, $331M/day | Direct spot selling pressure |
| ETF outflow slowdown | Various | $70M (Wednesday) | Seller exhaustion signal |
| On-chain transfer to custody | BlackRock | 1,587 BTC ($122.55M) | Operational rebalancing |
| SEC treasury disclosure | SpaceX | 18,712 BTC | Major corporate adoption signal |
| ETF stake increase | Mubadala (Sovereign Fund) | +16% | Long-term bullish conviction |
| Strategic accumulation zone | « Strategy » entity | Average cost at $75,537 | Massive structural floor |
Multi-Timeframe Chart Analysis
Daily Chart (1D): Compression Triangle Below the 200 MA
On the higher timeframe, Bitcoin trades within a massive descending compression triangle, typical of post-shock institutional accumulation phases. The market is caught between two forces of colossal power:
- Triple-tested support at $76,000: Defended relentlessly throughout May 2026, with wicks pushing as low as $76,300 on May 19th without ever closing below. An institutional floor, not a coincidence.
- Dynamic resistance: 200-day MA at $82,270: Rejected 7 times in May. This bull/bear market demarcation line acts as an absolute institutional glass ceiling.
Oscillators confirm seller exhaustion: the daily RSI displays a hidden bullish divergence (identical price lows, but RSI progressively rising). The MACD shows a historic histogram compression — the infallible marker of a « volatility squeeze » preceding an exceptionally violent directional move.
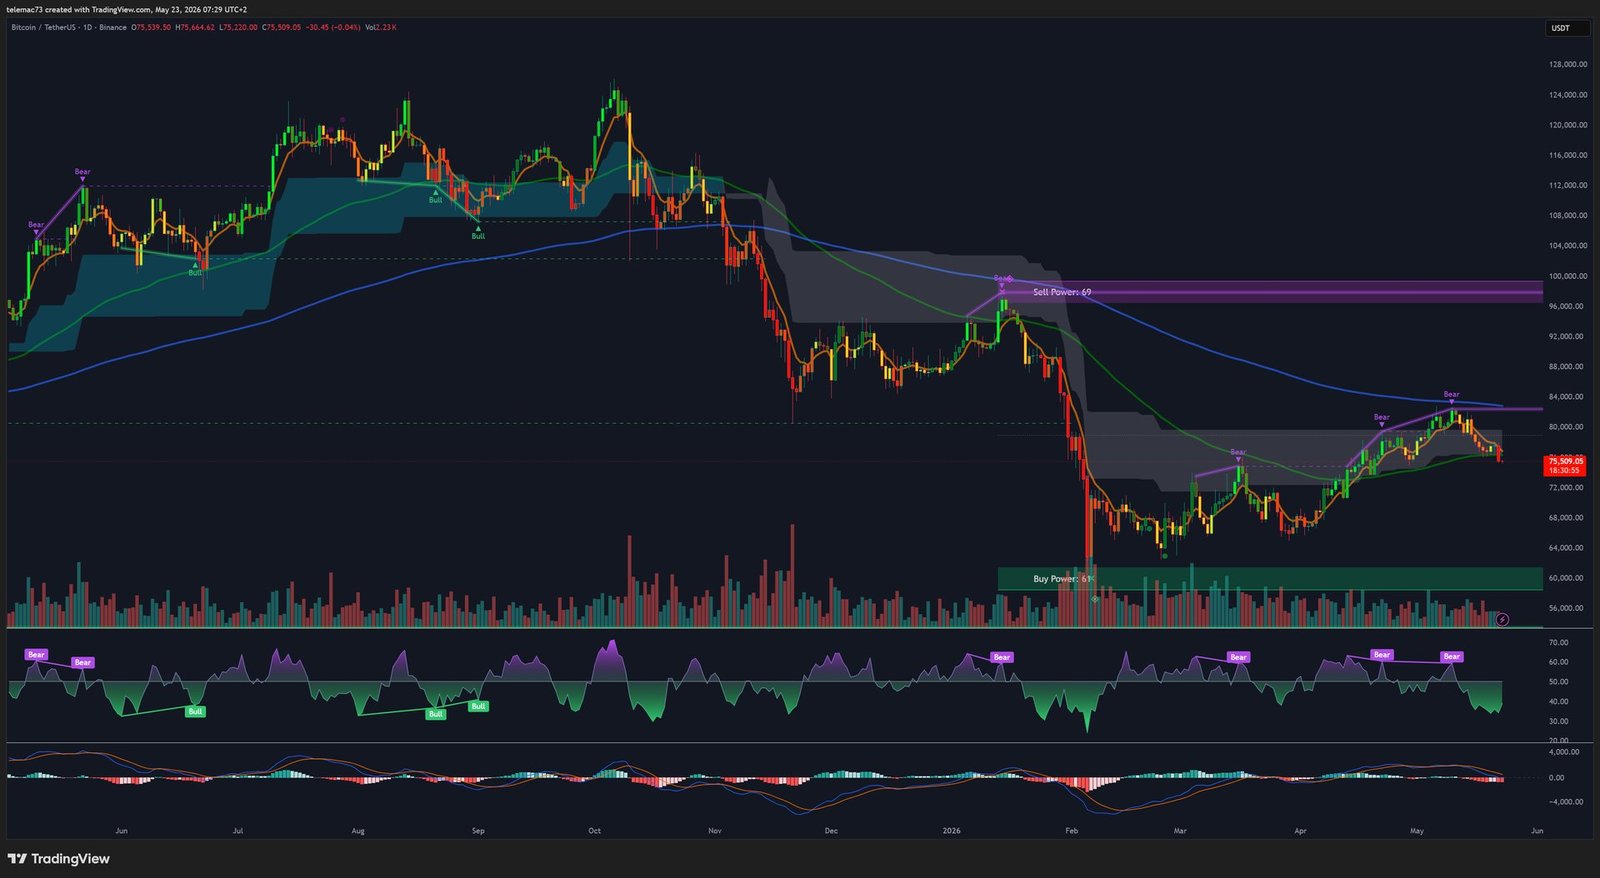
| Technical Level | Price (USDT) | Significance |
|---|---|---|
| 200-day MA resistance | $82,270 | Rejected 7x in May. Institutional ceiling dictating the trend |
| Psychological resistance | $80,000 | Essential threshold to reverse market sentiment |
| Immediate pivot resistance | $78,000 | Potential neckline for a bullish reversal pattern |
| Major triple-tested support | $76,000 | Critical survival zone. Break = thesis invalidation |
| Institutional accumulation zone | $75,537 | « Strategy » average cost. Massive liquidity wall |
| Structural pullback support | $74,500 | Bearish target if $76,000 broken on daily close |
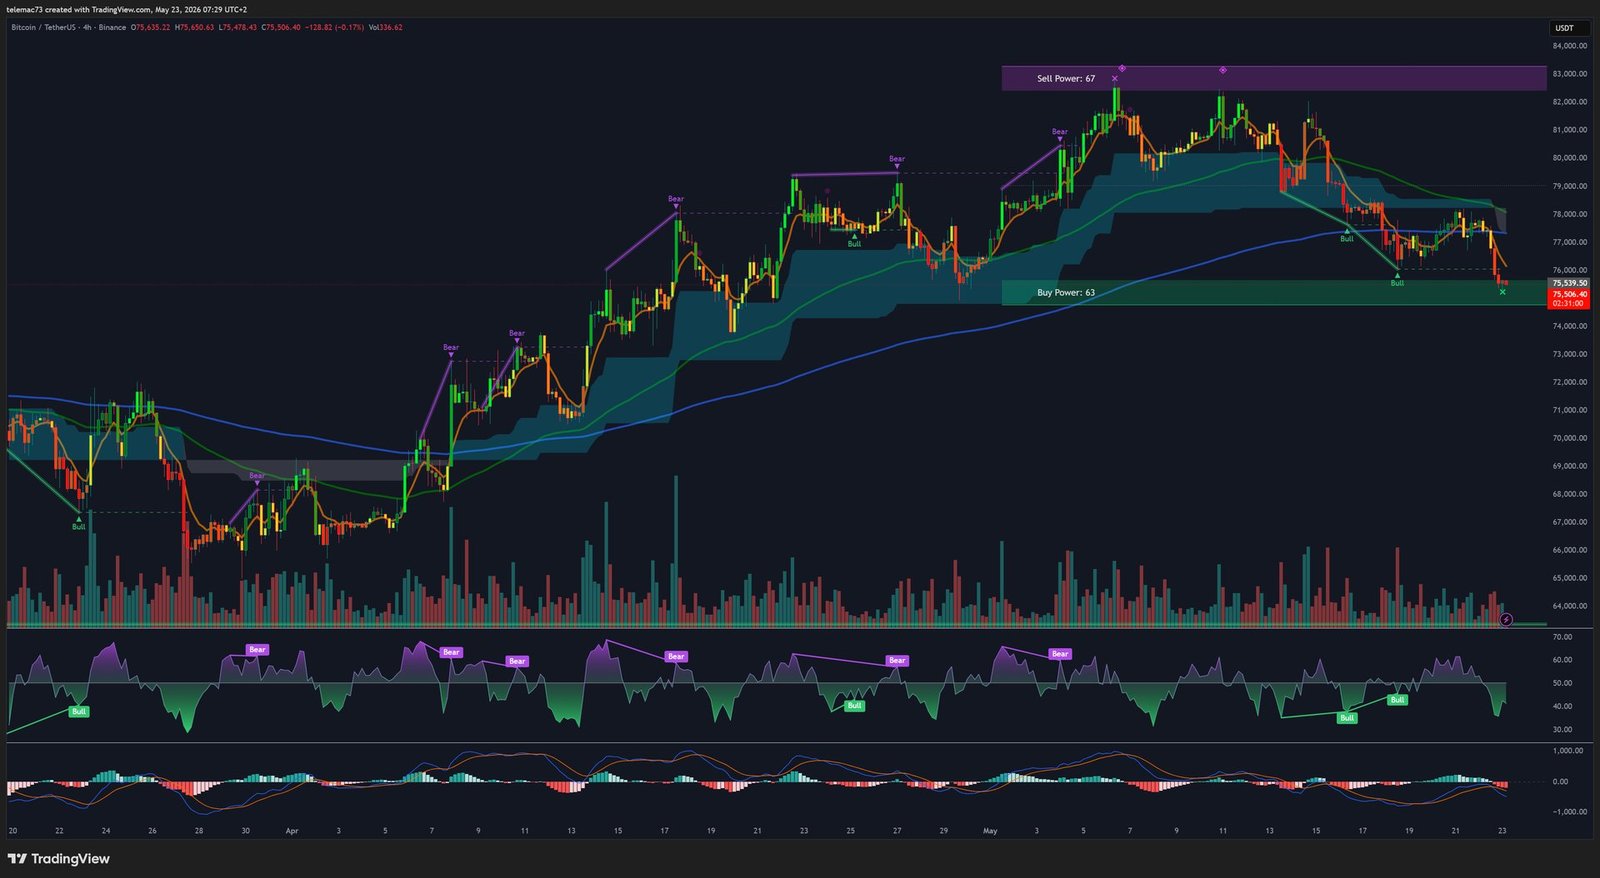
4-Hour Chart (4H): Invalidated Double Bottom and Bear Flag
The intermediate timeframe reveals a particularly instructive chartist mechanic. Before the Fed-induced volatility, the market had meticulously drawn a bullish Double Bottom pattern on the $78,000 zone, catalyzed by Nvidia’s excellent quarterly results (+1.5% BTC intraday rebound). Price had even managed to reclaim the 200-period Exponential Moving Average (200 EMA) at $77,700.
But the Warsh swearing-in crash completely invalidated this Double Bottom. Worse: the subsequent ascending consolidation transformed into a classic Bear Flag — a bullish trap that reloaded short sellers with liquidity before triggering the next leg down to $75,500.
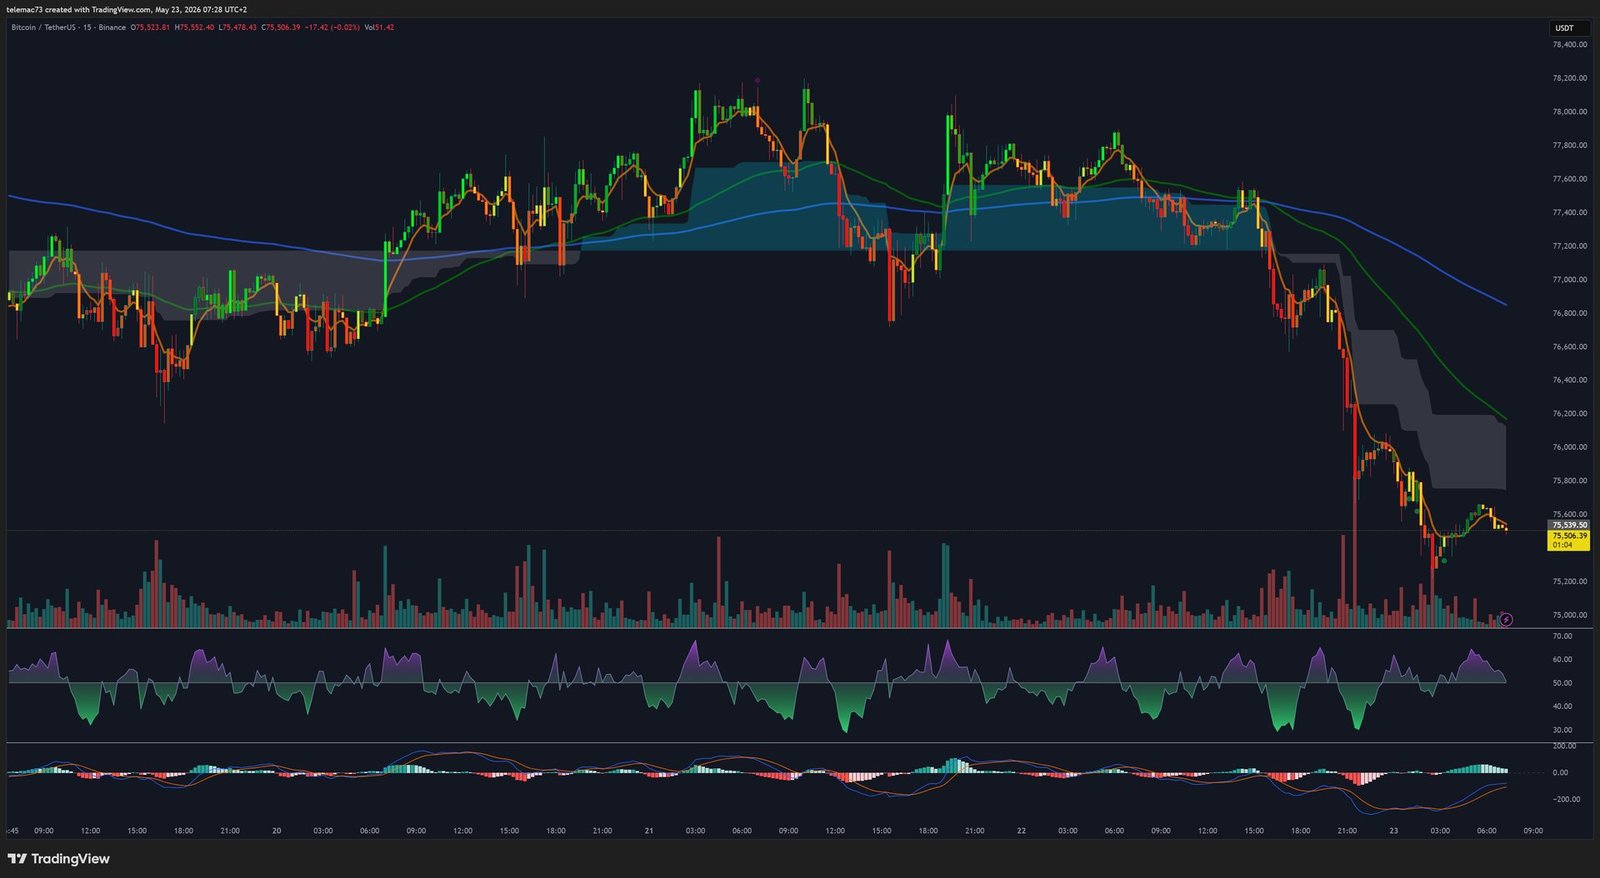
15-Minute Chart (15M): Anatomy of a $485M Flash Crash
The 15-minute chart provides a spectacular real-time radiograph of predatory HFT algorithm behavior during the Warsh exogenous shock. The collapse unfolded in just a few candles: news sentiment bots flooded order books with market sell orders the moment the ceremony concluded, plunging BTC from $77,400 to $75,500.
Oscillator anomalies are spectacular: the 15M RSI plunged below 15–20, extreme oversold territory, before rebounding in a « V » shape — a mechanical dead cat bounce following seller exhaustion. The 15M MACD printed a bearish crossover of brutal ferocity. In cascade, $485M in leveraged positions were liquidated across crypto markets, of which more than $430M were long positions — a massive purge that paradoxically cleanses the ecosystem by eliminating excessive leverage.
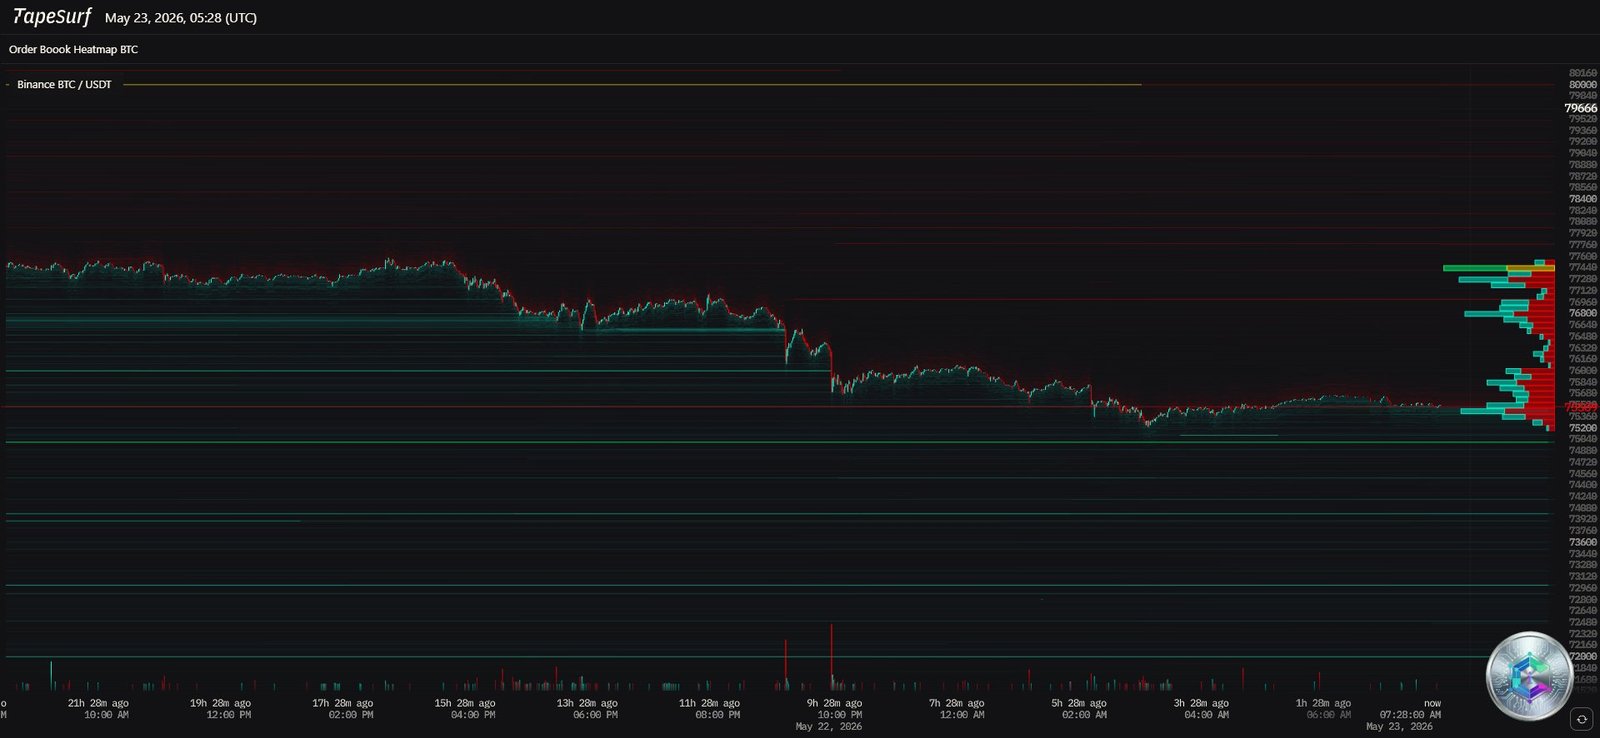
Order Book Heatmap: The Institutional Wall at $75,537
The order book heatmap is the ultimate analytical tool of modern market microstructure. It reveals the market’s future intentions through the concentration of pending limit orders.
Heatmap analysis corroborates on-chain data: a massive concentration of buy orders sits precisely between $75,000 and $75,500, corresponding to the « Strategy » entity’s average acquisition cost of $75,537. This impenetrable liquidity wall ended the $485M liquidation cascade — aggressive short sellers and HFT algos shatter against this institutional bulwark. Conversely, the zone above $78,000 shows particularly thin supply-side liquidity, suggesting a potential bullish acceleration on any sustained breakout — potentially a violent short squeeze.
AI Modeling and Altcoin Rotation
In an environment of such multifactorial complexity, artificial intelligence models complement human analysis. Grok AI (Elon Musk ecosystem) models a conditionally bullish trajectory for Bitcoin, targeting the $88,000–$95,000 zone by end of May 2026 — under two non-negotiable conditions:
- A sustained resumption of spot ETF accumulation surpassing current redemptions.
- Markets begin seriously pricing in future Fed rate cuts — which would require a marked deterioration in economic data or a rapid oil price de-escalation.
The identified technical trigger is absolute: a confirmed move above $82,000 (corresponding to the 200-day MA at $82,270) would instantly transform momentum polarity, opening the path to structural exploration of new price territory. For altcoins, models project ETH potential between $2,700 and $3,000 (contingent on breaking $2,500), and XRP between $1.60 and $2.50 pending legislative progress via the CLARITY Act.
The Decisive Catalyst: PCE Data Publication
The entire current microstructure is suspended in anticipation of the PCE (Personal Consumption Expenditures) index publication, the Fed’s preferred inflation gauge:
- Bullish scenario (Soft Print): A moderate PCE would decisively counteract the fears raised by the PPI surge at +1.4%. Bond yields would retreat from 5.19%, stabilizing digital assets and opening the path toward a frontal assault on the 200-day MA at $82,270.
- Bearish scenario (Hot Print): Inflation above consensus expectations would reinforce the probability of rate maintenance or even a hike under Warsh’s strict Fed. The market would then test the $76,000 floor for the fourth time. The more a support is hammered, the more exponentially its probability of breaking increases — the next target would be $74,500.
Synthesis: A Market in Ontological Transformation
Bitcoin in May 2026 is an asset in full identity redefinition. The halving cycle failure — visible in the premature ceiling at $126,000 in October 2025 — certifies that the simplistic heuristic models of the past are obsolete. The asset has irreversibly shifted into the paradigm of globalized institutional macroeconomics.
The 2026 environment is hostile: Kevin Warsh at the Fed, oil at $99, 30-year yields at 5.19%, US sovereign rating downgrade. But the chart structure and on-chain data temper the pessimism: the unshakeable confluence at $76,000 — defended by the massive accumulation orders of SpaceX (18,712 BTC), Mubadala (+16%), and the « Strategy » entity (average cost $75,537) — demonstrates that Bitcoin’s institutional integration continues its relentless march.
If the 200-day MA at $82,270 breaks: $90,000 target per AI quantitative models.
If the $76,000 support fails: Capitulation toward $74,500 and beyond.
The modern Bitcoin market now demands macro-fundamental analytical rigor, mastery of algorithmic microstructure, and absolute risk management discipline. The spring is coiled. The breakout will be violent.
⚠️ Disclaimer: This article is written for exclusively educational and informational purposes. It does not constitute investment advice, a recommendation to buy or sell, or an incentive to invest in crypto-assets. Cryptocurrency markets are extremely volatile. Any investment carries risks of capital loss, which may be total. Please consult a licensed financial advisor before making any investment decision.