
Bitcoin has plunged below the $69,000 mark, hitting its weakest level since early April, as three negative forces converge to challenge the bullish narrative of early 2026.
Key Takeaways
- Bitcoin fell below $69,000, down over 4% in 24 hours to a two-month low.
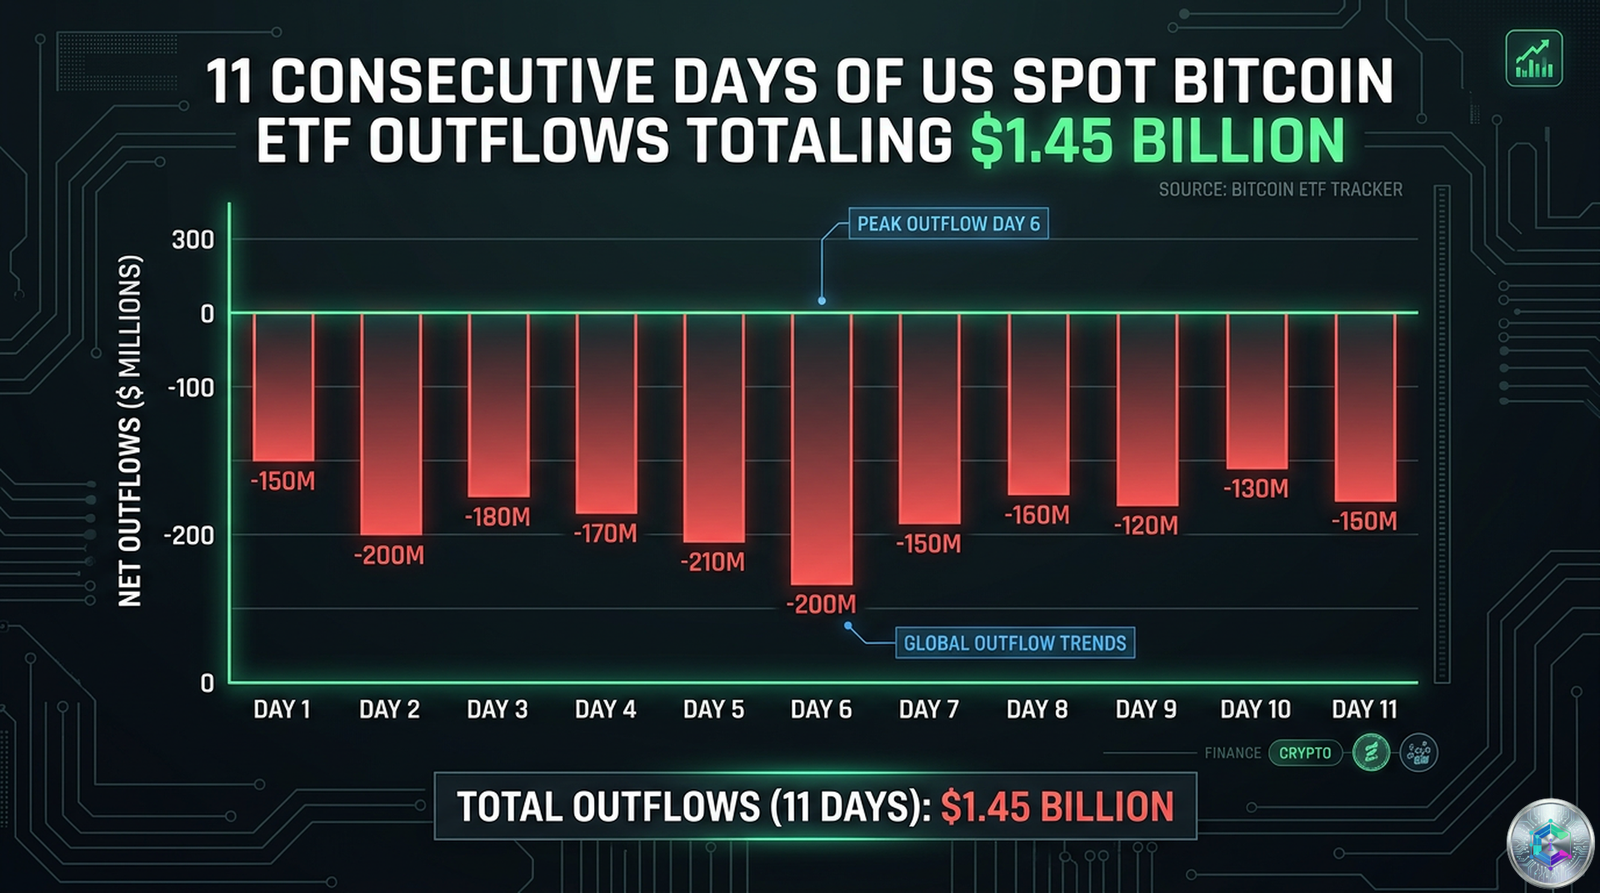
- US spot Bitcoin ETFs recorded an 11-day outflow streak totaling $3.45 billion.
- Liquidations hit $742 million, with over 138,600 traders forced out.
- Onchain metrics show demand stalling, with realized capitalization growth collapsing 57%.
- Macro headwinds include S&P 500 highs and rotation into equities, reducing crypto appeal.
ETF Outflows and Liquidation Cascade
The most striking development is the 11-consecutive-session streak of net outflows from US spot Bitcoin ETFs. According to data from The Block and SoSoValue, these funds collectively shed approximately $3.45 billion over this stretch. May closed with a monthly net outflow of $2.43 billion, the largest single-month redemption since November 2025.
| Period | Net Outflows (USD) | Key Event |
|---|---|---|
| November 2025 | $3.79B | Record monthly outflow |
| May 2026 | $2.43B | Largest since Nov. 2025 |
| 11-Day Streak (June 2026) | $3.45B | Current record streak |
The flagship fund, BlackRock’s iShares Bitcoin Trust, recorded its largest single-day outflow since launch, including a $1.29 billion dark-pool block trade. Ethereum ETFs followed a similar trajectory with 14 consecutive sessions of outflows totaling $712.56 million. This dual bleed indicates portfolio trimming by institutions, not mere rotation.
Liquidation details
Derivatives markets amplified the spot weakness. According to CoinGlass, over 138,600 traders were liquidated across exchanges in 24 hours for a total notional of $742.29 million. The largest order—a $23.99 million BTCUSDT long on Binance—highlights the asymmetry of the move. Bitcoin futures registered their largest long-liquidation spike of the current drawdown, with over $1 billion in crypto liquidations reported over the broader 24-hour window.
Onchain Analysis: A Demand Vacuum
The onchain picture offers no respite. In a weekly note, Glassnode analysts described a visibly deteriorating market structure. The monthly change in realized capitalization, a proxy for net value of coins moving on-chain, collapsed 57% and hovers near zero—meaning almost no new capital is being absorbed by the network in real terms. The Cumulative Volume Delta swung 143% negative, signaling sellers have taken control of price discovery.
« The machine is running, but nobody’s refueling it. »
Glassnode, Weekly Onchain Report
Only 59.8% of BTC supply is now in profit, down from 61.5% the week prior. The realized profit-to-loss ratio turned negative at -0.9—a reading often associated with late-stage capitulation. Realized losses exceed $1.2 billion per day, with a dense cost-basis cluster between $66,900 and $70,600.
Corporate Treasuries and Macro Headwinds
The corporate side provides no counterweight. Strategy (formerly MicroStrategy) holds over 713,000 BTC at an average cost above $76,000, leaving the position significantly underwater. The company recently sold Bitcoin for the first time since 2022, undermining the perpetual buyer thesis.
The S&P 500 closed at fresh record highs, fueled by AI optimism, pushing institutional capital toward equities. The macro calendar hasn’t helped: the ISM Manufacturing Survey jumped to 54, reducing odds of near-term Fed rate cuts. The dollar remains strong, and US 10-year Treasury yields hover around 4.45%.
Ethereum and Historical Context
Ethereum trades around $1,975, below the psychological $2,000 threshold. A sustained break opens the path to $1,900 and potentially $1,800. Technical upgrades remain a constructive factor but insufficient to offset ETF outflows and high yields.
Historically, sustained ETF outflows have often coincided with periods of market stress that later form local bottoms. The current configuration—record-length streak, elevated realized losses, heavy long liquidations, and structurally weak demand—fits the pattern of late-stage capitulation rather than a healthy mid-cycle correction.
What to Watch Next
Three catalysts will set the tone for the coming week: Friday’s Nonfarm Payrolls report, the trajectory of US spot ETF flows, and Bitcoin’s behavior around the $66,900 to $70,600 cost-basis cluster identified by Glassnode. Leveraged positioning has been cleaned out, but a recovery hinges on the return of demand.
Conclusion
The data unambiguously signals materially softened demand, deleveraged positioning, and stalled onchain capital formation. Whether this represents a late-stage shakeout clearing the way for the next leg higher—or the start of a more durable bearish regime—depends on the flow data over the coming sessions. If ETF flows turn positive and macro headwinds ease, this drawdown could prove cyclical; otherwise, the $66,900–$70,600 cluster will likely exert gravitational pull.
Sources
- The Block – Bitcoin hits two-month low amid outflow streak
- The Block – Spot Bitcoin ETFs extend negative streak
- CoinDesk – Bitcoin ETFs record nine-day outflow streak
- Glassnode – Weekly onchain report
- CoinGlass – Derivatives liquidation data
This article is published for informational and educational purposes only. It does not constitute investment advice. Conduct your own research (DYOR) before any decision.