
1. Digital Asset Market Overview
The Bitcoin (BTC) market is navigating a critical transitional phase in April 2026, caught in the crossfire of opposing forces of rare intensity: deepening institutional adoption on one side, and persistent selling pressure driven by prolonged monetary policy uncertainty and exogenous geopolitical tensions on the other.
Historical cycle analysis consistently demonstrates that these volatility contraction phases, coupled with macroeconomic uncertainty, systematically precede major directional moves — moves amplified by the derivatives market structure itself, where forced liquidation mechanics act as trend accelerators.
Recent erratic price swings — euphoric spikes beyond $72,000 immediately followed by violent rejections back below $71,000 — reflect a fractured market psychology. Participants oscillate between hopes of geopolitical de-escalation and the mathematical reality of persistent inflation constraining central banks. This analysis aims to decode the underlying mechanics that will dictate Bitcoin’s next major directional expansion.
2. Multi-Timeframe Chart Analysis
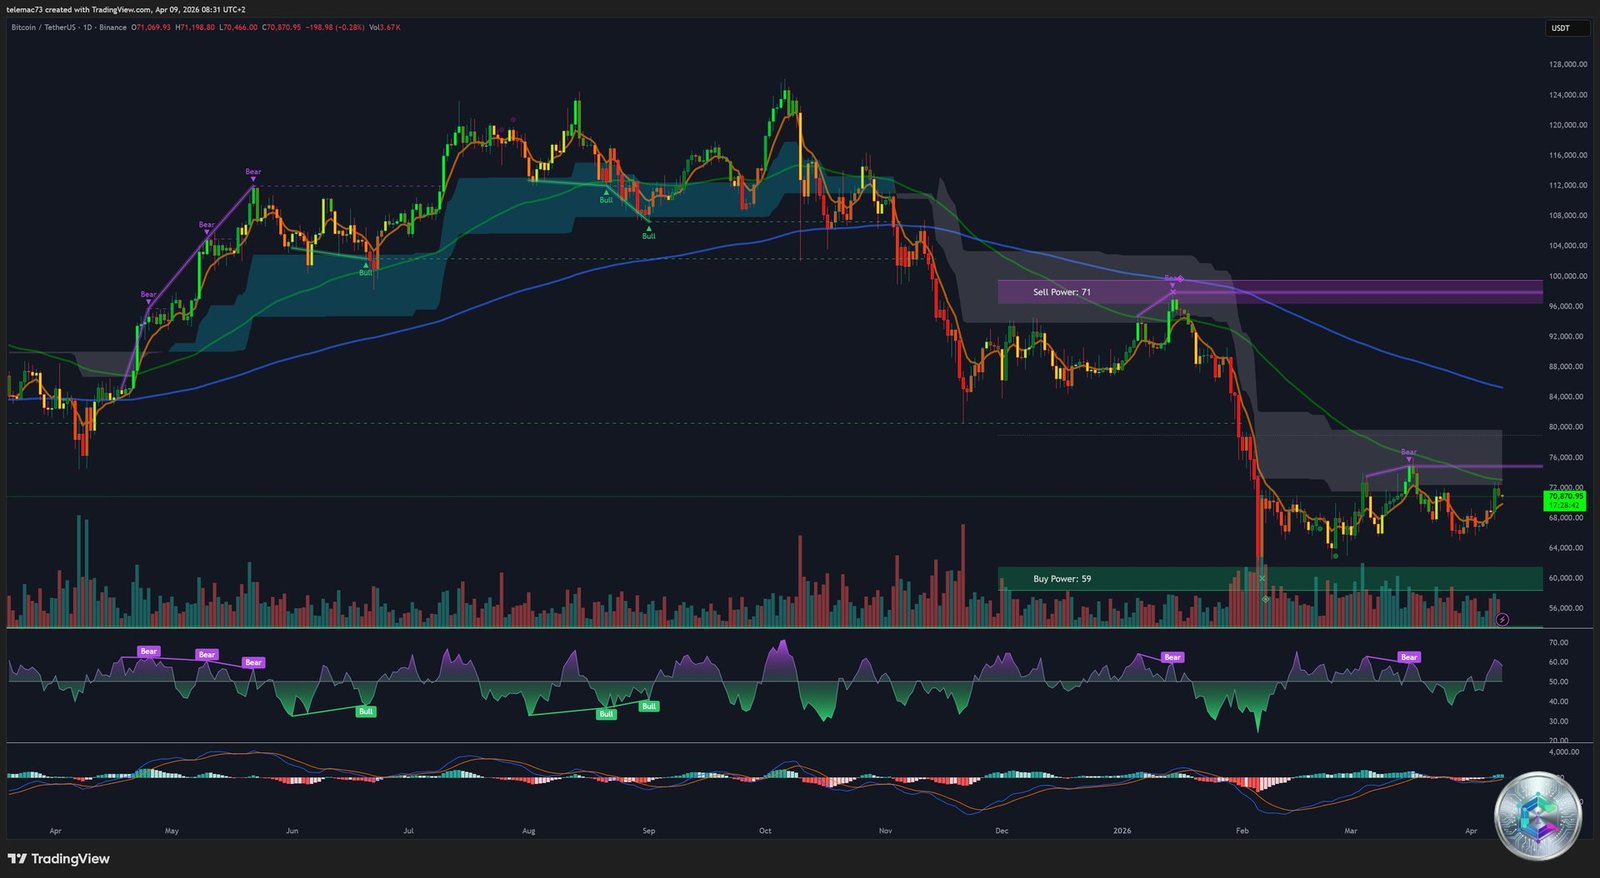
2.1. Daily Chart: Macro Structure and Institutional Power Zones
On the daily timeframe, Bitcoin displays a broad consolidation pattern following a massive distribution phase. The current price, hovering around $70,870, sits in a median channel, trapped between extremes that have defined the recent cycle.
The institutional power indicator highlights two key zones:
- Macro resistance — « Sell Power: 71 » zone between $94,000 and $100,000: a glass ceiling where supply massively absorbed demand during the previous euphoric phase.
- Structural support — « Buy Power: 59 » zone around $60,000: a springboard during recent corrections, confirming that smart money perceives this level as a value area.
The daily RSI displays multiple bearish divergences at local highs — buying momentum was systematically fading despite attempts to sustain prices. The MACD oscillates dangerously near the zero line with a tendency to print red bars, signaling sustained dominance of institutional selling pressure.
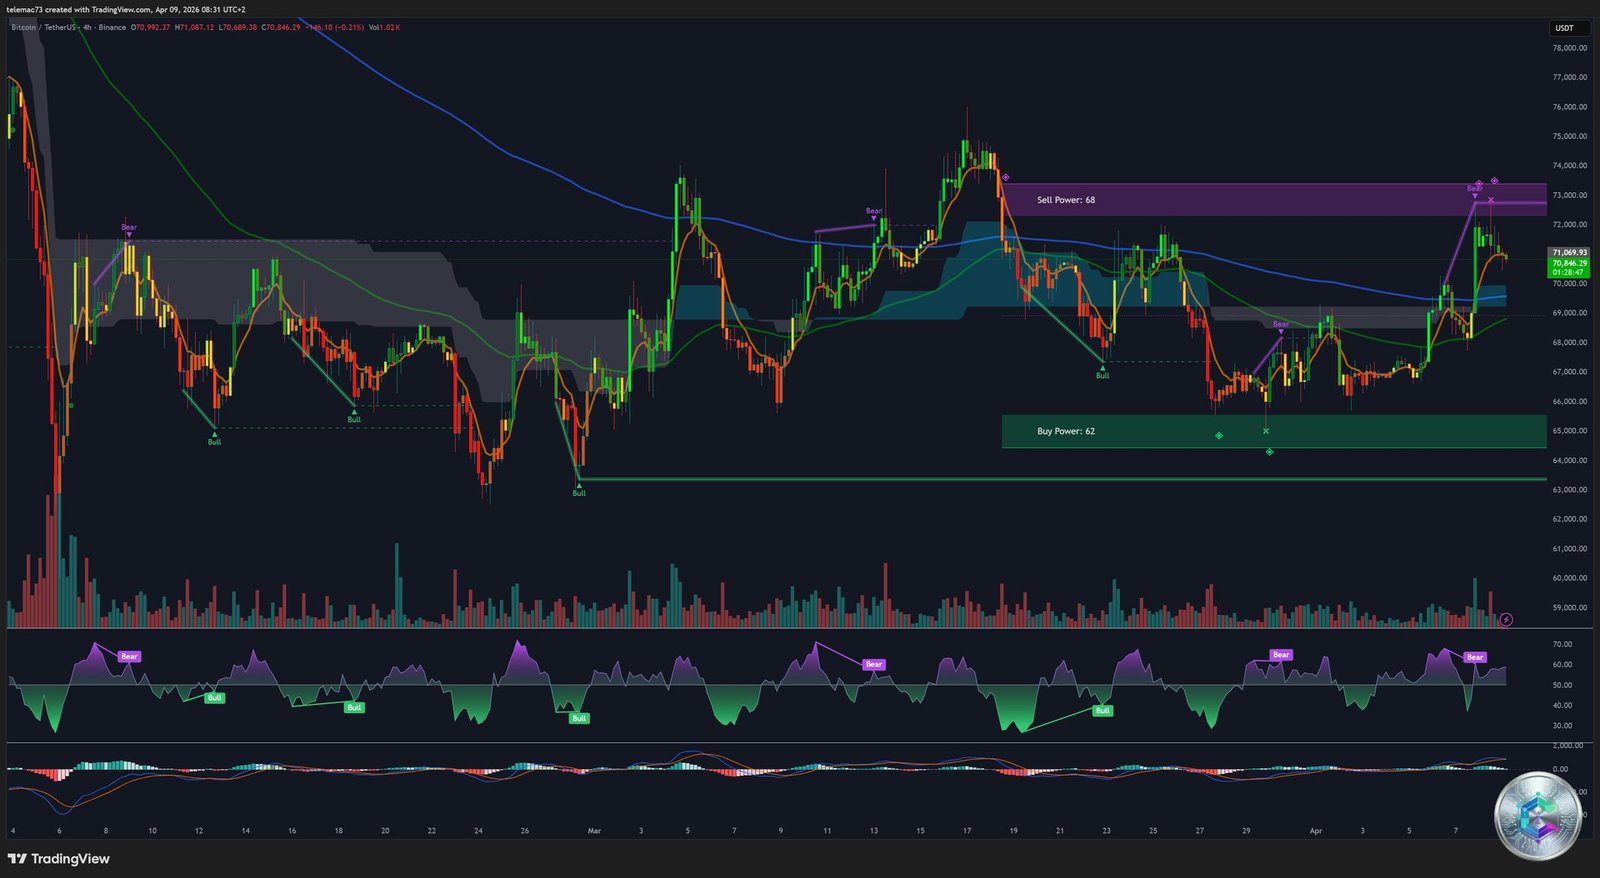
2.2. 4-Hour Chart (H4): Compression and Local Selling Pressure
Zooming into the H4 timeframe dissects the medium-term dynamics, the primary battleground for swing traders and risk management algorithms. Price is evolving within a highly constrained volatility corridor around $71,069.
Critical algorithmic zones identified:
- Local resistance — « Sell Power: 68 » block between $72,000 and $73,000: the zone where all recent bullish escape attempts have been systematically suffocated by limit sell orders.
- Immediate support — « Buy Power: 63 » block between $64,000 and $65,000: the proximity of these two blocks illustrates explosive compression (squeeze setup).
The H4 RSI navigates erratically between neutral (50) and oversold (30) — the classic signature of a ranging market. A local Golden Cross accompanied the bounce from $65,000, but the MACD histogram already shows exhaustion signs, threatening to flip to a Death Cross if the $72,000 resistance isn’t breached decisively with sustained volume.
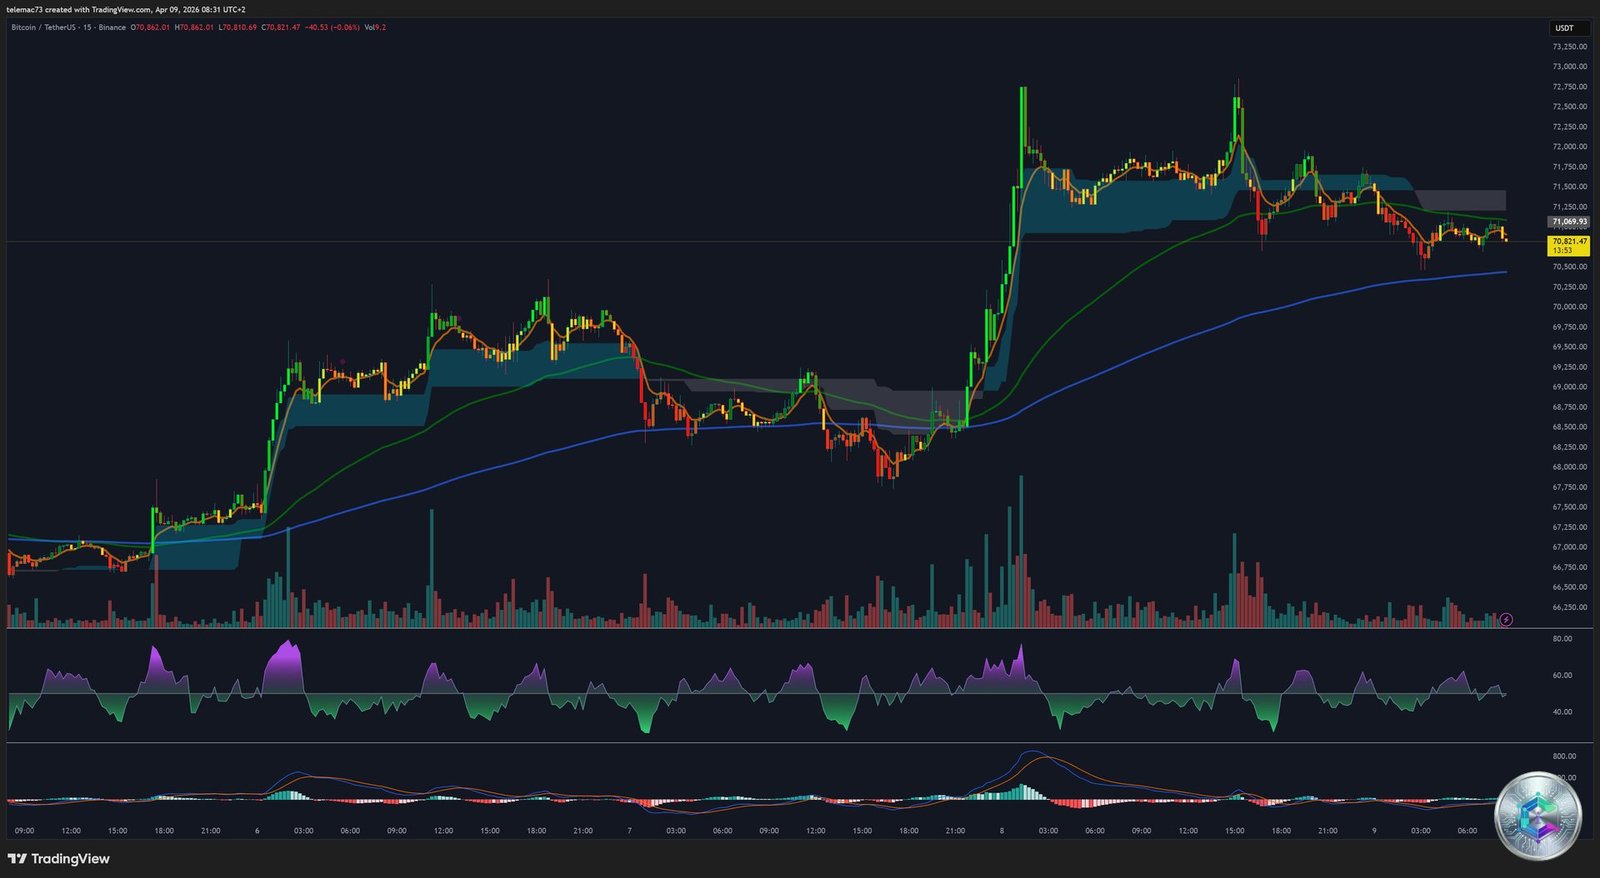
2.3. 15-Minute Chart (M15): Micro-Structure and Intraday Volatility
The M15 chart reveals a bull flag formation in progress. A violent expansion move propelled price from $68,000 to a high of $72,500. Following this impulse, price entered a classic consolidation phase: progressively lower highs, while lows are held by a dynamic ascending trendline.
However, this theoretically bullish continuation pattern is weakened by the macro context. The M15 RSI has cooled considerably after reaching overbought extremes. The MACD shows a slight bearish histogram tilt, indicating slow intraday distribution. Any bullish breakout of this micro-flag will immediately face the institutional sell wall at $72,000.
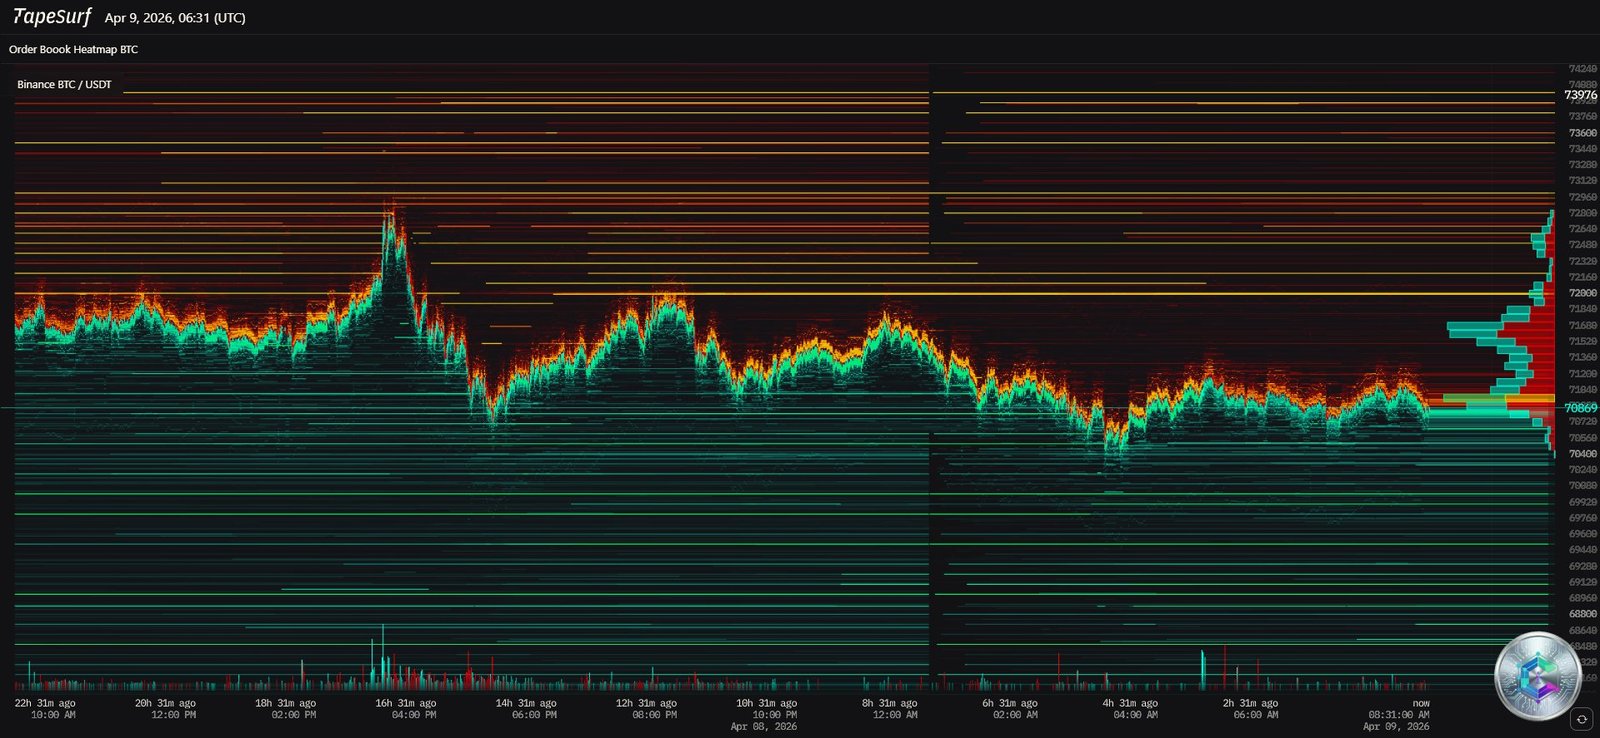
3. Liquidation Heatmap Analysis and Liquidity Modeling
The TapeSurf liquidation heatmap exposes a striking stratification of the order book. When a trader employs high leverage (50x or 100x), a tiny adverse price move is sufficient to exhaust the collateral margin — triggering cascading liquidations that create explosive, artificial moves.
3.1. Overhead Sell Walls
Above the current price ($70,669), extremely dense horizontal bands (yellow and bright red) indicate massive concentrations of sell-side liquidity, particularly thick at $72,000, $73,000, and peaking around $73,976. A massive short liquidation wall has formed between $71,800 and $72,000.
If an unexpected exogenous event pushes price above this threshold, the cascade liquidation of those shorts would force massive market buying (short squeeze), triggering a violent acceleration toward $76,000 and potentially $80,000.
3.2. The Asymmetry of Lower Liquidity Pools
The lower section of the heatmap reveals a structurally concerning asymmetry: the latent liquidity below current price (particularly in the $60,000 – $64,000 zone) is significantly heavier and denser than the liquidity overhead. This level acts as the market’s primary gravitational magnet — each failed bounce further erodes buyer conviction and slowly undermines support.
| Price Level (USD) | Concentration Type | Heatmap Density | Strategic Implication |
|---|---|---|---|
| $71,800 – $74,000 | High-Leverage Short Sell Walls | 🔴 Very High | Critical resistance. A breach triggers a violent short squeeze to $76–80k |
| $78,000 – $82,000 | Mid-Leverage Short Liquidations | 🟡 High | Secondary target in case of bullish breakout |
| $60,000 – $64,000 | Long Stop Liquidations | 🟢 Massive | Primary gravity magnet — liquidity sweep scenario highly probable |
| $100,000 – $104,500 | Historical Long Liquidations | ⚪ Moderate | Major end-of-cycle resistance — macro bull trap zone |
4. Macroeconomic Drivers: The CPI/Fed Vise
U.S. annual inflation held at 2.4% in February 2026 — in line with expectations, marking the lowest level since May 2025. However, the apparent headline stability masks concerning underlying dynamics.
| CPI Component | Monthly Change | Annual Change | BTC Impact |
|---|---|---|---|
| Headline CPI | +0.3% | +2.4% | Resilient monthly bounce |
| Core CPI | +0.2% | +2.5% | Rigidity → pushes rate cuts further out |
| Shelter | +0.2% | +3.0% | Persistent structural contribution |
| Food | +0.4% | +3.1% | Ongoing pressure on U.S. households |
Core CPI frozen at 2.5% demonstrates that the Fed’s disinflationary policy has hit an incompressible floor. Policymakers have reiterated that rates will be maintained on strict economic assessment, pushing rate cut expectations to the second half of 2026.
The Bitcoin impact is direct and asymmetric. Institutional valuation models inversely correlate BTC price with 10-year Treasury yields (currently ~4.75%) and USD strength (DXY). A CPI print above 2.5% would validate the « higher for longer » narrative, causing a bond yield and dollar surge, breaking the $65,500 support and opening the path to the $60,000 liquidity abyss. Conversely, a cooler-than-expected print would reignite rate cut bets, weaken the dollar, and provide the spark to trigger the short squeeze toward $72,000.
4.2. Geopolitical Shocks: The Strait of Hormuz Equation
Middle East geopolitical tensions represent a systemic risk of the highest order. BlackRock’s institutional analysis highlights that persistent tensions drive global energy prices higher (fuel oil +6.2%, natural gas +10.9%). A sustained supply shock from a Strait of Hormuz blockage would exogenously reignite global inflation, forcing the Fed to tighten credit conditions.
In this systemic shock scenario, Citigroup warns that a global recession induced by an oil crisis could sweep Bitcoin’s value down to $58,000, as investors flee en masse toward the dollar and Treasuries.
5. Regulatory Architecture and Institutional Consecration
5.1. The Legislative Revolution: CLARITY Act and GENIUS Act
2026 marks a pivotal year where Bitcoin transitions from speculative instrument to regulated financial infrastructure. Two cardinal bills are reshaping the ecosystem:
The GENIUS Act established a prohibition on stablecoin yield distributions, but left a significant legal gap regarding whether third-party intermediaries (like crypto exchanges) are also covered. The CLARITY Act (Digital Asset Market Clarity Act) aims to resolve the endemic SEC vs. CFTC jurisdiction conflict by granting the CFTC exclusive authority over spot markets for « digital commodities. »
The CLARITY Act’s fate hinges on a fierce lobbying war: the traditional banking lobby fears a massive deposit flight (estimated at $1.3 trillion) if clients can earn higher risk-free rates on crypto platforms via stablecoins. If passed, the CLARITY Act will establish a trust framework unlocking trillions of dollars in institutional capital currently blocked by compliance committees. Political figures are pushing for finalization before the summer recess, aware that the approaching November 2026 midterms would paralyze any legislative effort.
5.2. Wall Street’s Offensive: Morgan Stanley and TRM Labs
On April 8, 2026, Morgan Stanley Investment Management officially launched the « Morgan Stanley Bitcoin Trust » — an actively managed investment vehicle allowing institutional and high-net-worth clients to gain Bitcoin exposure without bearing the cryptographic custody burden. This institutional endorsement definitively validates the Bitcoin integration thesis within standard diversified portfolios (60/40).
The April 9 partnership announcement between TRM Labs (blockchain intelligence leader) and Stablecore (digital infrastructure provider) now enables more than 8,500 U.S. banks and credit unions to deploy digital asset products with bank-grade compliance standards. The distribution channels for mass adoption are built and operational — they are simply awaiting the removal of regulatory and macroeconomic headwinds.
6. Quantitative Projections and Institutional Sentiment
| Institution / Analyst | Previous Target | Revised Target (2026) | Rationale |
|---|---|---|---|
| Standard Chartered | $150,000 | $100,000 | Liquidity tightening and legislative delay |
| Citigroup | $143,000 | $112,000 | Economic risks — drop to $58k in recession scenario |
| Willy Woo (On-Chain) | N/A | $46,000 – $54,000 | On-chain capital flight, weak spot demand |
| Academic Research | N/A | $1,000,000 (2027 horizon) | Post-halving supply scarcity model vs. inelastic institutional demand |
On decentralized prediction markets (Polymarket), the probability of Bitcoin breaching $100,000 in 2026 has collapsed to just 35% — nearly identical (38%) to the probability of a drop to $40,000. The probability of prolonged sideways action between $55,000 and $80,000 dominates market expectations (76% probability of a return toward $55,000).
7. Conclusion: Potential Energy and Operational Doctrine
April 2026’s Bitcoin market is characterized as a financial system under extreme tension, subject to a formidable asynchronous compression. The asset oscillates between the promise of unprecedented institutional consecration and the harshness of a punitive monetary cycle.
Technical signals are heavily cautious: five consecutive monthly red candles closing Q1 2026, price anchored below the daily EMA 50, and the formation of distributive structures (H4 Head & Shoulders). The liquidation flow analysis highlights an imminent asymmetric danger: Bitcoin’s repeated inability to fracture the $72,000 sell wall inexorably weakens support, drawing price toward the $60,000 – $64,000 accumulation zone.
Yet this cyclical bearishness contrasts violently with titanic progress on the fundamental front. The imminent outcome of CLARITY Act negotiations will serve as the true final catalyst: if this legislative barrier is cleared, the risk assessment frameworks of the world’s largest banks will be drastically modified, unleashing capital flows at an unprecedented scale.
The operational doctrine for Q2 2026 demands extremely rigorous risk management. Directional capital allocation should be deferred, awaiting a structural purge and a convincing test of the $60,000 zone. Any surge toward $71,800 without tangible macroeconomic support should be treated as a mere short squeeze — an opportunity for strategic distribution, not a new bull trend.
Bitcoin is accumulating a phenomenal amount of potential energy in this narrow valuation corridor. The spark that breaks this compression — whether legislative, geopolitical, or monetary — will initiate a new directional paradigm that must be awaited with patience and discipline.
⚠️ Disclaimer
This article is published for purely educational and informational purposes. It does not constitute investment advice or a recommendation to buy or sell any digital assets. Cryptocurrency markets are extremely volatile and carry a high risk of capital loss. Please consult a qualified financial advisor before making any investment decisions.