
As February 2026 draws to a close, Bitcoin (BTC) is navigating a period of remarkable systemic turbulence. The benchmark digital asset plunged below the critical psychological and technical threshold of $65,000, reaching an intraday low of $64,384 and posting a severe daily decline of approximately 4.8%. This report dissects the full anatomy of this correction: macroeconomic catalysts, institutional behavior, ETF flows, and a precise technical map of the key price levels ahead.
🌍 Macroeconomic Context: The Weight of Trade Shocks
The current selling pressure originates well beyond the blockchain ecosystem. International trade policy and US monetary policy are the primary drivers of this correction. The correlation between Bitcoin and traditional macroeconomic conditions has tightened considerably as institutional participation has grown — BTC is no longer a standalone asset; it has become a hypersensitive barometer of global liquidity and risk appetite.
The US Supreme Court invalidated a major portion of the Trump administration’s tariff program, triggering a brief market relief rally (S&P 500 +0.7% to 6,909.51). However, the administration’s swift response — imposing a new global tariff of 15% on all imports for 150 days — reignited fears of a prolonged trade war and rekindled inflationary pressures.
Compounding the issue, US economic data paints a picture of creeping stagflation: Q4 GDP grew by only 1.4% annualized, while the PCE inflation index — the Fed’s preferred gauge — remains stubbornly elevated at 2.9%. This combination forces the Federal Reserve to maintain restrictive interest rates far longer than markets had anticipated, pushing rate-cut expectations deep into 2026 and keeping the dollar at levels toxic to risk assets.
🐳 Whale Selling Pressure & On-Chain Activity
One of the most revealing on-chain metrics is the sudden spike in the Exchange Whale Ratio. CryptoQuant data clearly shows that wallets holding massive BTC volumes have transferred exceptional quantities to centralized exchanges — historically a strong leading indicator of imminent liquidation intent.
Among the notable events, Bitcoin mining giant Bitdeer was forced to liquidate its entire BTC reserves, adding substantial spot selling pressure. On the opposite end of the spectrum, MicroStrategy continues its aggressive accumulation strategy, teasing a new major purchase on social media — illustrating the profound dichotomy between operationally stressed sellers and secular holders using Bitcoin as a long-term treasury reserve asset.
📊 Transatlantic ETF Flow Divergence
The analysis of ETF flows for the week ending February 22 reveals a striking geographic and behavioral asymmetry:
| Region | Asset | Weekly Flows | Market Impact |
|---|---|---|---|
| 🇺🇸 United States | Bitcoin Spot ETF | -$316M USD | Forced liquidation of underlying asset |
| 🇺🇸 United States | Ethereum Spot ETF | -$123M USD | Bearish contagion across the sector |
| 🇺🇸 United States | Daily Net Flow (Feb 19) | -2,455.88 BTC | Acceleration of correction below $65K |
| 🇪🇺 Europe | Crypto ETP (Feb) | +€200M EUR | Strategic accumulation on dips |
| 🇪🇺 Europe | Crypto ETP (YTD) | +€340M EUR | Long-term institutional conviction |
While US investors capitulate amid macro fears, European institutional investors are methodically buying the dip, treating the geopolitically-driven price correction as a strategic accumulation opportunity rather than a sell signal.
📈 Multi-Timeframe Technical Analysis
Daily Chart (1D): Structural Break Confirmed
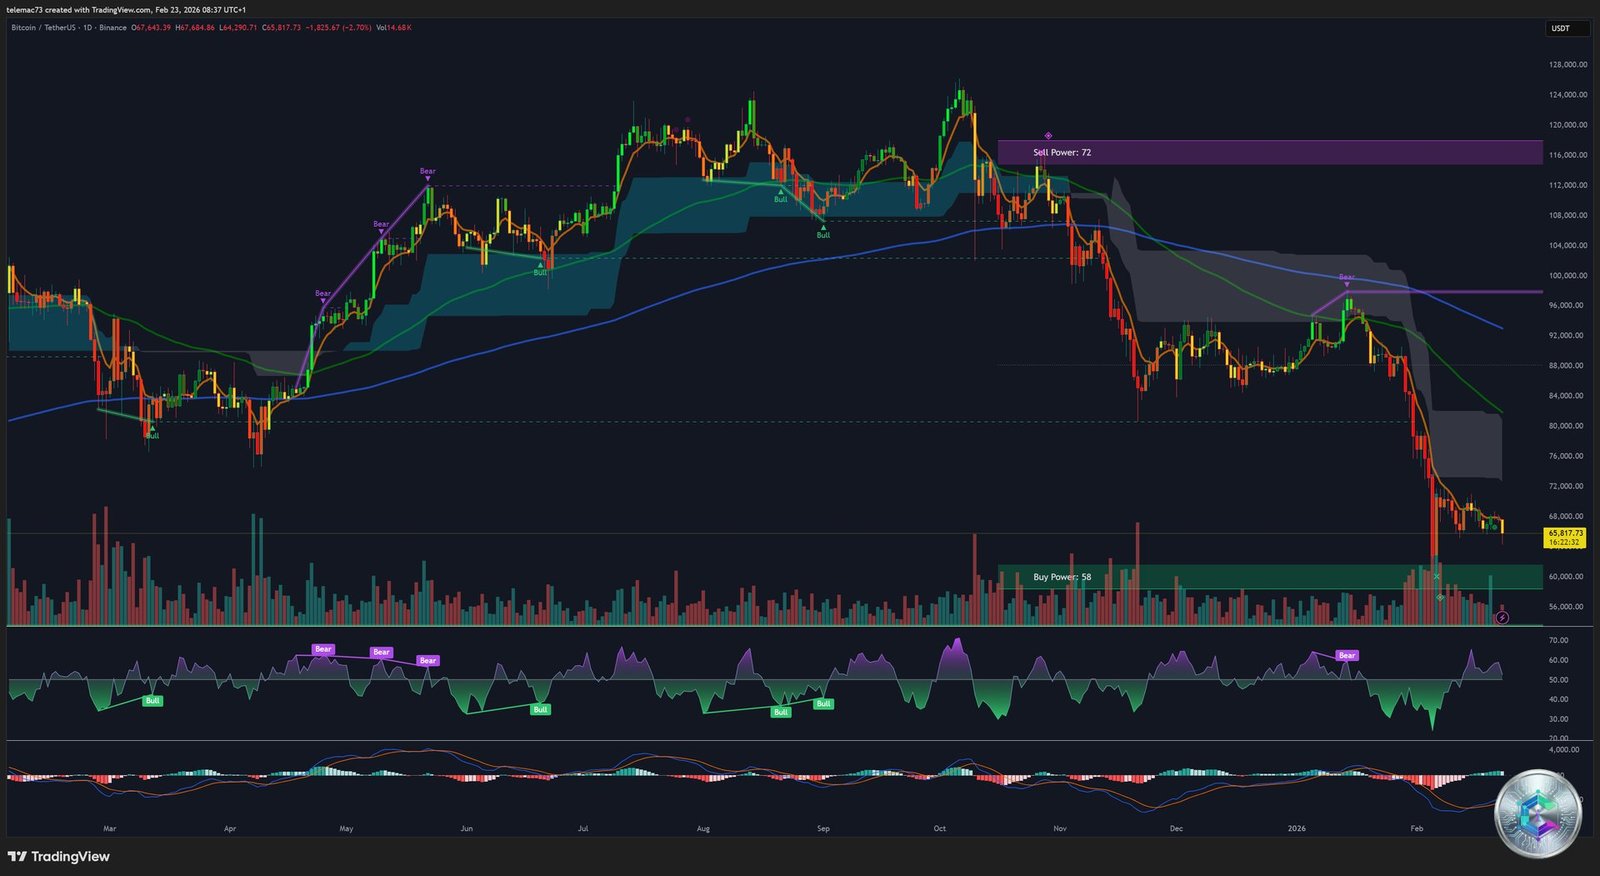
The decisive daily close below $65,000 confirms a clear Market Structure Break in favor of sellers. The « Sell Power » indicator shows an overwhelming score of 72 versus an anemic « Buy Power » of 38. The MACD histogram is expanding deeply into negative territory, validating the sustained bearish momentum. Historical volume profiles reveal a significant liquidity void, pointing to the $62,000–$60,000 zone as the path of least resistance.
4-Hour Chart: Descending Channel & Key Levels
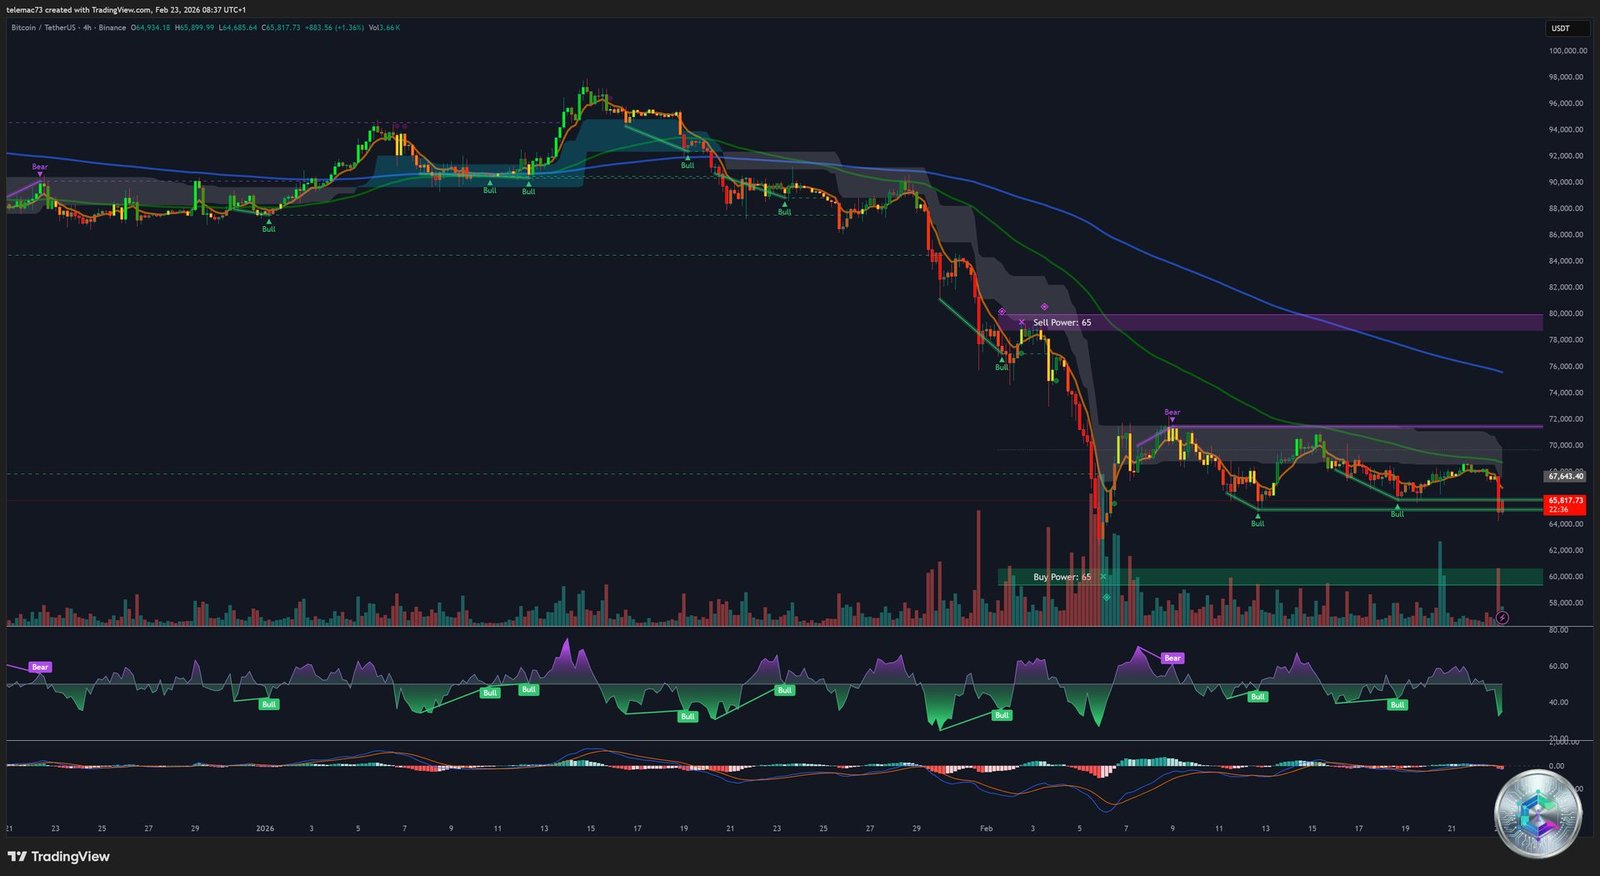
The 4-hour timeframe reveals a strict descending channel structure driven by consecutive Lower Highs and Lower Lows. Short-term EMAs are acting as dynamic resistance, aggressively rejecting every relief rally. The key levels on this intermediate timeframe are:
- $67,000 — First major ceiling: a critical polarity inversion zone with a dense concentration of limit sell orders visible on the heatmap.
- $68,500 — Intermediate resistance and pivot: reclaiming this level would signal seller exhaustion and potential short squeeze.
- $70,000 — Macro demarcation line: only a sustained close above this level would definitively invalidate the current bearish scenario.
15-Minute Chart: Institutional Liquidity Hunt
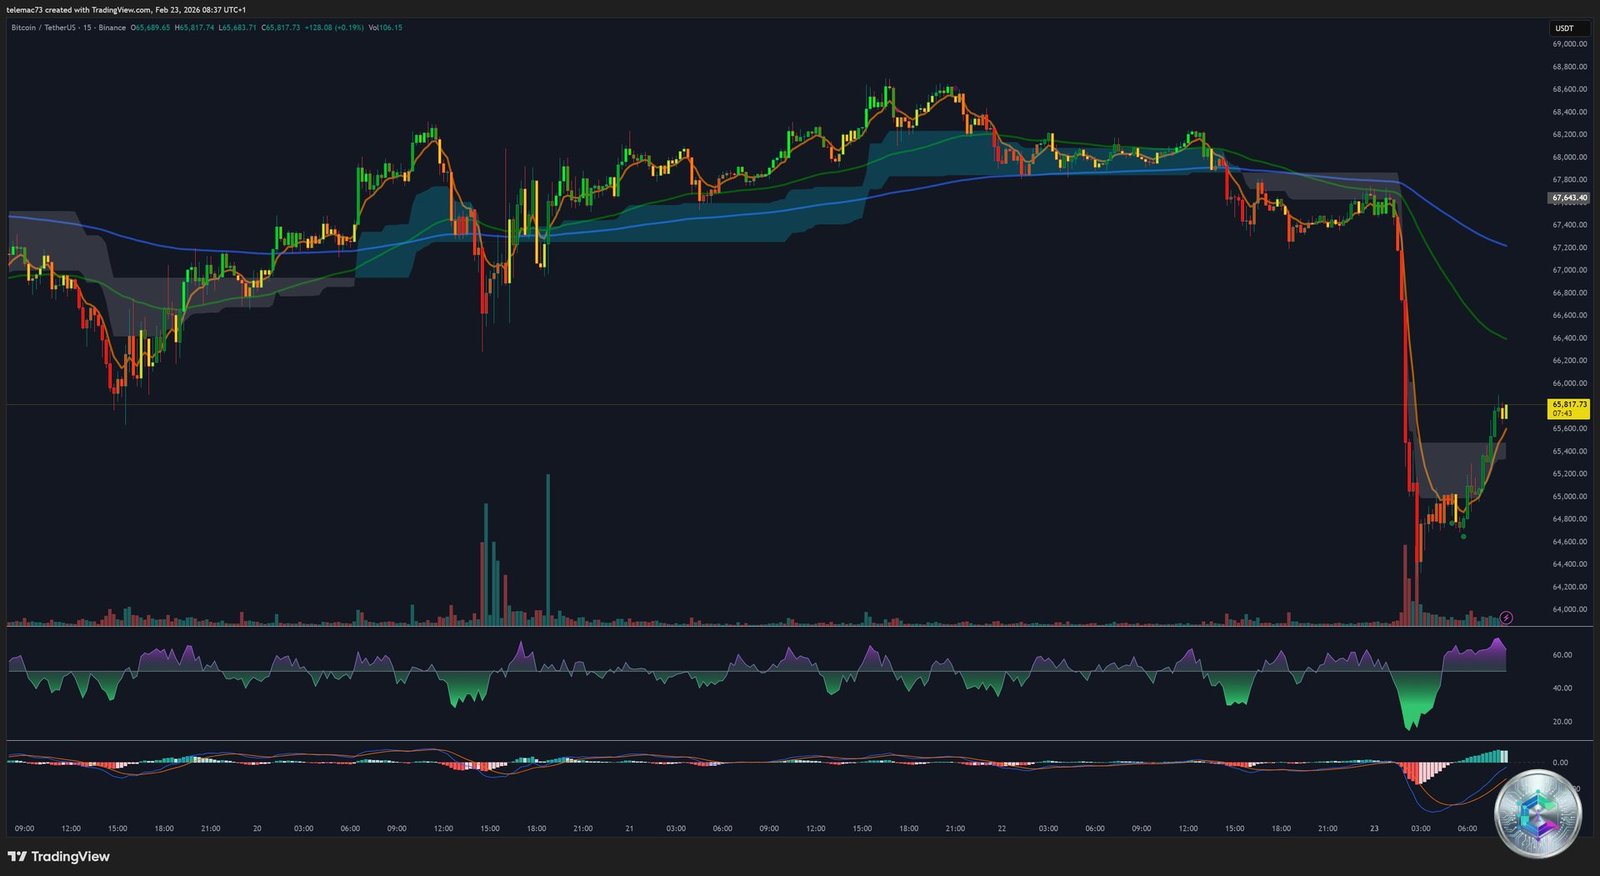
The 15-minute chart captures the anatomy of a classic institutional stop hunt. As price approached the $65,000 support, retail traders had predictably placed stop-losses just below this level. Institutional players deliberately pushed the price down to $64,384, triggering those stops (which mechanically become market sell orders), generating a sudden burst of liquidity they used to fill their own long positions at discounted prices — the long lower wick visible on the chart is their signature.
Order Book Heatmap: The Invisible Market Architecture
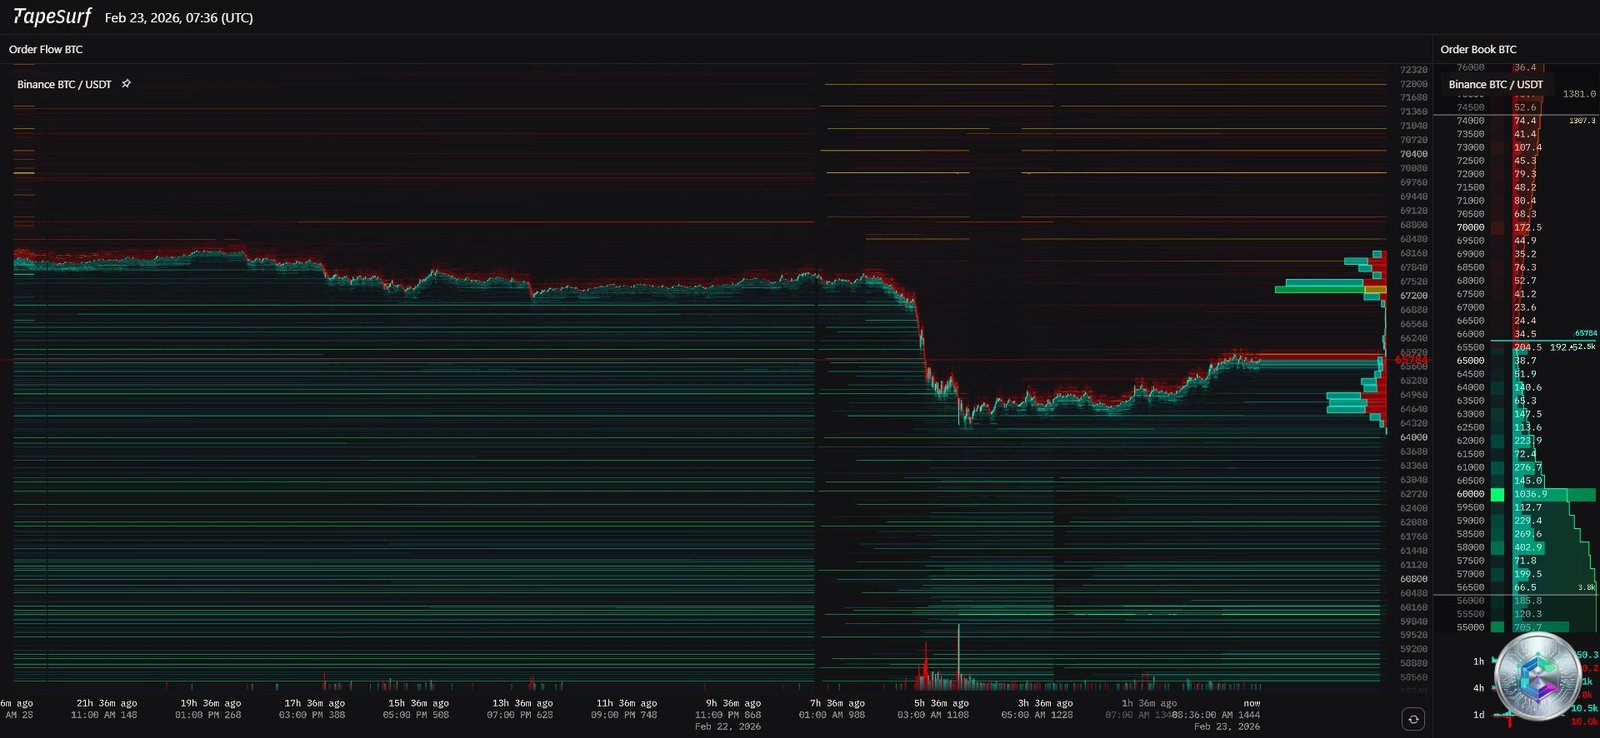
Unlike candlestick charts which show the past, the heatmap reveals future intentions through order book depth. The most critical observation: the densest concentration of buy orders (a massive green wall) sits precisely at $60,000, acting as a powerful gravitational magnet for price. On the upside, sell-side liquidity thickens aggressively between $66,200 and $67,000, positioning market makers to unload inventory on every intraday bounce.
🎯 Key Price Level Summary
| Price Level (USD) | Type | Significance |
|---|---|---|
| $70,000 | 🔴 Macro Resistance | Absolute invalidation of bearish scenario. Requires massive ETF inflows to break. |
| $68,500 | 🔴 Intermediate Resistance | Algorithmic reversal pivot. High risk of early profit-taking. |
| $67,000 | 🔴 Immediate Resistance | Structural glass ceiling. Major polarity inversion zone. |
| $65,000 | ⚠️ Central Pivot | Former support turned resistance. Fierce intraday narrative battleground. |
| $64,000 | 🟡 Fragile Support | Last algorithmic defense. Confirmed break triggers accelerated sell-off. |
| $62,000 | 🟢 Intermediate Support | Technical pit stop with moderate institutional absorption capacity. |
| $60,000 | 🟢 Macro Support / Magnet | Cycle floor. Maximum buy order density. Failure here opens the door to secular capitulation. |
🔮 Fundamental Outlook for 2026
Despite the bleak short-term technical picture, the blockchain infrastructure and institutional regulatory framework have reached unprecedented levels of maturity. The imminent introduction of the Clarity Act and the GENIUS Act in the US, the tokenization of real-world assets (RWA) — exemplified by Kraken’s $25 billion in tokenized securities volume — and the parabolic growth of stablecoins ($24 trillion in transaction volume in 2024) form the long-term fundamental backbone that justifies sustained institutional capital engagement.
These long-term fundamentals are, however, currently overwhelmed by the urgency of exogenous macroeconomic shocks. The Bitcoin market is desperately seeking a positive catalyst to reverse the prevailing trend.
✅ Strategic Conclusion
Bitcoin is navigating a phase of acute systemic vulnerability, largely dictated by global liquidity conditions and US trade policy. Technically trapped below the algorithmic ceiling of $67,000 and facing the gravitational pull of the $60,000 magnet, the asset must urgently demonstrate its ability to absorb excess supply at the $64,000 level.
Until a volume-validated reclaim of $70,000 is confirmed, the strictest defensive posture is warranted. In this high-tension financial environment, disciplined capital preservation against geopolitically-driven stochastic volatility remains the only rational investment paradigm.
⚠️ Disclaimer: This article is written for educational and informational purposes only. It does not constitute investment advice or a recommendation to buy or sell any cryptocurrency. Digital asset markets are highly volatile and carry significant risk of capital loss. Always conduct your own research (DYOR) and consult a licensed financial advisor before making any investment decisions.