


Bitcoin is navigating one of the toughest stretches of its current cycle in early July 2026. After peaking near $126,000 in October 2025, the asset has shed almost half its value, testing a capitulation low of $58,115 in late June. Between persistent monetary tightening, a record ETF outflow streak, and Strategy’s (formerly MicroStrategy) symbolic break from its perpetual « HODL » doctrine, several forces are converging to keep the market under extreme stress. Here’s a full breakdown, from the macro backdrop to a multi-timeframe technical read.
A macro environment hostile to risk assets
June 2026 will be remembered as one of Bitcoin’s worst months in recent history, with a monthly decline near 20.5%, the sharpest drop since June 2022. This isn’t happening in a vacuum: it reflects a persistent tightening of global liquidity conditions. The Federal Reserve continues to hold rates in an elevated 3.50%–3.75% range, with a firmly hawkish tone as inflation remains stuck between 3.8% and 4.2%, well above the 2% target.
In this high cost-of-capital environment, non-yielding assets such as Bitcoin, gold, and silver face an unfavorable arbitrage: gold fell over 14% and silver more than 24% over the second quarter, a sign of broad-based liquidation across inflation hedges. Another notable shift: Bitcoin’s historical correlation with the Nasdaq 100 has distorted — the digital asset falls during tech sell-offs but fails to participate in rallies, as retail speculation increasingly concentrates around AI-related valuations.
Adding to the pressure, ongoing geopolitical tensions around Iran continue to fuel broad risk-off sentiment. As a result, the crypto Fear and Greed Index has dropped to extreme levels, hovering between 12 and 17, reflecting deep fear among market participants.
Record outflows from spot Bitcoin ETFs
One of the key catalysts behind this correction is the sharp reversal in institutional flows. US-listed spot Bitcoin ETFs, which powered the rally into late 2025, recorded net outflows of $4.5 billion in June 2026 alone — an all-time record that shatters the previous peak of $3.56 billion set in February 2025. Over a rolling six-week window, cumulative outflows reached nearly $5.94 billion, the longest streak of consecutive redemptions ever recorded.
BlackRock’s iShares Bitcoin Trust (IBIT) alone accounts for roughly 79% of total redemptions, with $3.55 billion in outflows. This mechanism isn’t neutral for the spot market: every ETF share redemption forces market makers to liquidate physical Bitcoin to honor withdrawals, fueling continuous sell pressure on centralized exchanges.
| Asset | Net flow (June 2026) | Note |
|---|---|---|
| Bitcoin (total US spot ETF) | −$4.50B | Worst month on record |
| IBIT (BlackRock) | −$3.55B | 79% of total outflows |
| Ethereum (total spot ETF) | −$529M | Sympathy sell pressure |
| Solana (total spot ETF) | −$0.79M | First negative monthly close |
| XRP (total spot ETF) | +$59.5M | Relative resilience |
Strategy breaks the perpetual « HODL » taboo
The quarter’s most striking psychological shock comes from Strategy (formerly MicroStrategy), the largest corporate Bitcoin holder with 847,363 BTC at an average acquisition cost of $75,651. Under the new FASB accounting standard (ASU 2023-08), which mandates mark-to-market valuation, the company now carries an unrealized loss of $14.46 billion, following a reported quarterly loss of $12.54 billion.
Facing an 80% collapse in its share price over the past year, Strategy made a historic pivot: launching a « Digital Credit Capital Framework » that, for the first time, authorizes active Bitcoin sales to fund operations — a 12% dividend hike on its STRC preferred shares, a growing USD cash reserve, and a $2 billion share buyback program. A symbolic sale of 32 BTC in early June was enough to trigger a confidence shock: within 48 hours, Bitcoin’s price fell from $73,000 to $63,000, wiping out nearly $60 billion in market capitalization across the entire asset.
MiCA and security risks compound the pressure
The full entry into force of the EU’s MiCA (Markets in Crypto-Assets) regulation on July 1, 2026 has created a compliance shock: only 216 of 3,167 virtual asset service providers operating in Europe held the required license by the deadline. Several major platforms were forced to suspend or restrict operations in certain jurisdictions, fragmenting European liquidity and amplifying volatility. Meanwhile, losses from crypto platform hacks reached $75.87 million in June, adding to the erosion of trust in sector infrastructure.
Multi-timeframe technical analysis
Macro view: daily chart trapped below the 200-day MA
On the daily timeframe, market structure remains locked in a classic corrective downtrend channel, printing a textbook sequence of lower highs and lower lows. Price now trades below the 200-day moving average, sitting at $62,445, which acts as primary resistance. The 50-day exponential moving average, around $66,343 and sloping downward, adds further pressure: a bearish crossover between the two averages — a « Death Cross » — would become a major technical signal if current levels persist.
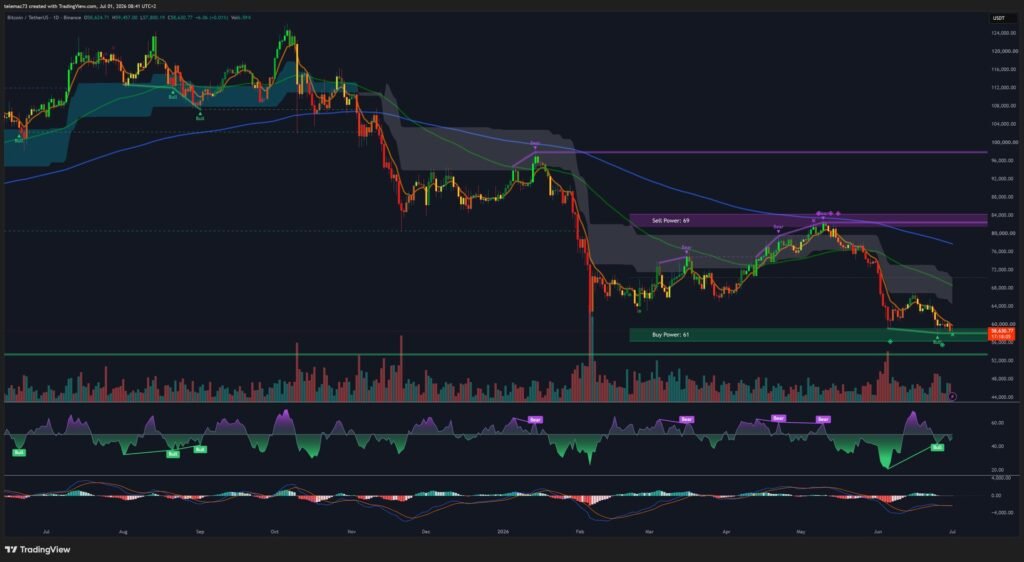
Two bearish continuation patterns stand out: a head-and-shoulders formation with a neckline at $56,757, and a bear flag targeting $55,000. The daily RSI oscillates between 31 and 34, close to oversold territory without a confirmed bullish divergence, while the MACD remains deeply negative with no sign of an imminent reversal.
| Technical level | Price (USD) | Significance |
|---|---|---|
| Macro resistance (Magnet Zone) | $67,645 | Massive short liquidation magnet |
| 50-day EMA | $66,343 | Bearish dynamic resistance |
| 200-day SMA | $62,445 | Pivot resistance, key to market regime |
| Psychological resistance | $60,000 | Former support turned resistance |
| Local support | $58,115 | Capitulation low (June 25) |
| Neckline (H&S) | $56,757 | Critical cycle pivot |
| Bear flag target | $55,000 | Measured breakdown target |
| Major historical support | $53,485 | July 2024 structural support |
Intermediate scale: pressured consolidation on the 4-hour chart
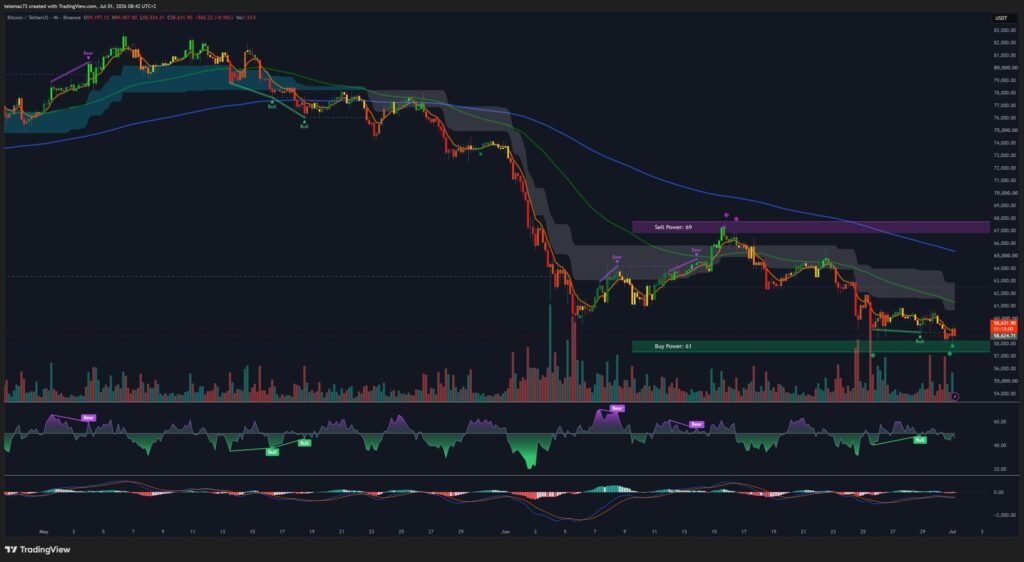
On the 4-hour chart, price is trapped in a rigid bearish consolidation channel: every bounce gets sold, with declining volume on rallies and heavy distribution spikes on rejections — a classic « sell-the-rip » behavior reflecting demand for exit liquidity. A descending triangle is forming between horizontal support at $58,115 and a declining trendline, statistically raising the odds of a downside break. The 4H MACD keeps printing bearish crossovers, and RSI struggles to clear the 50 midline, confirming seller control on this timeframe.
Microstructure: traps and liquidity hunts on the 15-minute chart
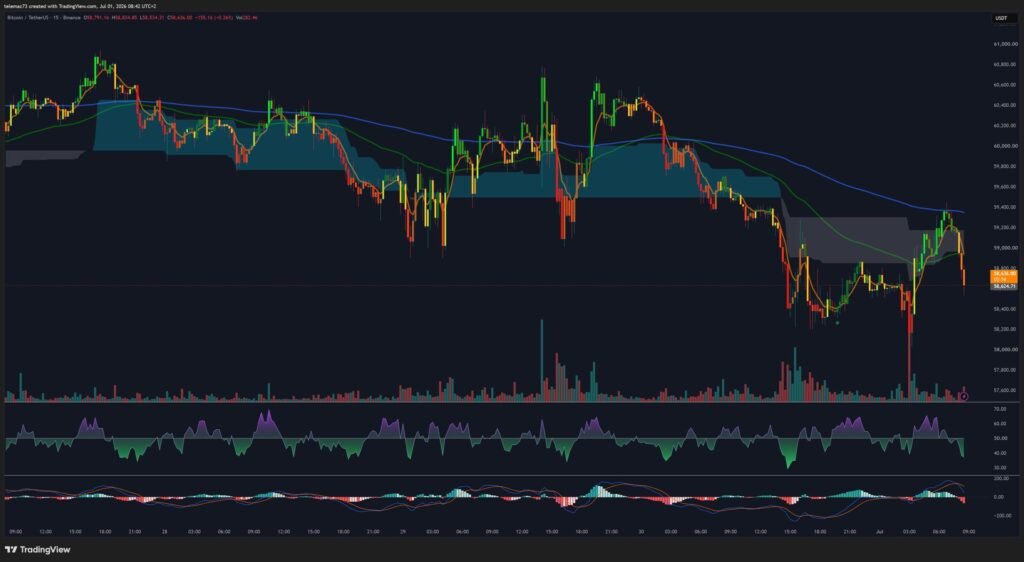
On the shortest timeframe, volatility spikes noticeably. Short moving-average crossovers generate frequent false signals (bull traps) that get invalidated quickly. Still, there are early signs of liquidity sweeps: lower wicks below $59,000 accompanied by mild bullish RSI divergence, suggesting opportunistic buyers are absorbing liquidity generated by panic stop-loss selling. These remain purely tactical, short-lived windows, however, and don’t challenge the underlying bearish trend.
Liquidation heatmap: the real battleground
Reading the BTC/USDT order book heatmap adds a layer the charts alone can’t show: hidden liquidity zones. A thick wall of sell orders sits between $61,500 and $63,000, saturated with leveraged short positions — a genuine glass ceiling for any technical bounce. Higher up, a massive « magnet zone » around $67,645 concentrates roughly $247 million in direct short liquidations, part of a broader $2.26 billion cluster of short positions across exchanges.
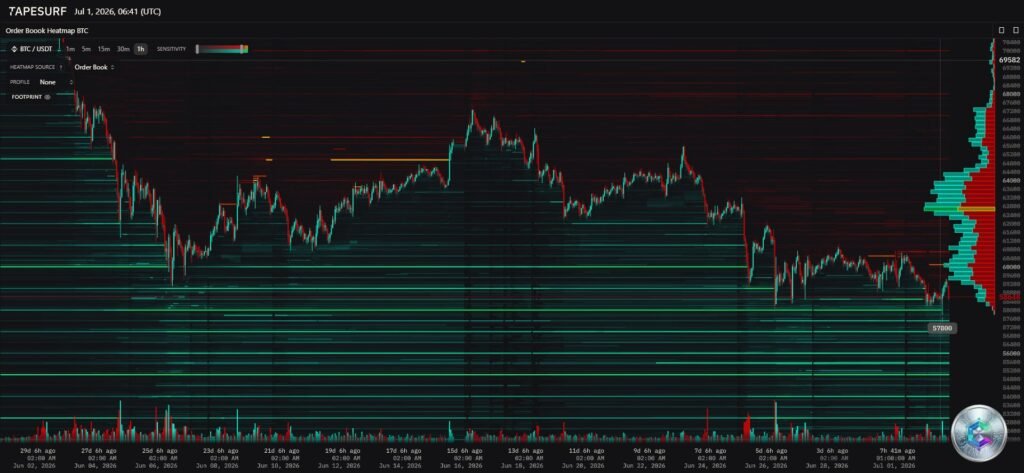
Conversely, downside risk remains asymmetric: derivatives markets stay overweight in long positions, with a fragile support wall between $56,000 and $57,000. A break below this level could trigger a cascading long squeeze toward the $53,000 zone, in line with the neckline identified on the daily chart.
Two scenarios for July 2026
Bearish scenario — structural capitulation: failure to reclaim the $61,500–$63,000 zone would turn the current bounce into a mere dead cat bounce. A break of the $58,115 support would open the door to the $56,757 neckline, then $55,000 and $53,485 in a cascading liquidation event.
Bullish scenario — oversold short squeeze: historically, July delivers an average positive return of 7.6% for Bitcoin, rising to +10.3% during mid-term election years like 2026. A successful defense of the $60,000 level, followed by a reclaim of the 200-day MA ($62,445), could trigger a cascading short covering rally toward the $67,645 magnet zone, with possible extensions between $70,000 and $75,000.
| Model | Historical return | End-of-July target |
|---|---|---|
| Average seasonality | +7.6% | $64,500 |
| Mid-term election year | +10.3% | $66,100 |
| Historical bear market rally | +16.8% to +21% | $70,000 – $72,500 |
What to watch
Two variables will decide the outcome of this standoff: the daily evolution of US spot ETF flows, a genuine barometer of institutional sentiment, and whether the $58,115 technical support holds. On a structural level, the downward mining difficulty adjustment in late June and the distance to the next halving (April 2028) point to a typical mid-cycle digestion phase rather than a definitive break in the long-term narrative. The rotation observed toward assets like XRP or Tron, which are holding their support levels despite the broader purge, suggests capital isn’t fully leaving the crypto ecosystem — it’s redeploying selectively.
Disclaimer: this article is provided for educational and informational purposes only. It does not constitute investment advice, a recommendation to buy or sell, or an inducement to trade digital assets. Cryptocurrency markets are highly volatile and carry a risk of capital loss. Always do your own research (DYOR) and consult a licensed financial advisor before making any investment decision.

