
The digital asset ecosystem is navigating a historic convergence on this Thursday, May 14, 2026. Bitcoin (BTC) finds itself caught between institutional selling pressure driven by traditional macroeconomics and robust underlying accumulation fueled by ETF inflows and prospects for imminent regulatory clarity. The market is a spring compressed to its absolute limit — and its resolution promises to be explosive.
Macroeconomic Environment: Asymmetric Headwinds
Persistent Inflation and Restrictive Monetary Policy
The macroeconomic landscape is imposing significant headwinds on risk assets. Recently released US inflation data came in well above expectations: April PPI surged +6% year-over-year versus 4.9% forecast, CPI held at 3.8%, and Core PPI climbed to 5.2% — its highest reading in over three years.
These figures cement the Federal Reserve’s « higher for longer » rate narrative, pushing back rate cut expectations and fueling a sustained rise in bond yields. The US 10-year Treasury note hovers around 4.5%, mechanically draining liquidity that would otherwise flow into Bitcoin. Tonight at 7:00 PM ET, Fed Governor Michael Barr addresses the Money Marketeers FOMC Event on the topic of the Fed’s balance sheet — any hawkish signal will amplify intraday volatility.
Geopolitical tensions add another layer of complexity: the rejection of a peace proposal related to Iran drove WTI crude oil above $97/barrel, further complicating the disinflation path and severely limiting the Fed’s maneuvering room.
The Historic CLARITY Act Vote — A Binary Catalyst
The single most decisive near-term catalyst is the Senate Banking Committee’s markup of the Digital Asset Market CLARITY Act, scheduled for Thursday, May 14 at 10:30 AM ET. This 309-page bill aims to establish the first comprehensive federal framework for digital assets, drawing clear jurisdictional boundaries between the SEC and CFTC and codifying Bitcoin’s commodity status into federal law.
The stakes are enormous. Prediction market Polymarket pegs passage odds at 62% — down from 80% earlier in the month — reflecting aggressive last-minute opposition from the banking lobby (the ABA sent over 8,000 letters to Senate offices). Citi analysts have directly tied a $143,000 Bitcoin price target for 2026 to passage of this legislation, projecting $15 billion in additional net ETF inflows. Conversely, a failed vote could trap BTC in its $74,000–$80,000 consolidation range through 2030.
Daily Chart Analysis (1D): The Death Cross Battle
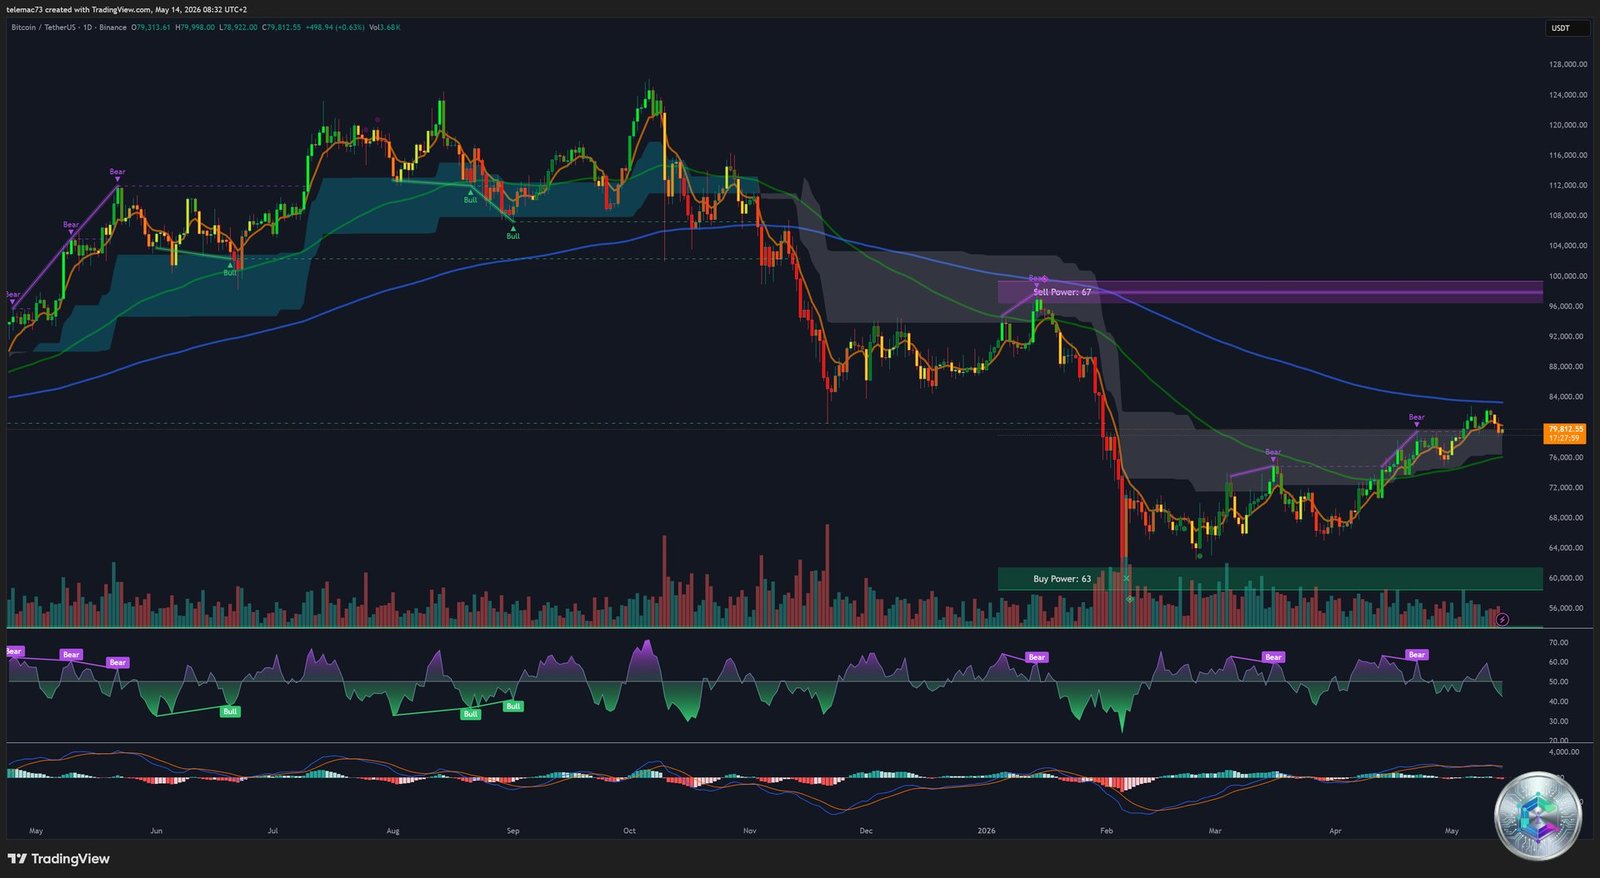
The daily chart reveals price hovering around $79,812, navigating a major technical congestion zone. The standout feature is the recent recapture of the 200-day EMA — the secular dividing line between bull and bear markets. In late 2025, a « Death Cross » formed as the 50-day MA crossed below the 200-day MA. Buyers are now fighting to invalidate that bearish paradigm.
However, the 50-day SMA (~$80,406) and 200-day SMA (~$80,733) form a formidable dynamic resistance ceiling. Until Bitcoin posts clean daily closes above these levels, the risk of a technical re-rejection remains very real. Momentum oscillators confirm this exhaustion: the 14-day RSI oscillates between 37–42, below the neutral 50-line, while the MACD remains anchored in negative territory with a histogram contracting toward zero — a textbook signal of indecision awaiting an external catalyst.
| Moving Average | SMA | EMA | Signal |
|---|---|---|---|
| MA 50 | $80,406 | $80,246 | 🔴 Strong Sell |
| MA 100 | $80,787 | $80,540 | 🔴 Strong Sell |
| MA 200 | $80,733 | $80,269 | 🔴 Strong Sell |
4-Hour Chart Analysis (4H): Bull Flag Under Pressure
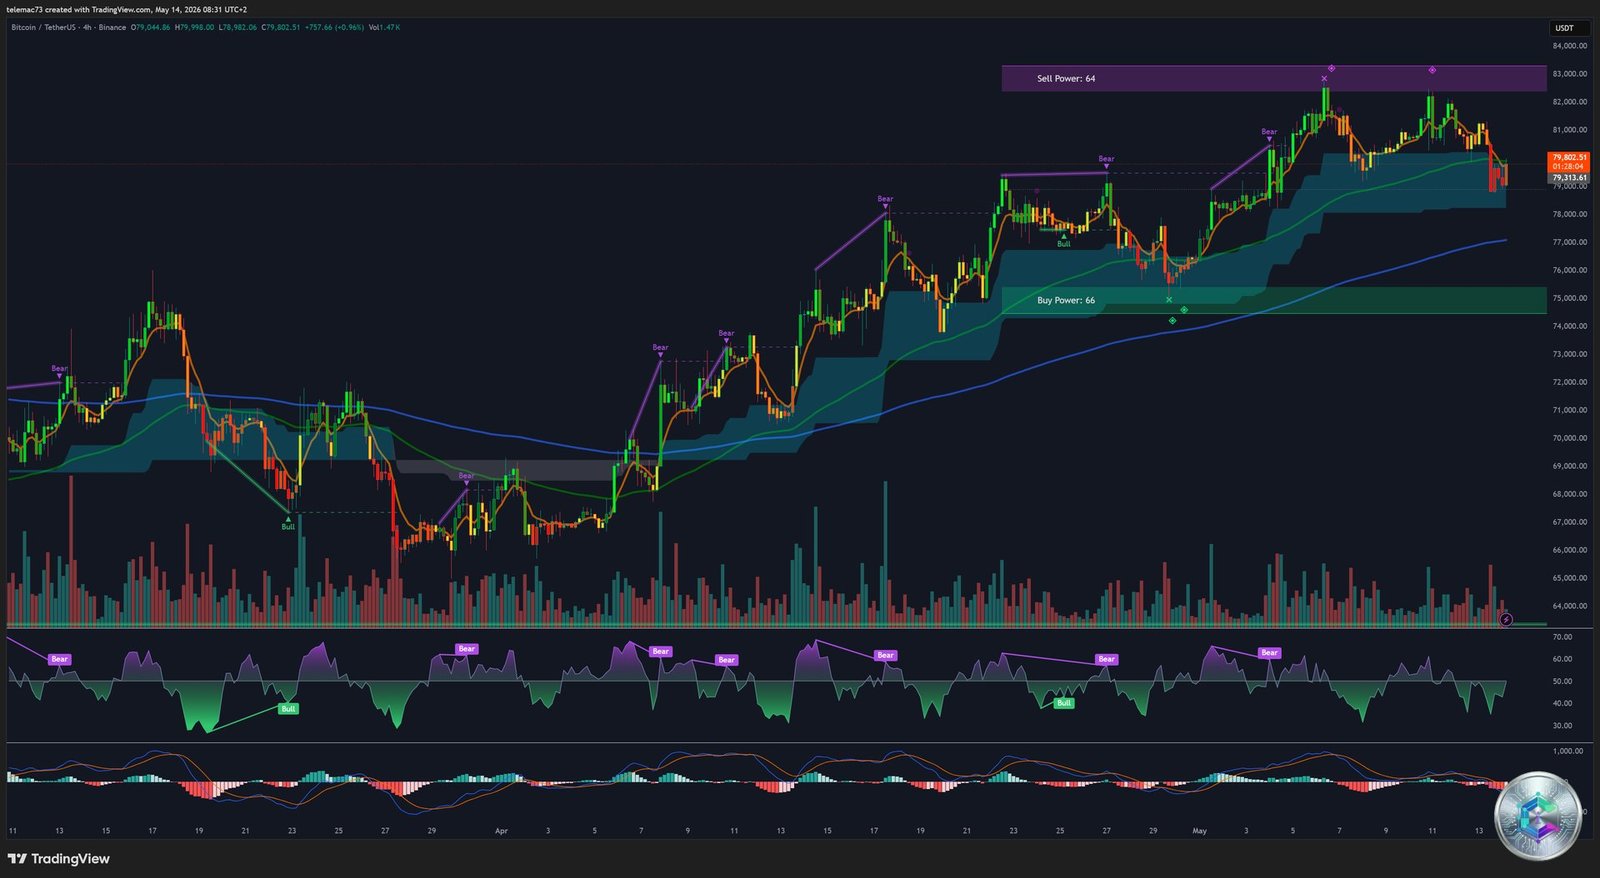
The 4-hour chart is dominated by a classic continuation pattern: a Bull Flag, evolving in the shape of a symmetrical compression triangle. Following a powerful vertical impulse that extracted price from the lows below $72,800, the market entered a digestion phase with characteristically converging trend lines.
The BBWP (Bollinger Band Width Percentile) is recording a historically extreme compression on this timeframe. The market is behaving like a fully loaded spring: the longer the consolidation within the triangle persists, the more violent and sustained the eventual breakout (in either direction) will be. A confirmed break above the flag’s resistance (~$81,000) would activate technical targets in the $84,000–$85,500 zone, with gravitational pull toward the unfilled CME gap at $91,700–$92,600.
Worth noting: minor CME gaps persist around $68,960–$69,560, representing an asymmetric downside risk if the flag fails and morphs into a bull trap.
Intraday Micro-Structure (15 Minutes): Liquidity Hunting
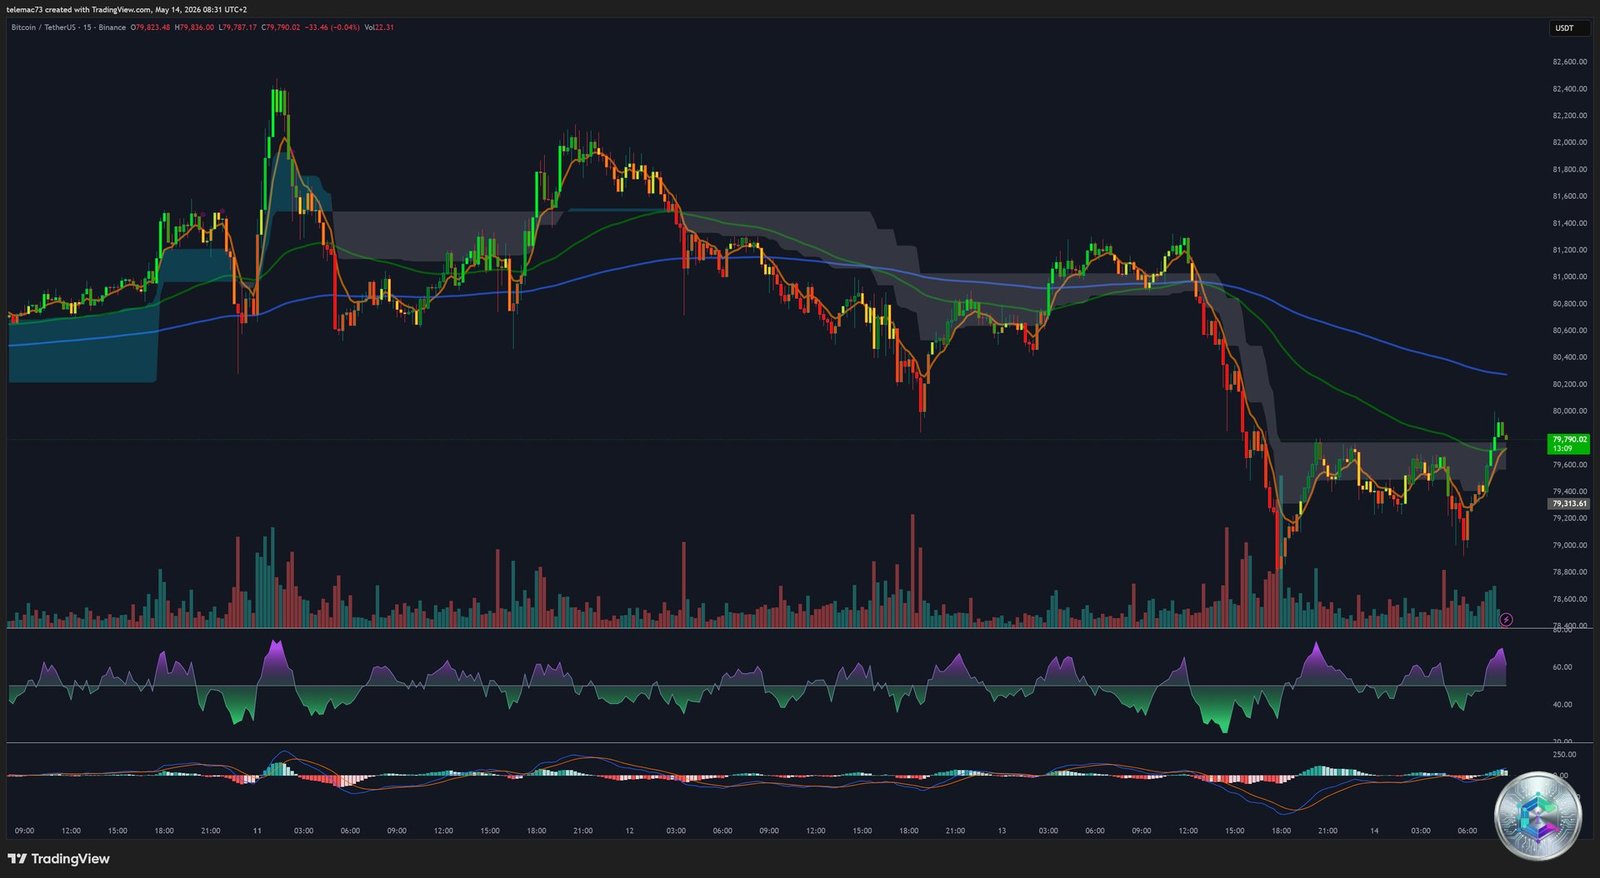
The 15-minute chart depicts erratic, choppy behavior characterized by aggressive wicks sweeping retail stop-losses placed at « equal highs » and « equal lows. » These algorithmic footprints reveal a systematic liquidity hunt operating within the compression zone.
This is the timeframe where macro announcements will be immediately visible. A genuine directional break must be confirmed by a 15-minute candle close outside the compression zone followed by a volume-validated retest. Without this volume filter, any large-amplitude move on this chart should be treated with maximum skepticism as a potential false signal designed to trap impatient participants.
Liquidity Architecture: The Order Book Heatmap
The order book heatmap analysis reveals a market compressed between two colossal liquidity vises:
🔴 Upper Sell Wall
Zone $81,000–$84,000: massive accumulation of limit sell orders and high-leverage short liquidations (up to 100x). A break through $82,000 would trigger a violent short squeeze, propelling BTC toward $85,000–$87,000.
🟢 Buyer Floor
Zone $79,800–$80,500: long liquidation clusters. Open Interest at $27B rising while price declines is the algorithmic fingerprint of aggressive short accumulation. A break below $79,200 would cascade toward $74,000–$76,000.
Pivot Points & Key Levels — May 14, 2026
| Level | Classic | Fibonacci | Role |
|---|---|---|---|
| R3 | $79,947 | $79,815 | Strong Resistance |
| R1 | $79,461 | $79,461 | Intermediate Resistance |
| Pivot (PP) | $79,890 | $79,890 | Central Level |
| S1 | $79,238 | $79,325 | Immediate Support |
| S3 | $78,883 | $79,106 | Last Line Before Capitulation |
Forward Scenarios: Inside the Eye of the Storm
🟢 Scenario Alpha — Bullish Breakout (Conditional)
If the CLARITY Act clears the Senate Banking Committee with unified Republican support, the chain reaction will be immediate: absorption of the $82,000 sell wall, triggering a massive short squeeze, validating the 4H Bull Flag. The trajectory would target $85,286 (Fibonacci 61.8%), then the unfilled CME gap at $91,700–$92,600 — the first leg of a move toward Citi’s institutional target of $143,000 by year-end 2026.
🔴 Scenario Beta — Bearish Capitulation (Imminent Risk)
A failed vote combined with hawkish rhetoric from Governor Barr equals a complete risk repricing. The structural support at $79,200 gives way, triggering a long liquidation cascade toward $74,000–$77,000, then a test of the definitive fortress at $71,000–$72,000. Failure to defend this zone would plunge the market into a prolonged crypto winter for the remainder of 2026.
Conclusion: A Historic Crossroads
Bitcoin’s current consolidation is not a stable equilibrium — it is the eye of a hurricane. The convergence of extreme technical compression (historic BBWP, collapsing ATR), explosive liquidity architecture ($27B in Open Interest), and binary macro/regulatory catalysts (CLARITY Act vote, Barr speech) guarantees a violent resolution. Based on the totality of metrics analyzed, Bitcoin’s next volatility expansion will be written into the history books of financial markets.
⚠️ Disclaimer — For Educational Purposes Only
This article is written exclusively for educational and informational purposes. It does not constitute investment advice, nor a recommendation to buy or sell cryptocurrencies or any other financial asset. Cryptocurrency markets are extremely volatile and carry significant risk of capital loss. Please consult a qualified financial advisor before making any investment decisions.