
1. Macro-Financial Context: The Fuel Behind the Rally
In the spring of 2026, the global financial architecture is undergoing a critical rebalancing phase. Bitcoin (BTC) operates within a complex ecosystem where every price movement is the result of a multi-variable equation: interest rates, geopolitical flows, inflation data, and the sophisticated mechanics of derivatives markets. This May 8, 2026 multi-timeframe analysis deconstructs price action using daily, 4-hour, and 15-minute charts, liquidation heatmap data, and fundamental news flows shaping market psychology.
1.1. The Geopolitical and Macroeconomic Chessboard
The current environment is dominated by a notable easing of international geopolitical tensions, particularly visible through high-level diplomatic maneuvers between the United States and Iran. In the context of the 2026 U.S. midterm election cycle, this strategic de-escalation has acted as a powerful catalyst for global risk appetite. The most immediate effect materialized as a massive liquidity injection into equity markets: the S&P 500 surpassed 7,230 points, the Nasdaq followed a similar trajectory, and the Dow Jones briefly broke the symbolic 50,000-point barrier.
In parallel, WTI crude oil holding below the critical $110/barrel resistance preserves the Federal Reserve’s room to maneuver, avoiding the liquidity drain that would directly penalize infinite-duration assets like Bitcoin. The U.S. Dollar Index (DXY) is displaying signs of technical weakness, which mechanically revalues BTC priced in USD.
1.2. Institutional Plumbing: The Spot ETF Absorption Mechanism
The defining differentiator of the 2026 cycle lies in the profound transformation of Bitcoin’s market microstructure: the asymmetric and sustained demand from spot Bitcoin ETFs. Capital flow data documents an unbroken streak of $1.69 billion in net inflows at the start of May. Unlike synthetic futures contracts, acquiring spot ETF shares forces institutional issuers to physically withdraw Bitcoin from exchange reserves and place them in cold storage — creating a permanent supply shock and an unshakeable floor under support levels. The Fear & Greed Index, back to absolute neutrality (~50), confirms this appreciation is not fueled by irrational exuberance, but by measured and strategic asset reallocation.
2. Multi-Timeframe Technical Analysis (Top-Down Approach)
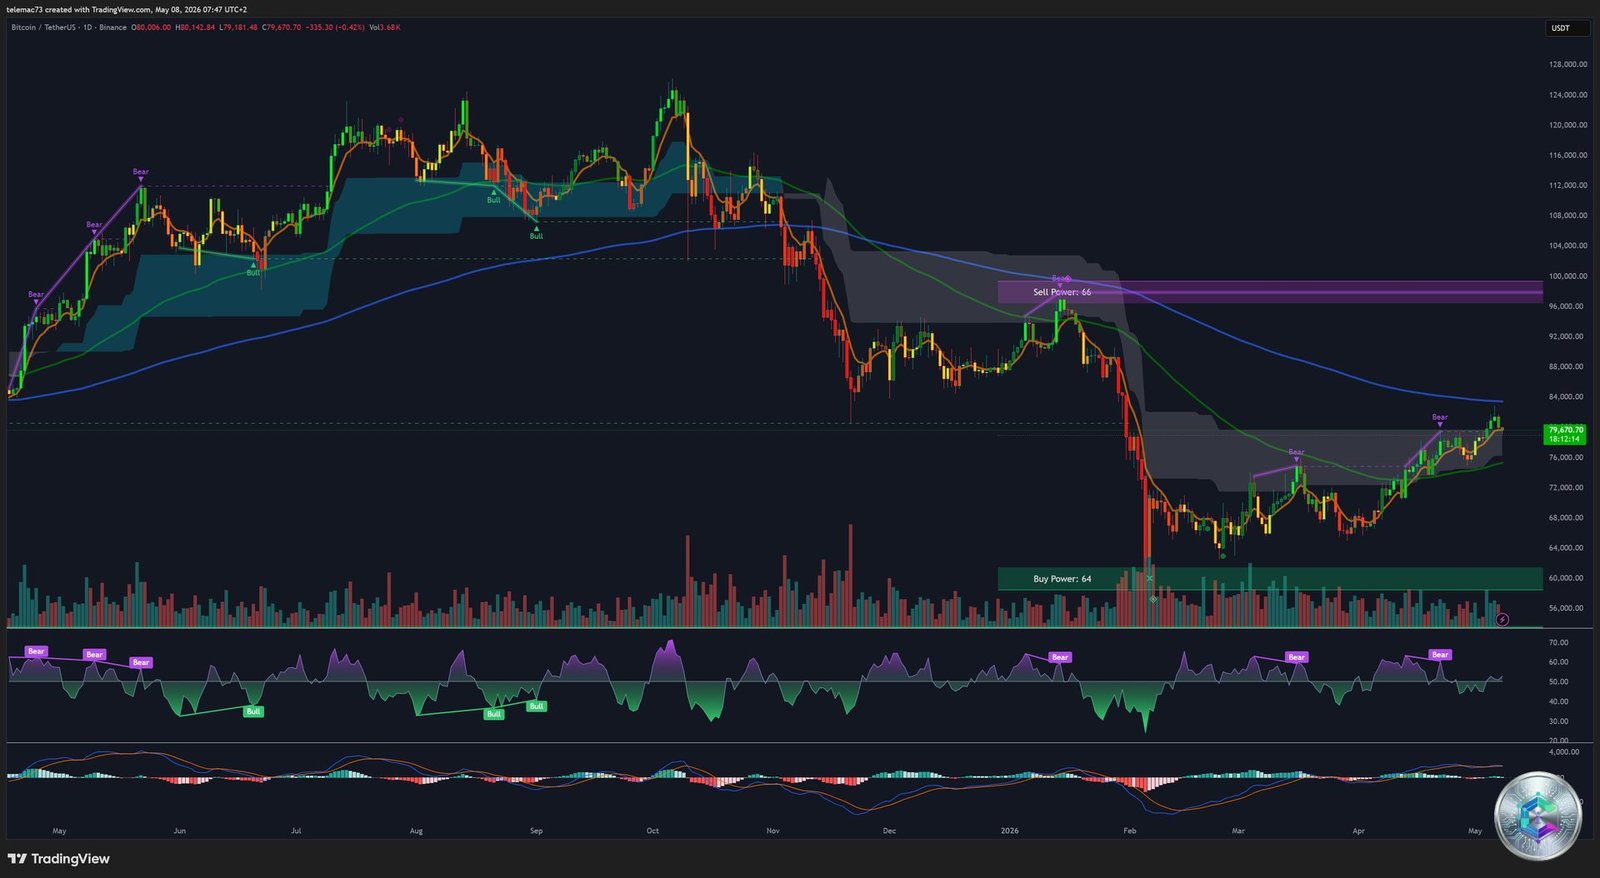
2.1. Daily Chart (1D): The Macro Landscape
The daily chart reveals a technically captivating picture. After reaching historical peaks above $120,000, Bitcoin underwent a structural purge driven by temporary ETF outflows, post-halving miner selling pressure, and cascading systemic liquidations. This correction found its absolute floor around $62,800 — a historical accumulation zone identified as the « Buy Power: 64 » block ($60,000 – $64,000).
At the time of this analysis, price oscillates within the critical corridor of $79,678 – $81,760. The most significant technical achievement of this recovery is the recapture of the 200-day EMA (~$72,035), confirming structural engagement in a primary bullish cycle. Every minor pullback is rapidly absorbed, indicating a kinetic energy buildup ahead of a major breakout.
Key Fibonacci Levels:
- $79,025 (Fib 0.5): Former resistance now flipped to first line of defense. Holding this level is the sine qua non for a continuation of the bullish structure.
- $83,522 (Golden Ratio 0.618): The ultimate lock of the correction. A decisive daily close above this level formally invalidates the relief-rally thesis and opens the floodgates toward $85,000, then $90,000.
- $96,000 – $100,000 (Sell Power: 66): Historical resistance block and year-end macro target if the current momentum is sustained.
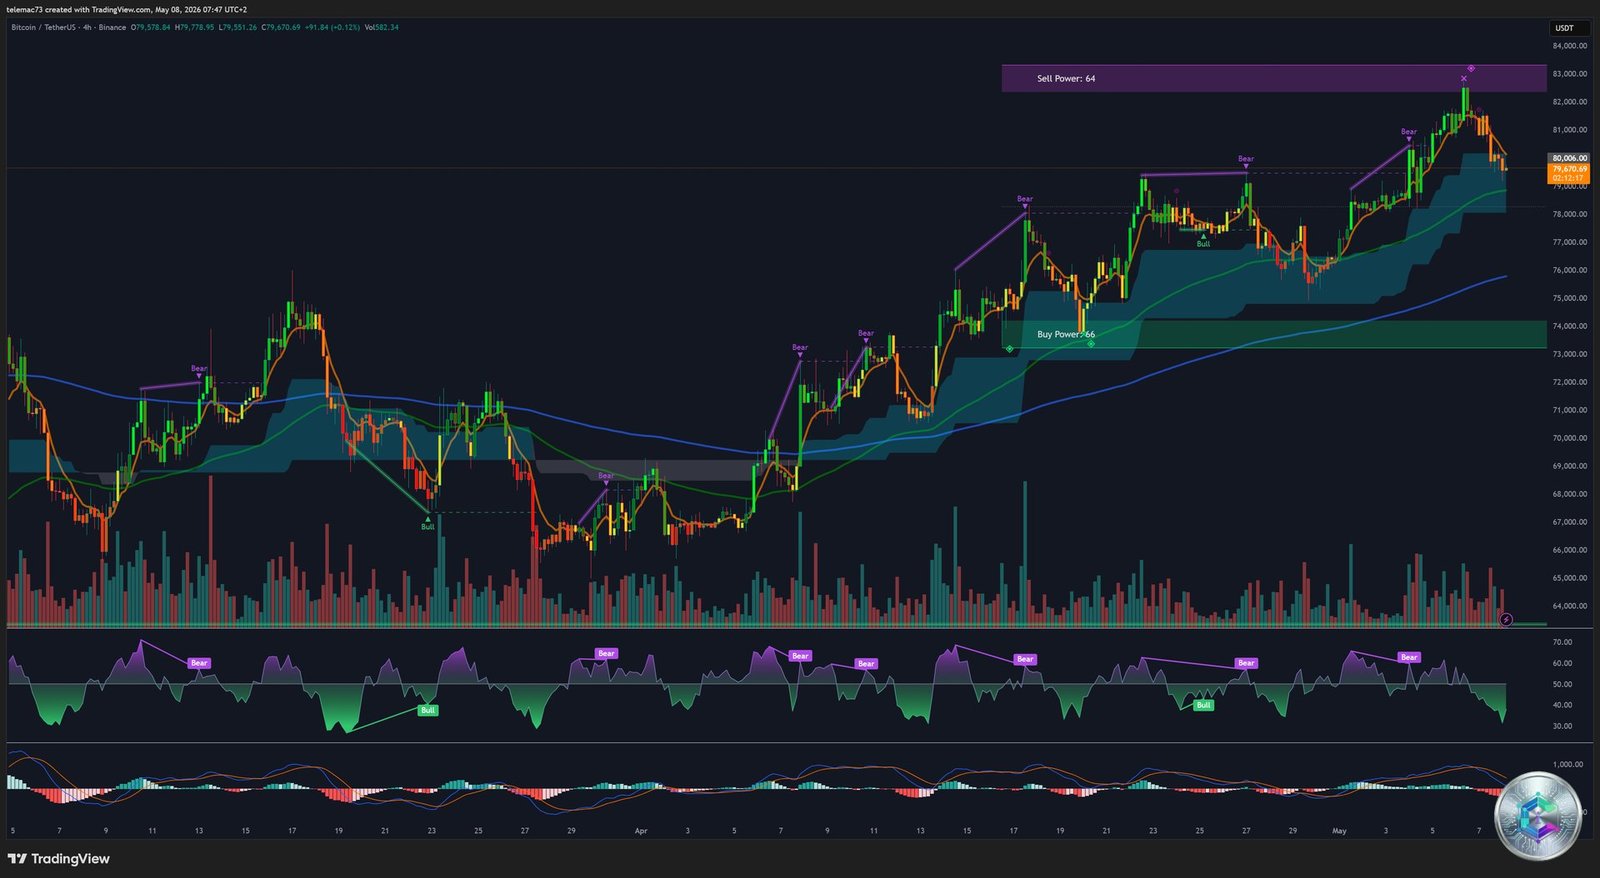
2.2. 4-Hour Chart (H4): The Tactical Battlefield
Zooming into the H4 chart reveals the tactical battles fought by medium-term algorithmic trading systems. Bitcoin’s journey since mid-April consists of a series of violent impulse legs followed by extended lateral distribution phases in the form of bullish flags (Bull Flags). The current architecture is framed between:
- « Buy Power: 66 » Support ($73,000 – $74,000): The foundation from which the latest major impulse originated.
- « Sell Power: 64 » Resistance ($82,000 – $83,000): A dense glass ceiling. The key to resuming the bullish trend lies in a firm close above $82,133 — the absolute trigger signal identified by quantitative models.
The H4 MACD perfectly illustrates the dynamic: after a masterful Golden Cross during the rally from $73,000, the lines are converging toward a potential minor Death Cross — a signal of temporary exhaustion. This validates the continuation of the flag consolidation — a healthy breathing period that cools overheated indicators before the next assault. A vigorous defense of the $76,000 – $78,000 zone remains imperative to prevent the flag from turning into a bull trap.
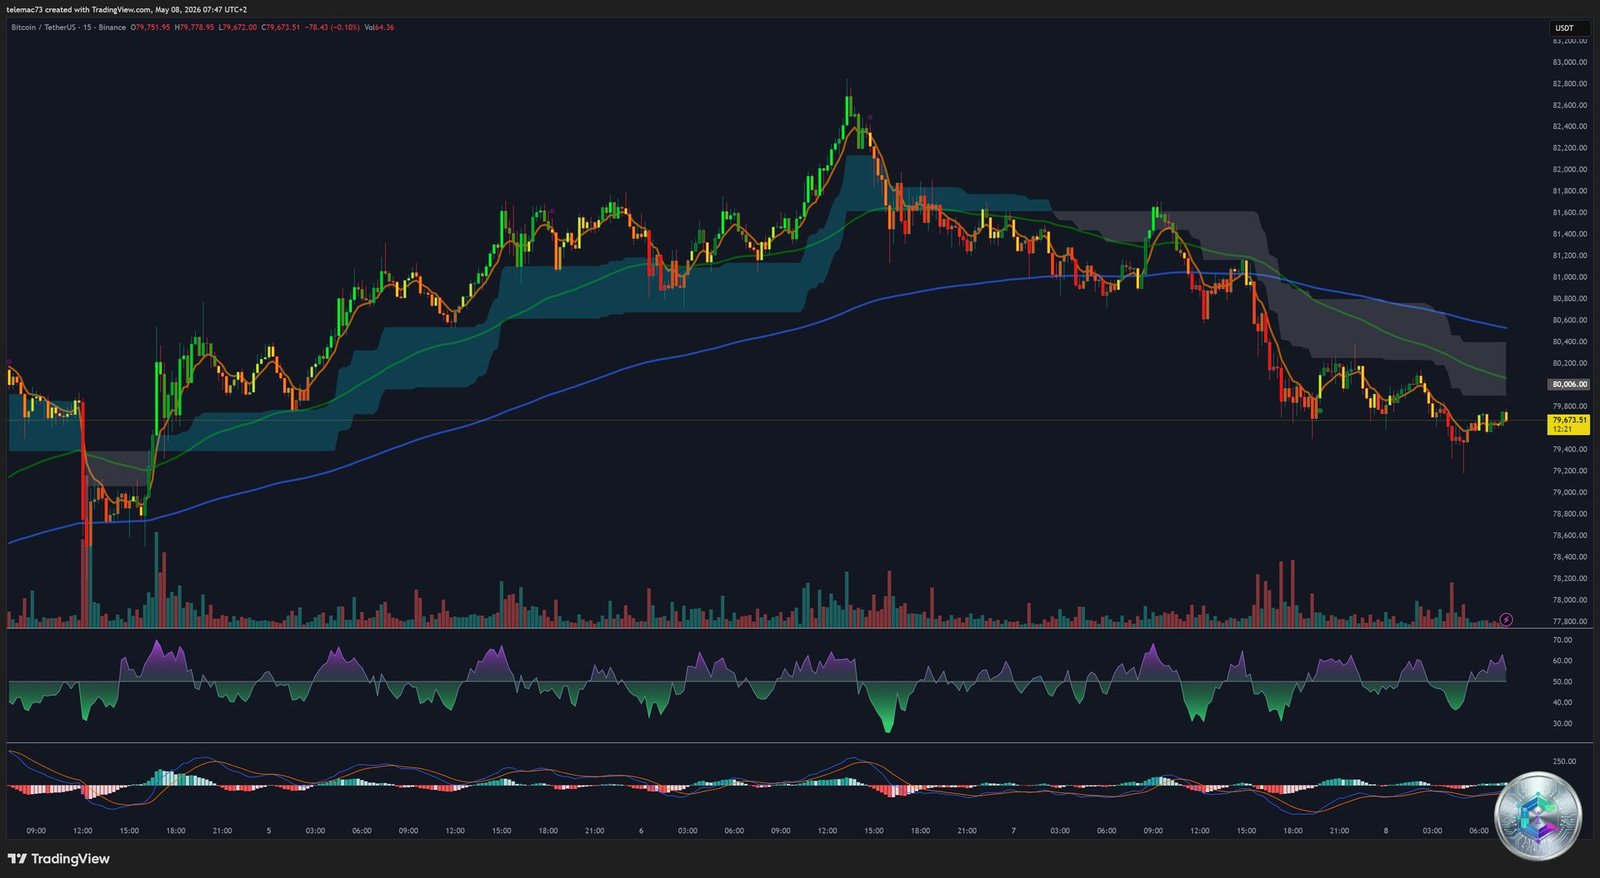
2.3. 15-Minute Chart (M15): Intraday Microstructure
Immersing into the 15-minute timeframe exposes the brutality of high-frequency market microstructure. Following a parabolic surge to local peaks, the market suffered an aggressive selling cascade that dragged price back into the critical $79,600 – $80,000 zone. The current front line sits between $80,965 and $81,105 (BTC MAY26 futures): its recent breach has damaged the intraday structure.
For intraday traders, the absolute priority is observing price behavior around the $79,000 support (Fibonacci 0.5). A failure at this level would expose the market to a slide toward naked price control points below. Conversely, a swift reclaim above $81,105 accompanied by a volume spike would demonstrate that the decline was merely a manipulation to flush out weak buyers before resuming the uptrend.
3. Momentum Oscillators: RSI and Stochastic Analysis
Evaluating the intrinsic strength of a trend requires analyzing the second derivatives of the market: momentum and velocity. On daily and weekly timeframes, the classic RSI holds firmly above its 50 midline, confirming buyer momentum dominance. The current pullback toward $79,600 allows the oscillator to discharge from its temporary overbought zone (RSI briefly above 70 during the $81,000 pushes), purging excess without damaging the primary bullish structure.
The Stochastic RSI delivers a sophisticated dual message: the fast curve (%K = 67.51) above the smoothed curve (%D = 61.69) signals accelerating momentum — but the indicator dangerously approaches the 80 overbought threshold. This configuration demands precision risk management. If price weakens below $79,000 on an adverse NFP report, the Stochastic would trigger a cascade of algorithmic sell signals, turning a profit-taking event into an aggressive retracement toward $72,000. The survival of the current dynamic depends on a lateral consolidation enabling a time correction rather than a price correction.
4. Liquidation Heatmap: Reading the Order Book X-Ray
In a market dominated by high-frequency algorithmic trading, price analysis alone is insufficient. The liquidation heatmap maps the potential liquidation pockets linked to margin calls on leveraged positions — an essential tool for anticipating price movements, which are invariably attracted toward the zones of maximum liquidity concentration.
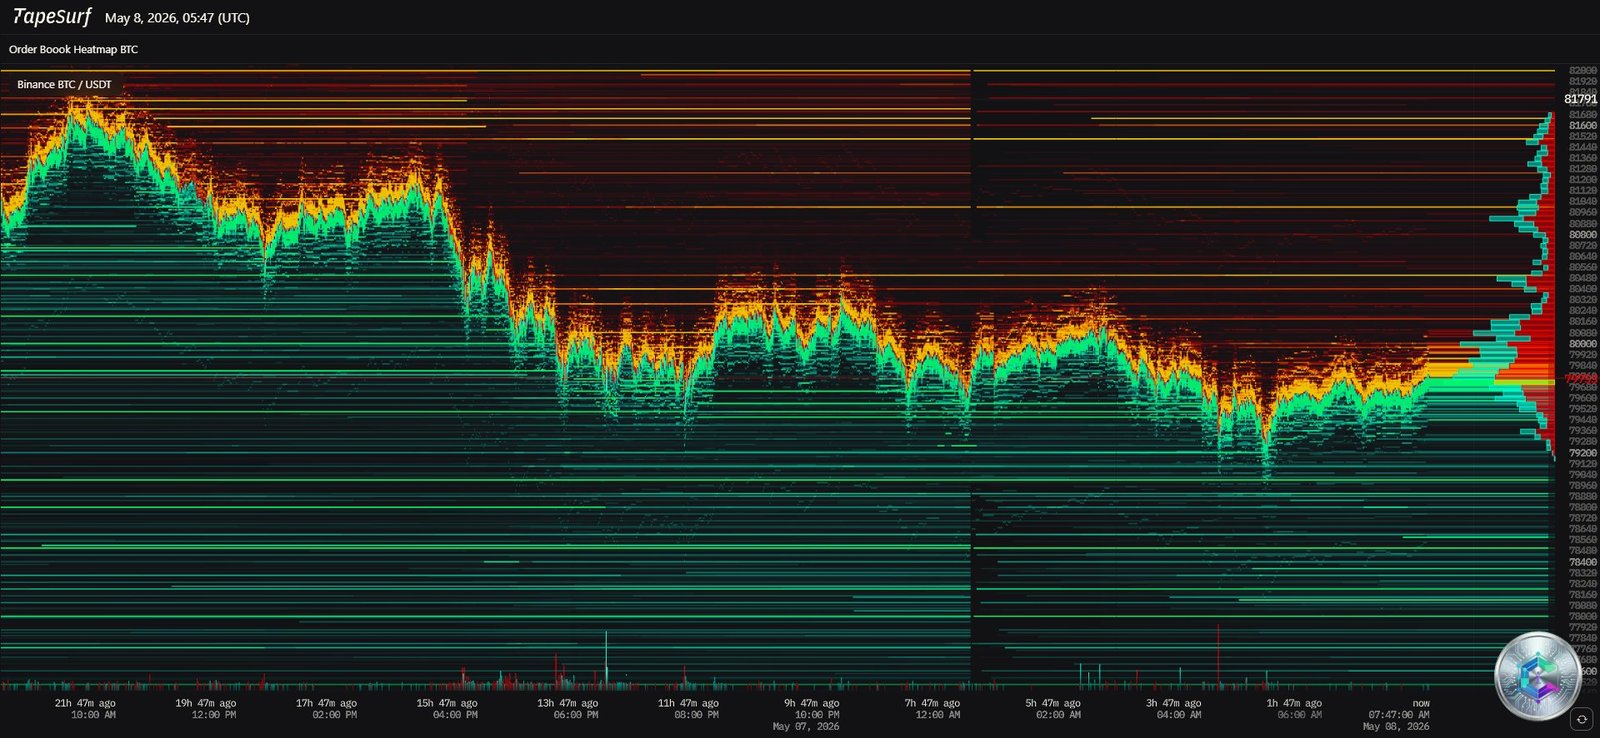
The heatmap architecture is startlingly clear:
- $83,500 – $85,000 (Bright Yellow — Maximum Short Density): An explosive liquidation reservoir. A breach of this zone would trigger a self-reinforcing forced buyback loop (Gamma Squeeze), propelling price toward $85,000 and beyond. Estimated potential: over $1 billion in short liquidations.
- $78,000 – $82,000 (Orange — High Short/Seller Density): The current friction zone. Approximately $270 million in short positions were already vaporized during the initial $80,000 breakout.
- Below $80,000 (Purple/Dark Blue — Liquidity Gaps): Air pockets in the order book. A support break would trigger a gravitational free-fall toward $78,000 then $76,000 with alarming velocity.
- $72,000 (Green — Long Accumulation / 200-day EMA): The ultimate buyer liquidity basin; the Smart Money re-accumulation zone in the event of a local crash.
5. Chart Patterns: Flags, Triangles, and Market Fractals
Chart analysis reveals that Bitcoin now responds with precision to classical geometric patterns, reflecting institutional maturity. The progression from the spring lows follows a methodical Staircase Pattern — the unmistakable signature of large-scale organic accumulation — with successive consolidation platforms at $65,000, $68,000, and $70,000.
On the H4 and Daily timeframes, these plateaus manifest as Bullish Flags — one of the most reliable patterns in technical analysis, boasting a success rate exceeding 68% according to 2026 archival databases. The current structure is textbook-perfect:
- The Flagpole: The near-vertical surge from $73,000, carried by trading volumes 200-300% above the smoothed average and geopolitical catalysts.
- The Flag: The slow, orderly regression from $82,800 toward $79,600, inscribed within a parallel descending channel, with a 50-70% volume contraction from the peak. The absence of institutional selling pressure is glaring. The eventual upside breakout will mathematically project price toward $85,000.
The M15 fractals also reveal sketches of Symmetric Compression Triangles — a coiled spring whose resolution, within a confirmed primary uptrend (above the 200-day EMA), statistically resolves with a violent upside breakout in the overwhelming majority of historical cases.
6. Global Crypto Climate and Correlation Effects
Bitcoin does not operate in isolation. As of May 8, 2026, several sector-wide dynamics reinforce the global bullish sentiment:
- XRP/Ripple: The SEC’s withdrawal of its appeal delivers decisive regulatory clarity. XRP acquires commodity-like digital asset status, paving the way for seven U.S. Spot XRP ETFs with over $1.4 billion in net inflows. This normalization of large-cap altcoins instills systemic confidence, supporting Bitcoin’s elevated valuations.
- DASH: A stunning 50% rebound from its $30 depths signals aggressive retail investment psychology characteristic of intermediate bull market phases.
- Prediction Markets: Growing volume on platforms like Polymarket demonstrates the abundance of available risk capital and the absence of a hoarding panic — an essential shock absorber for Bitcoin’s volatility.
7. Predictive Modeling: The Two Scenarios
The synergistic integration of all these signals allows us to establish a directional model for mid-May 2026. Bitcoin is oscillating within a highly compressed volatility corridor between $79,000 (gravitational maintenance line) and $83,000 (the sell order wall).
🟢 Alpha Scenario: Institutional Parabolic Expansion (Primary Probability)
This reference scenario relies on the unalterable real-demand absorption from spot ETFs within a global environment of geopolitical détente. The non-negotiable prerequisite: preservation of the psychological support at $80,000 (last-resort boundary at $79,025, Fib 0.5 on M15).
The trigger signal: a volumetric candle close above $82,133, then $83,522 (Golden Ratio). This breakthrough will activate the immense short liquidation reservoir estimated at over one billion dollars (Short Squeeze). Price will then launch toward $85,000, and following the final psychological validation of the bull market, into the rarefied zone of $90,000 – $100,000.
🔴 Omega Scenario: Bull Trap Capitulation (Secondary Probability, Critical Impact)
Abandonment of the precarious equilibrium zone at $80,965 – $81,105 combined with unexpected NFP data could seize the bullish machinery. The MACD and Stochastic RSI would then validate cascading Death Crosses from their near-overbought levels.
An inability to sustain the Fibonacci $79,000 axis would precipitate price into the liquidity gaps toward $76,000 – $78,000, retroactively transforming the entire spring breakout into a monumental bull trap. The ultimate bulwark: the confluence of the 200-day EMA around $72,035. Any close below $78,000 would dramatically invert the probabilistic balance of power.
Sophisticated investors and short-term traders must treat the $79,000 – $83,500 interval not as a passive accumulation space, but as a binary arena — whichever faction manages to impose a decisive directional close will dictate the macroeconomic trend for the remainder of H1 2026.
📋 Key Levels Summary Table
| Level | Price | Nature | Significance |
|---|---|---|---|
| Parabolic Target | $90,000 – $100,000 | Ultimate macro resistance | 🎯 Target If > $85K |
| Major Resistance | $85,000 | Dense supply zone | 🔴 High |
| Golden Ratio Fibonacci | $83,522 | Correction lock level | 🔴 Medium-High |
| Local Ceiling / Signal | $82,133 | Directional bullish trigger | 🔴 High |
| M15 Front Line | $80,965 – $81,105 | Intraday pivot | ⚡ Very High |
| Psychological Support | $80,000 | Critical demarcation line | 🟡 Critical |
| Fibonacci 0.5 / Current Price | $79,025 | First safety net | 🟡 Immediate |
| Bull Trap Zone | $76,000 – $78,000 | Bullish momentum invalidation | 🟢 Moderate |
| 200-Day EMA / Floor | ~$72,035 | Ultimate bull market support | 🟢 Low |
⚠️ Disclaimer: This article is written for exclusively educational and informational purposes. It does not constitute investment advice, nor a recommendation to buy or sell digital assets or any other financial instrument. Cryptocurrencies are highly volatile and speculative assets. All investments carry risk, including the total loss of capital invested. Please consult a licensed financial advisor before making any investment decision.