
The Bitcoin market stands at a historic technical crossroads. On April 11, 2026, the asset trades around $72,847, posting a 1.50% gain over the past 24 hours, as it attempts to break free from a two-month consolidation phase. The convergence of extreme retail fear, massive institutional accumulation, and a rapidly shifting geopolitical backdrop creates the conditions for a violent directional move. This analysis breaks down the forces at play through a comprehensive multi-timeframe study.
Macroeconomic Context: The Islamabad Catalyst
Bitcoin’s 2026 trajectory is inseparable from the global geopolitical context. On April 7, 2026, the announcement of a two-week ceasefire between the US and Iran — brokered by Pakistan — delivered a major positive shock to markets. The partial reopening of the Strait of Hormuz caused WTI crude to drop from $112 to approximately $100 per barrel, easing inflationary pressures and rekindling risk appetite.
April 11, 2026 marks the official start of peace negotiations in Islamabad. The American delegation, led by Vice President JD Vance and Jared Kushner, faces an Iranian team headed by Parliament Speaker Mohammad Bagher Ghalibaf. The stakes are immense: lifting of frozen assets and a permanent ceasefire in Lebanon are Tehran’s preconditions. Each statement from the negotiators triggers micro price movements on lower timeframes.
Macroeconomic Dashboard
| Variable | Value / Status | BTC Impact |
|---|---|---|
| Geopolitical Status | Ceasefire (2 weeks) | 🟢 Strongly Bullish |
| WTI Crude Price | ~$100/barrel | 🟡 Neutral-Bearish |
| US CPI Inflation | 3.3% | 🟡 Neutral |
| Fear & Greed Index | 16 — Extreme Fear | 🟢 Bullish (contrarian) |
| Fed Funds Rate | Hold likely | 🔴 Bearish |
This dichotomy between an improving geopolitical outlook and a still-inflationary economy explains why Bitcoin struggles to decisively break through the $73,000–$74,000 resistance zone without an additional major catalyst.
Daily Chart Analysis: Base Structure and Market Cycles
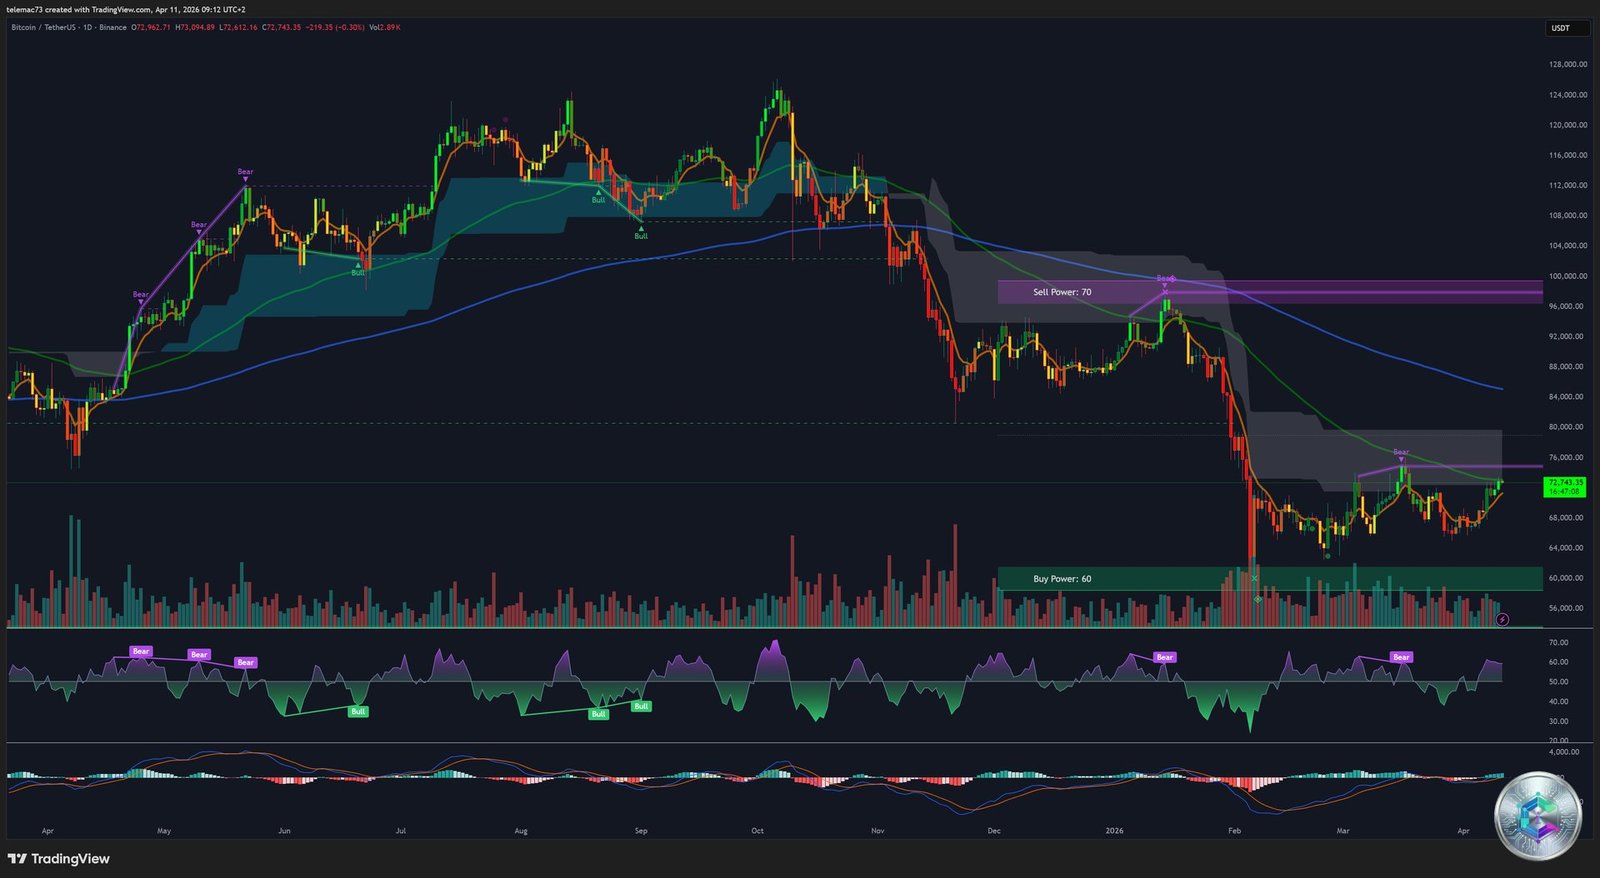
Since the all-time high of $126,000 in October 2025, Bitcoin has undergone a correction of nearly 47%, finding solid support around $60,000 in February 2026. The daily structure reveals a complex recovery that many analysts describe as the « bear leg » of the four-year cycle.
The Death Cross and Its Potential Invalidation
A major technical event occurred in March 2026: a Death Cross on the daily chart, where the SMA 50 crossed below the SMA 200. Traditionally a harbinger of a prolonged bear market, this configuration may nonetheless prove to be a massive bear trap. Bitcoin has already reclaimed the SMA 50 ($68,984), now being used as dynamic support. As long as price holds above it, bias remains moderately bullish.
Symmetrical Triangle and Fibonacci Levels
Bitcoin is consolidating within a large-scale symmetrical triangle, characterized by lower highs and higher lows:
- Upper resistance: $73,500–$74,500 (bullish breakout requires high volume)
- Lower support: ~$65,000 (the « line in the sand »)
- Measured bullish target: $87,000 on confirmed breakout
- Measured bearish target: ~$52,000 on downside breakdown
On the 90-day Fibonacci swing ($60,074 → $97,861), Bitcoin is stalling below the 61.8% retracement at $74,509. Reclaiming this level is crucial to validate a structural recovery toward $80,000. The immediate support at $65,725 (38.2% retracement) has shown strong institutional absorption in recent weeks.
4-Hour Chart: Medium-Term Dynamics
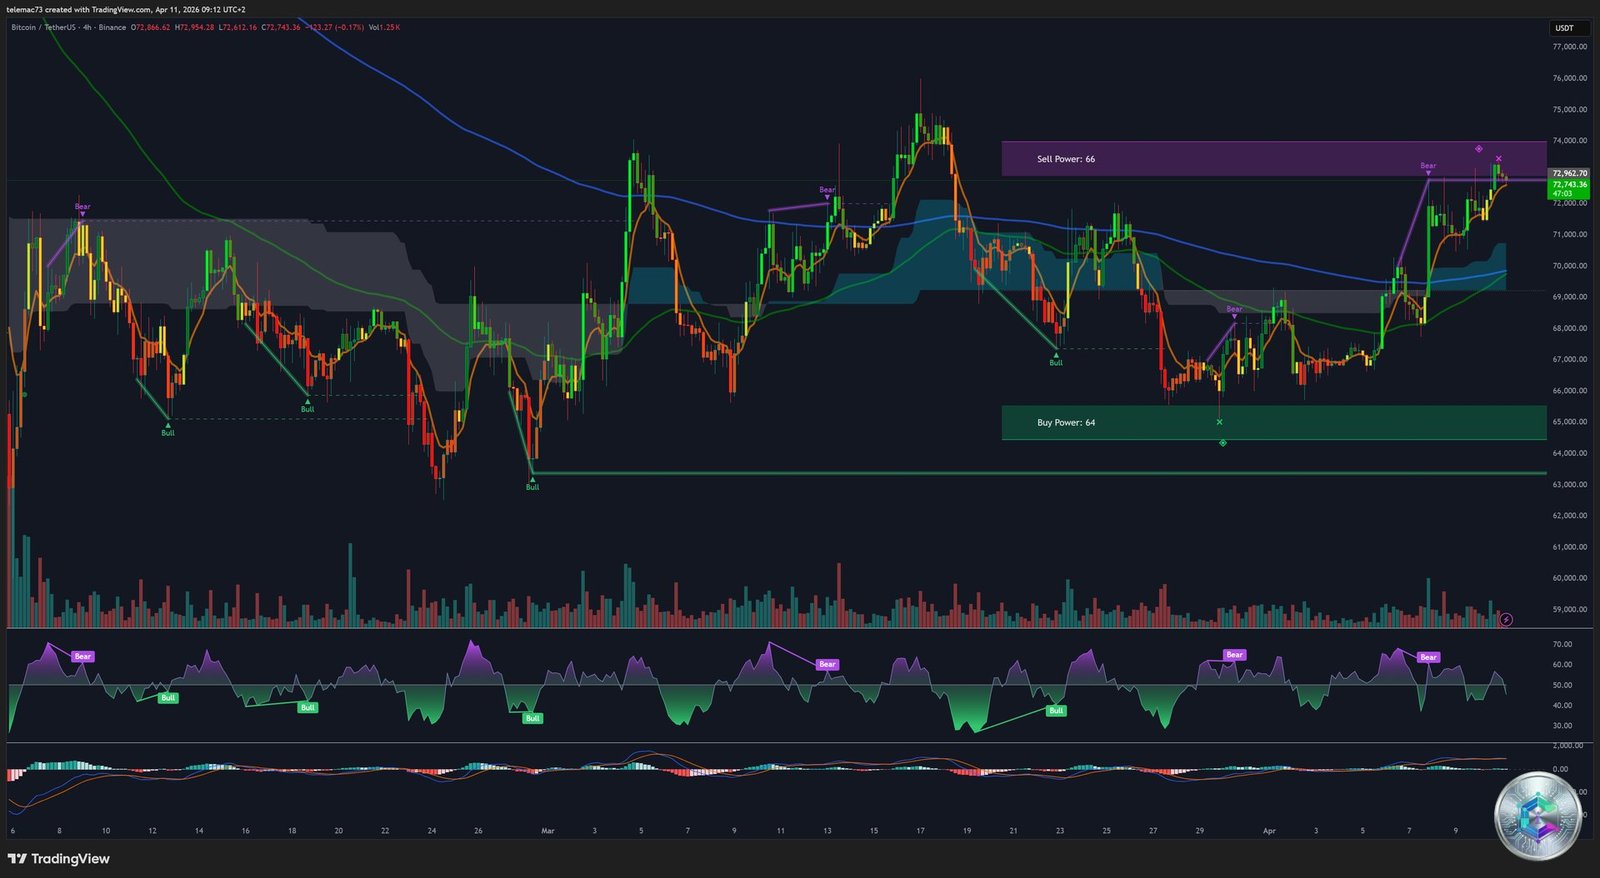
On the 4H timeframe, the structure is significantly more constructive. Bitcoin has printed a series of ascending lows since early April, with a key bullish pivot identified at $70,467.
RSI Divergence and EMA Golden Cross
The RSI 14 reads 59 — neutral to slightly bullish — but more importantly, a two-month accumulated bullish divergence is visible: price was testing lower supports while the RSI printed higher lows, signaling a structural weakening of selling pressure.
On April 8, 2026, a local Golden Cross formed on the 4H: the EMA 50 ($70,580) crossed above the EMA 100, triggering the rally toward $73,000. Price now trades above both the EMA 50 and EMA 200 ($68,350), a configuration favorable to buyers.
CME Gaps: Magnetic Attraction Zones
Bitcoin CME futures feature several unfilled price gaps that influence price action:
- Lower gap (4H): $64,890–$65,450 — probable revisit before resuming the rally
- Upper gap (massive): $92,000–$94,000 — the ultimate target for the spring 2026 rally
15-Minute Micro-Analysis: Intraday Precision
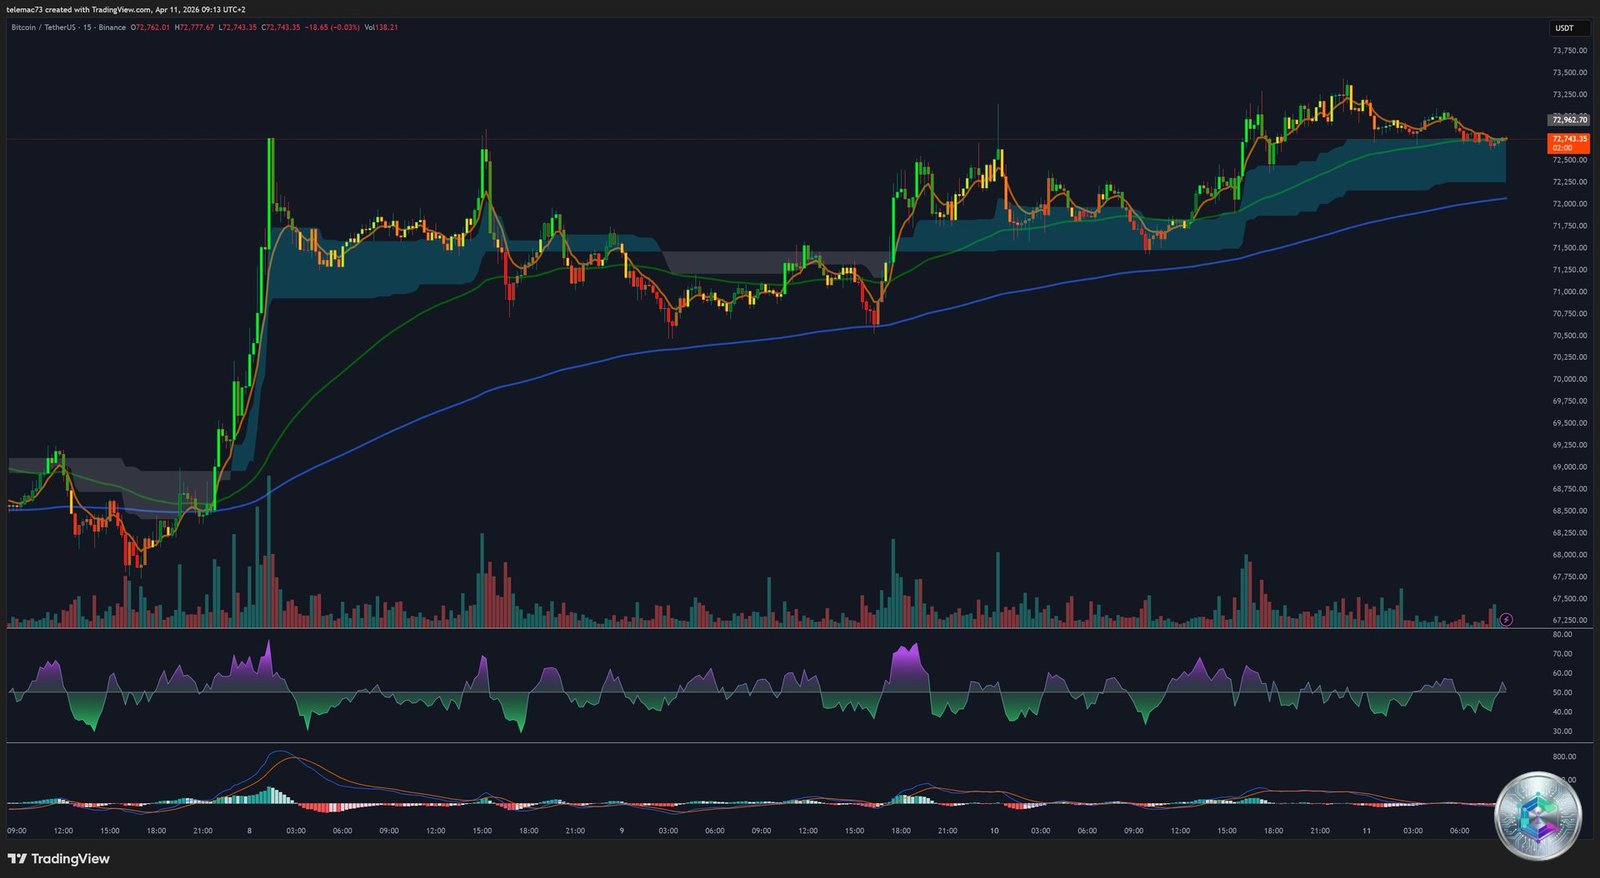
On the 15-minute chart, price oscillates in a compressed range between $72,744 and $73,084. The 24-hour ATR is at historically low levels for this cycle — a signal that a violent expansion move is imminent. Volume at $36 billion remains insufficient to confirm a breakout above $73,107; a volume spike of +50% above the volume moving average would be the sought-after long entry signal.
The MACD (12,26) on 15 minutes shows a flattening histogram near local resistance. A bearish crossover below the signal line could pull price back toward the $71,000 pivot for a quick support test before another bullish attempt.
Liquidation Heatmap: The $6 Billion Short Squeeze
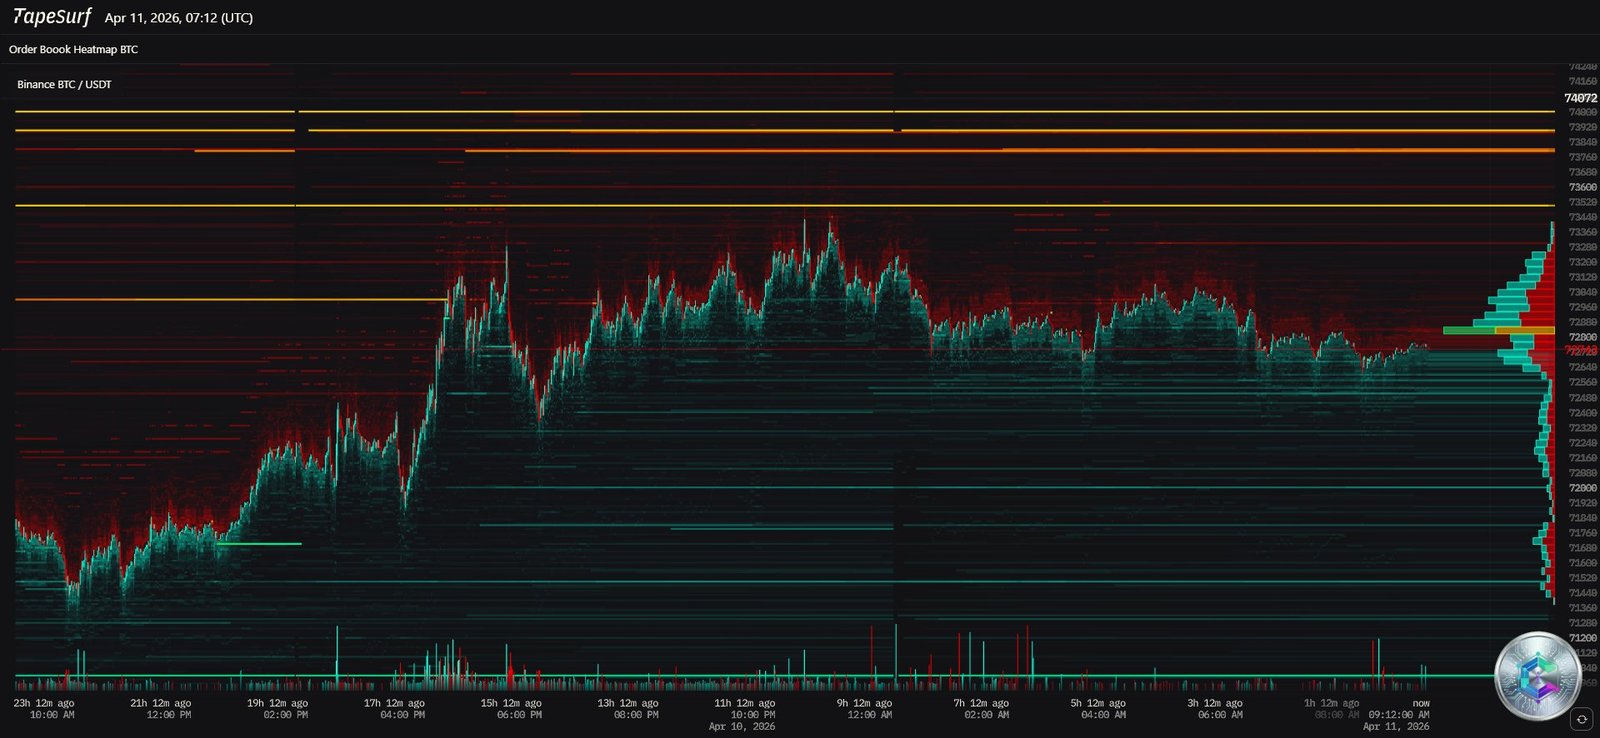
The liquidation heatmap reveals a massive liquidity asymmetry as of April 11, 2026. An estimated $6 billion in short positions is clustered between $72,200 and $73,500, with peak density at $72,500.
If Bitcoin breaks above $73,500, these forced sell orders will flip into buy orders, creating a liquidation cascade capable of propelling price toward $75,000–$80,000 within hours. Conversely, institutional buy walls between $70,000 and $71,500 protect the market from a rapid selloff.
| Price Zone | Liquidity Type | Intensity |
|---|---|---|
| $78,000–$84,000 | Cost-Basis Accumulation | 🔴 Very High (Resistance) |
| $72,500–$73,500 | Leveraged Shorts (10x–50x) | 🟠 High (Squeeze Target) |
| $70,000–$71,500 | Whale/Spot Buy Orders | 🟡 Moderate (Support) |
| $60,000–$65,000 | Leveraged Longs (2x–10x) | 🔴 Very High (Floor) |
Institutional Flows and ETFs: The New Market Engine
After a period of net outflows in March 2026, US spot Bitcoin ETFs are reversing course. On April 9, 2026, BlackRock’s IBIT ETF recorded its best day since March with $269.3 million in net inflows. Total ETF market flows posted $545.90M positive for the week ending April 10, confirming that major institutions are accumulating during the consolidation.
The arrival of Morgan Stanley with its MSBT ETF and the return to positive of the Coinbase premium (indicator of US institutional demand) confirm that the current rally is primarily driven by American institutional money — fueled by hopes of imminent regulatory clarity.
The CLARITY Act: April’s Regulatory Wildcard
April 2026 is decisive for the CLARITY Act (Digital Asset Market Clarity Act), a landmark piece of legislation defining the boundary between the SEC and CFTC. Treasury Secretary Scott Bessent and SEC Chair Paul Atkins are pushing for rapid adoption. A successful Senate Banking Committee vote would be seen as an ultra-bullish signal, opening the door to a new era of institutional adoption.
In parallel, the Reg Crypto proposal is in its final review stage at the White House. This framework aims to simplify fundraising exemptions for crypto startups, ending the « regulation by enforcement » approach that has penalized the sector.
On-Chain Dynamics: OG Whales and the Miner Pivot
OG whales (10+ year holders) sold approximately $271 million worth of Bitcoin last week. Crucially, unlike previous cycles, these sales are being absorbed by ETF inflows, keeping price within the $70,000–$72,000 range.
On the miner side, post-halving margin pressure and rising energy costs are forcing a strategic pivot. Riot Platforms transferred 500 BTC to fund a shift toward AI and high-performance computing (HPC) — a sign of industrial maturity, but also a signal that miners now treat their Bitcoin reserves as operational reinvestment capital.
Key Levels: Supports, Resistances and Pivots
Critical Supports
- $71,000–$70,500: Immediate support (4H EMA 50 + 61.8% retracement of March rally)
- $68,500: Major psychological and technical level (4H EMA 200)
- $65,000–$65,666: Daily « floor » support — break triggers capitulation toward $60,000
Major Resistances
- $73,107: Immediate barrier (buyer exhaustion observed)
- $75,400–$76,000: 100-day EMA + historical volume peak (daily close above = short-term bearish trend invalidation)
- $79,000–$80,000: Traders’ Realized Price — massive supply zone for short-term holders
Sentiment Indicators
- CME Weekly Pivot: $71,475
- Fear & Greed Index: 16/100 — contrarian opportunity zone (buying below 20 returned an average +18.3% within 14 days in 2025–2026)
Conclusion: Two Scenarios for Late April
The April 11, 2026 analysis positions Bitcoin in a final compression phase before a major directional move. The confluence of a Fear & Greed at 16, institutional accumulation via ETFs, and a potential $6 billion short squeeze creates an explosive setup.
🟢 Bullish Scenario — Probability: 65%
The ceasefire holds and a favorable CPI reading allow Bitcoin to break above $73,500. Cascading liquidations propel price toward $76,000, then $80,000 by end of April. CLARITY Act confirmation in the Senate opens the path to the CME gap at $92,000–$94,000 in May.
🔴 Bearish Scenario — Probability: 35%
Failed diplomatic negotiations and a rebound in oil above $110 trigger a rotation out of risk assets. Bitcoin breaks $65,000, triggering a long liquidation cascade toward $60,000. In an aggravated recession scenario, a test of February lows at $47,000–$53,000 becomes plausible before summer.
For the savvy investor, the current structure favors accumulation in the $68,000–$71,000 zone, with scaled profit-taking above $76,000 to lock in gains in the event of a rapid expansion toward upper targets.
⚠️ Disclaimer: This article is written for educational and informational purposes only. It does not constitute investment advice or a recommendation to buy or sell cryptocurrencies or any other financial asset. Cryptocurrency markets are extremely volatile and carry significant risk of capital loss. Please consult a qualified financial advisor before making any investment decisions. CryptoInfo.ch assumes no liability for decisions made based on this article.