
On May 20, 2026, Bitcoin (BTC) stands at a rare and critical crossroads. Rejected from its local highs around $82,000–$83,000, the asset is now consolidating precariously around $76,000–$77,000 — caught between unprecedented institutional and legislative adoption on one hand, and a structurally hostile macroeconomic environment on the other. This report offers a comprehensive, multi-dimensional breakdown of the Bitcoin market architecture: macro-geopolitical, fundamental, microstructural, and technical.
1. Macroeconomic Context: The Perfect Storm
1.1 Bitcoin Hostage to the Nasdaq
One of the most critical drivers of current price structure is the statistical correlation between Bitcoin and US technology indices. In April 2026, the BTC/Nasdaq correlation reached an all-time record of 0.96 — near-perfect synchronization. Institutional algorithms, risk-parity funds, and macro managers now treat Bitcoin not as a hedge against systemic instability, but as a hyper-volatile extension of the technology sector.
This dynamic was amplified by the public warnings of Michael Burry on May 8, 2026, who compared the current frenzy around AI-related stocks to the final euphoric months of the dot-com bubble of 2000. The implication for BTC is direct and asymmetric: a major Nasdaq correction would trigger massive crypto liquidations, as institutional managers facing margin calls on tech positions would prioritize liquidating their most liquid crypto holdings to raise emergency capital.
1.2 Geopolitics: The Oil Shock and Iran’s Bitcoin Gambit
The macroeconomic backdrop darkened significantly as US-Iran tensions reached a critical threshold. Military threats around the Strait of Hormuz — through which approximately 20% of the world’s seaborne crude oil trade flows — sent WTI crude surging to $104.45/barrel, fueling an inflationary resurgence dangerously close to 4% in the United States.
In a remarkable strategic countermove, Iran simultaneously deployed the state-backed « Hormuz Safe » platform (May 16–18, 2026): a service enabling the settlement of maritime shipping insurance premiums in Bitcoin for cargo transiting the strait. These cryptographically verifiable, autonomously executing on-chain policies could generate over $10 billion in annual revenues for the Iranian state — a striking demonstration of Bitcoin’s power as a sovereign, censorship-resistant payment rail.
1.3 Interest Rates: The End of the Pivot
The oil shock has definitively buried hopes of a dovish Fed pivot. The 30-year US Treasury yield has violently breached the psychological threshold of 5%, and the probability of a rate cut by end of 2026 has collapsed to a mere 2%. Under this entrenched « higher for longer » paradigm, the opportunity cost of holding Bitcoin versus guaranteed 5%+ bond yields explains in large part why BTC has been unable to sustain its breakout above $82,000.
| Macroeconomic Indicator (May 2026) | Value | Impact on Bitcoin |
|---|---|---|
| BTC / Nasdaq Correlation | 0.96 | 🔴 Extremely high — contagion risk |
| WTI Crude Oil | ~$104.45/barrel | 🔴 Negative — persistent inflation |
| US Inflation | ~4% | 🔴 Negative — no Fed pivot in sight |
| US 30-Year Treasury Yield | > 5% | 🔴 Very negative — high opportunity cost |
| Probability of Fed Rate Cut 2026 | 2% | 🔴 Negative — speculative liquidity drained |
2. Institutional Dynamics and Legislative Progress
2.1 The CLARITY Act: Bitcoin Elevated to Digital Commodity Status
May 14, 2026 marked a historic legislative milestone: the CLARITY Act was passed by the US Senate Banking Committee, officially classifying Bitcoin as a digital commodity. This legislation definitively removes the threat of SEC classification as a security, unlocking massive pools of institutional capital previously constrained by strict compliance mandates. Pension funds, sovereign wealth funds, and insurance companies now have the regulatory green light to allocate capital to Bitcoin.
2.2 Asymmetric Accumulation: BlackRock, MicroStrategy, and the Institutional Split
Despite the volatility, dominant market participants maintain unwavering conviction:
- MicroStrategy holds as of May 17, 2026 a portfolio of 818,869 BTC acquired across 109 separate transactions (~$64.23B), with an average cost of $75,540/BTC — a position still slightly profitable at current prices.
- BlackRock (IBIT) added over 8,000 BTC in May 2026, bringing its holdings to ~818,840 units, despite sitting on ~$7.9 billion in unrealized losses from the annual peak — a strong signal of deep long-term conviction.
However, the past week also saw $1.07 billion in net outflows from crypto investment products ($982M specifically from Bitcoin funds), ending a six-week streak of consecutive inflows. This duality illustrates a fractured institutional market: « tourist » capital fleeing the macro deterioration, while dominant strong hands continue to accumulate.
2.3 The US Strategic Reserve: An Imminent Catalyst
The United States holds approximately 328,000 BTC (~$25 billion) from judicial seizures. Following statements by White House advisor Patrick Witt at the Consensus Miami conference promising a major update « within the coming weeks, » markets are eagerly anticipating the formalization of an official Bitcoin Strategic Reserve (SBR). The conversion of these dormant seized assets into an active sovereign reserve asset would represent an immeasurable positive demand shock, placing Bitcoin alongside gold on the global geopolitical chessboard.
3. Market Microstructure: Order Book Deep Dive
The order book heatmap (TapeSurf — BTC/USDT Binance, May 20, 2026, 08:28 UTC, price: $77,296) provides a surgical real-time mapping of market participant intentions.
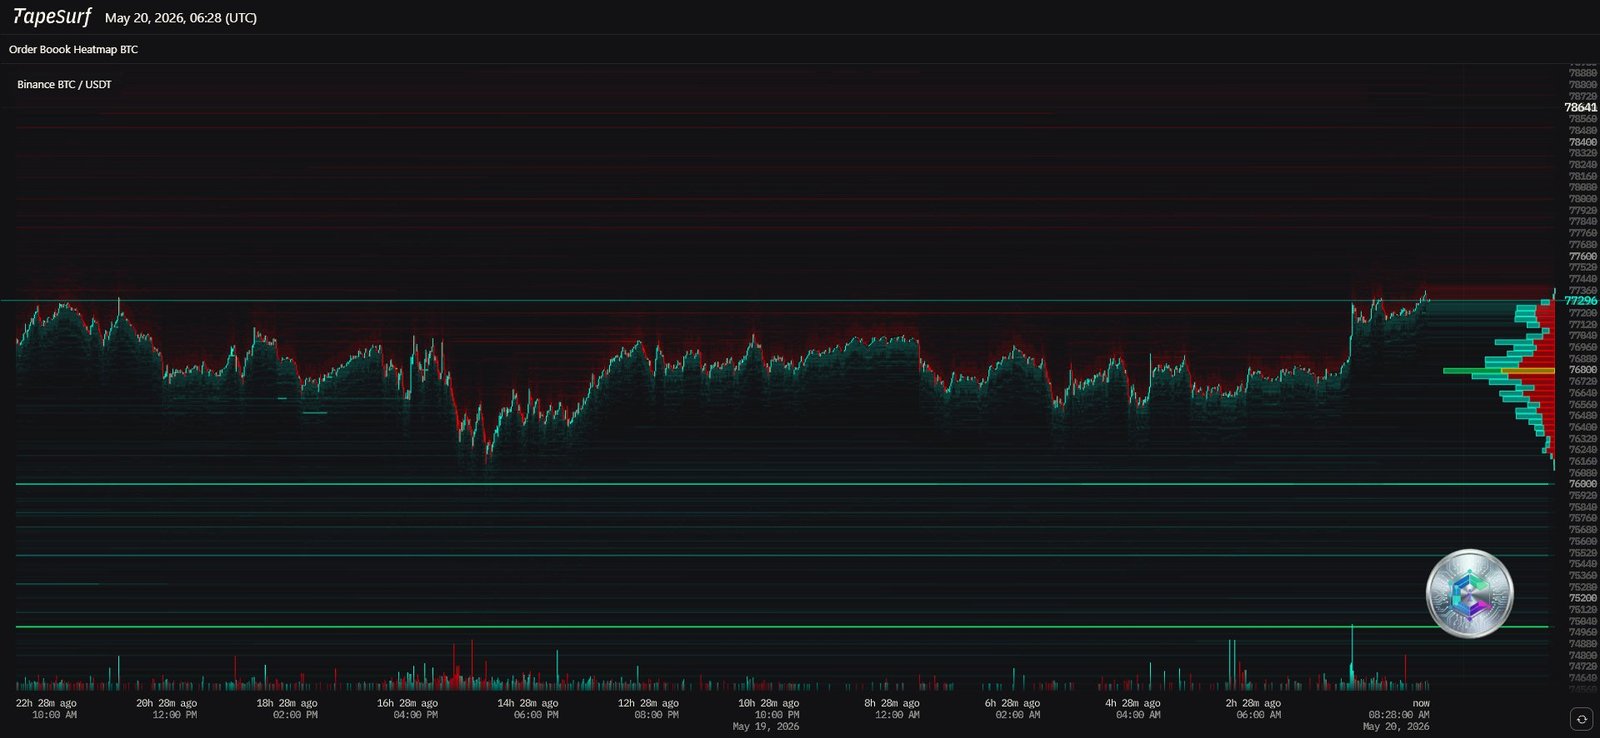
- Immediate resistance (« glass ceiling »): A dense wall of sell orders (thick red bands) extends from $77,500 to $78,500. The highest volume node (HVN) sits precisely in the $77,000–$77,500 zone, confirming persistent distribution at this level.
- Passive support: Green bands appear at $76,000 and $75,000, but their thickness is visually inferior to the overhead seller mass — the path of least resistance, from the order book perspective alone, remains downward.
3.1 The Systemic Threat: $11 Billion in Long Positions at Risk
Liquidation data (CoinGlass) reveals a major systemic vulnerability below current price. The mid-May correction already wiped out $670M–$800M in long positions in 24 hours, including $500M in just 15 minutes during the Asian session on May 18.
| Price Level | Microstructural Event | Risk / Opportunity |
|---|---|---|
| $82,000–$83,000 | Former high / liquidated cluster | Confirmed major resistance |
| $77,500–$78,500 | Massive sell wall (Heatmap) | ⚠️ Immediate bounce resistance |
| $74,700 | Cascade liquidation threshold | ⚠️ $3.4B in longs exposed |
| $68,000–$70,000 | Historical VRVP zone + Institutional Buy Wall | 💥 $11B potential liquidations / Optimal accumulation zone |
4. Multi-Timeframe Technical Analysis
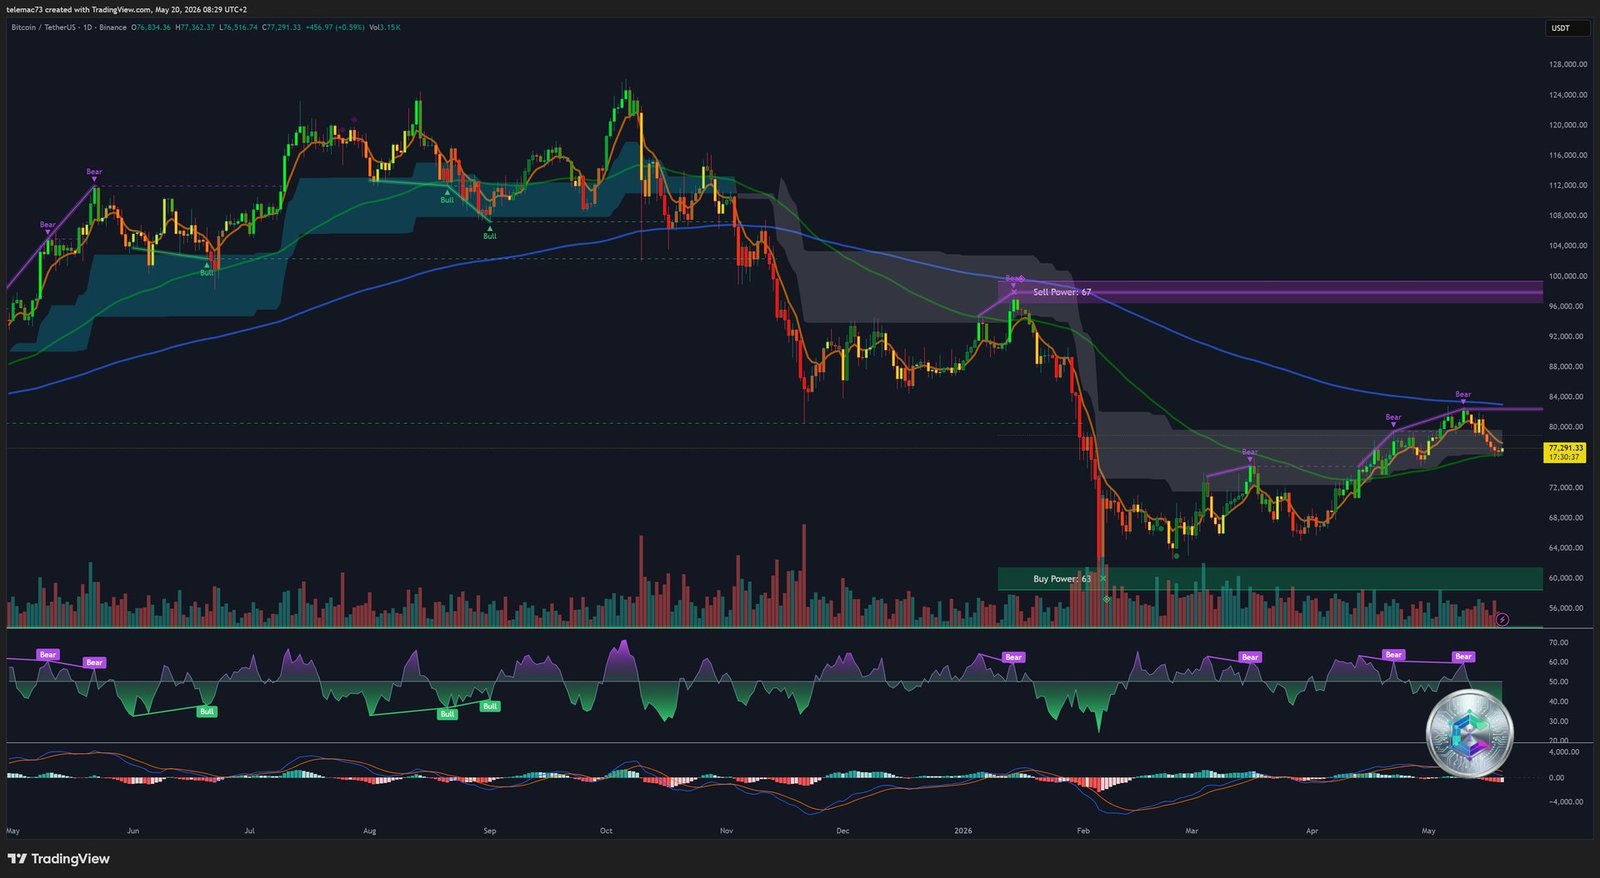
4.1 Daily Chart (1D): The Existential Neckline
The current price of $77,291 is performing a perilous retest of the neckline of the double-bottom (« W ») pattern formed between March and April, bounded between $75,800 and $76,800. The stakes are existential for the macro bullish structure:
- ✅ If this support holds on daily close: the « W » pattern remains valid, projecting a theoretical target toward $97,835.
- ❌ If this support breaks on daily close: the prior bullish breakout becomes a devastating « bull trap, » with cascade risk toward the $68,000–$70,000 zone.
Daily indicators signal growing fragility: the MACD remains in negative territory (prior death cross, though histogram momentum is fading), the RSI oscillates around 45–50 with hidden bearish divergences on recent highs, and short-term moving averages have turned into dynamic resistances weighing on prices.
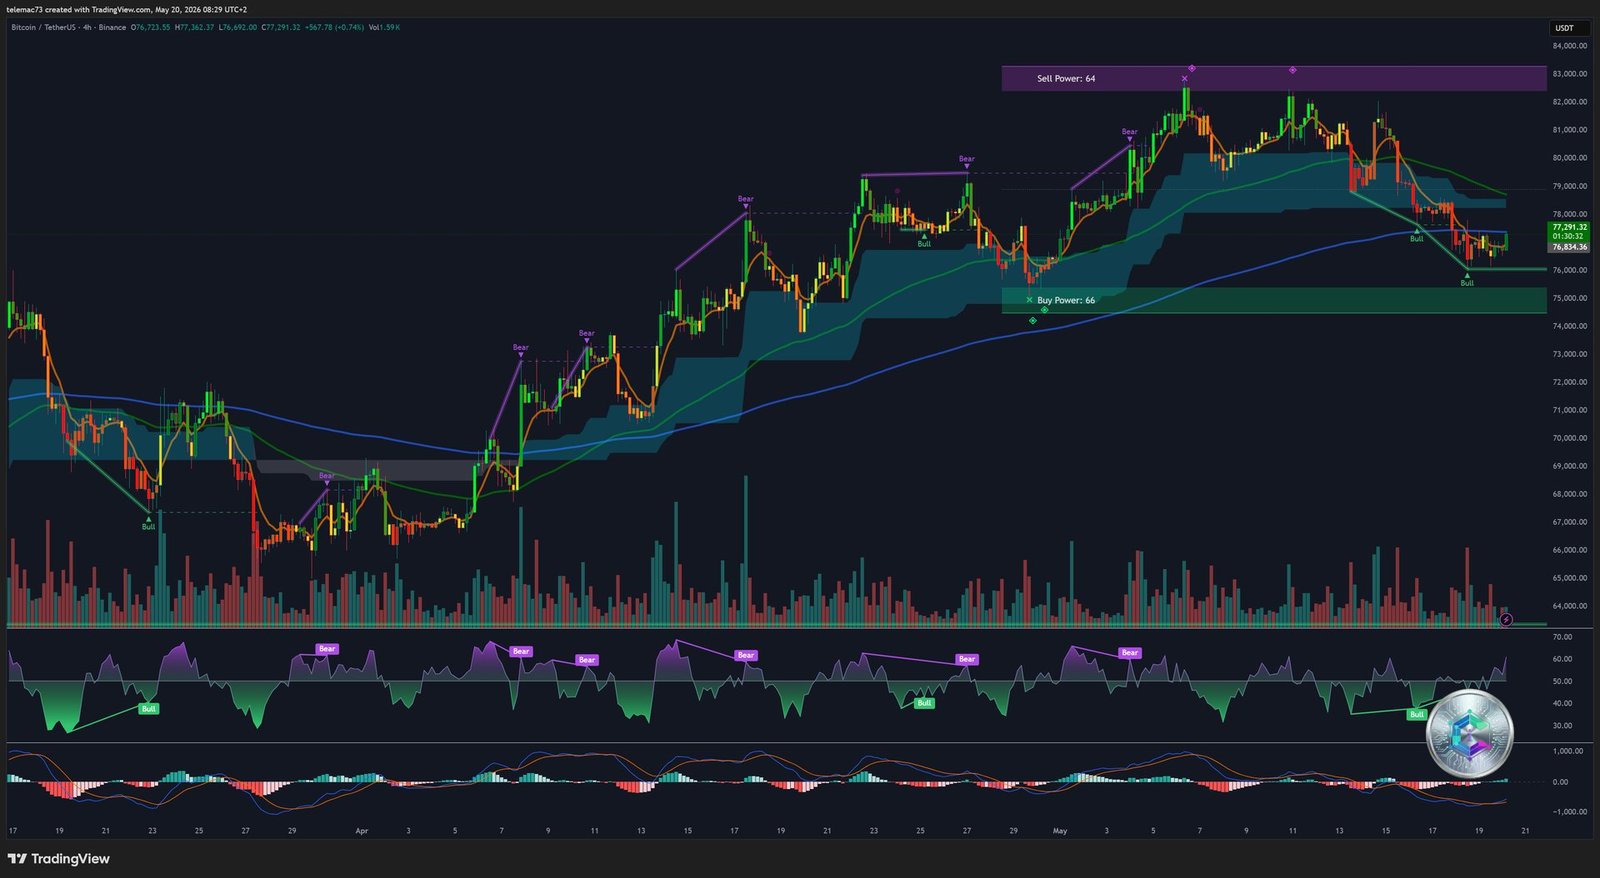
4.2 4-Hour Chart (4H): Bullish RSI Divergence Within a Bearish Channel
The 4H chart draws a clear sequence of lower highs / lower lows, characteristic of an intermediate bearish channel, dotted with algorithmic « Bear » markers throughout the decline. The most remarkable technical element is the bullish RSI divergence: while price printed a new local low, the RSI traced a higher trough — a classic signal of seller exhaustion that catalyzed the current technical bounce above $77,000.
However, the post-correction consolidation structure can be read as a bear flag — a continuation pattern — implying a statistically high probability of a downward resolution toward lower liquidity zones. Price is bouncing off the « Buy Power » zone ($74,000–$75,000) while remaining capped beneath the « Sell Power » resistance block at $82,000–$83,000.
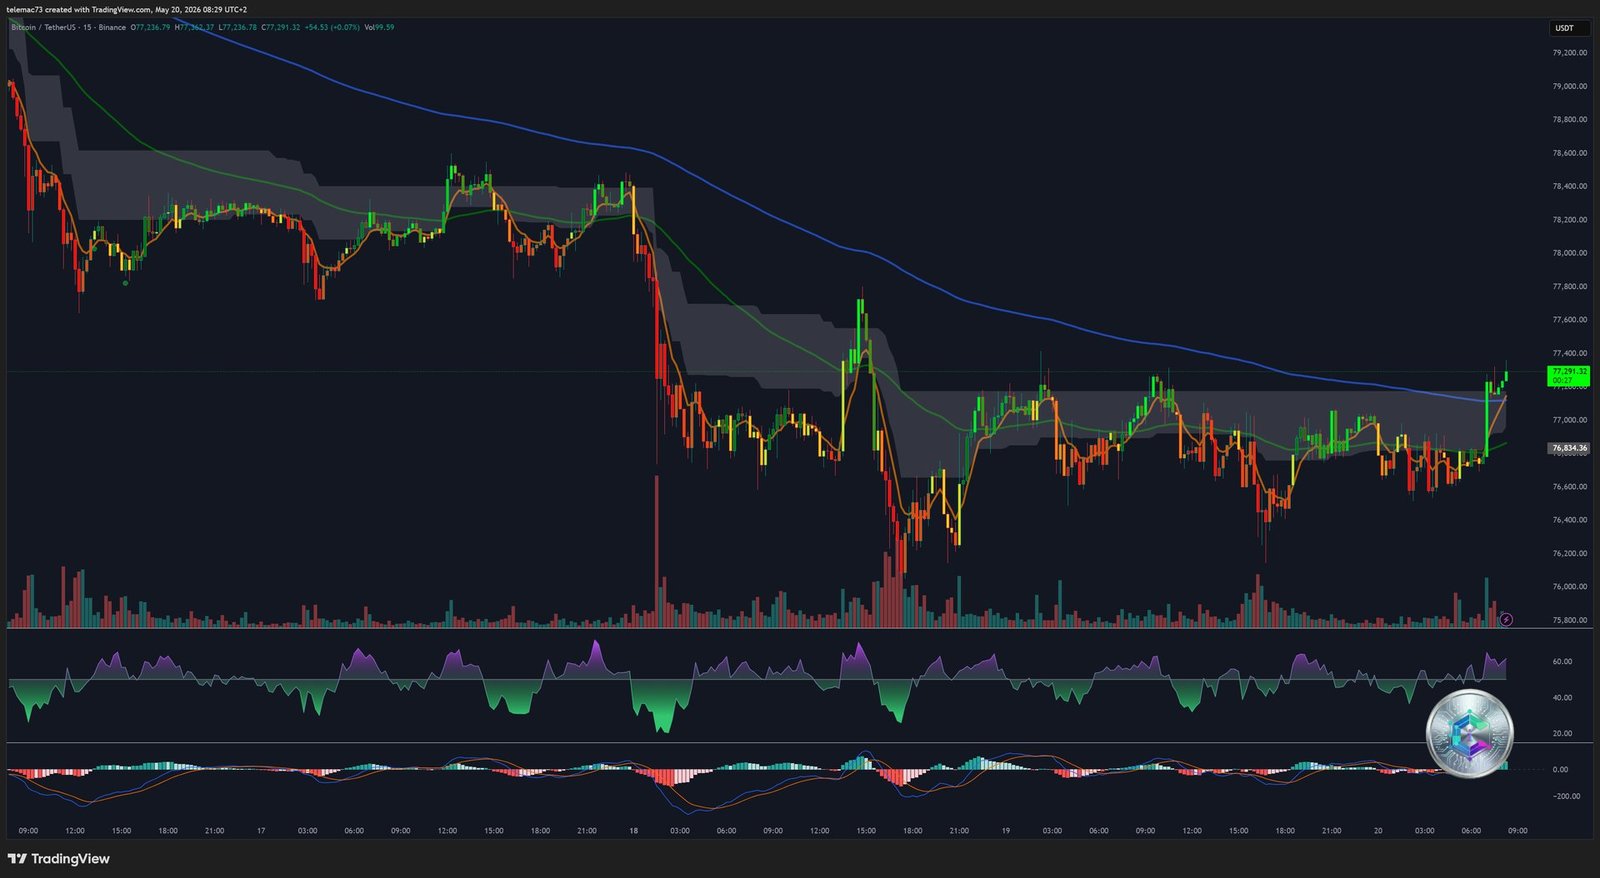
4.3 15-Minute Chart: Anatomy of the Intraday Capitulation
The 15-minute chart freezes the May 18 capitulation event and its aftermath: a sequence of massive red candles corresponding to $500 million in long positions liquidated in 15 minutes, as price broke below $77,800. This self-reinforcing long squeeze mechanism — each liquidation triggering market sell orders that push price lower, cascading into the next liquidation threshold — was a phenomenon of rare violence.
Following the free fall, volatility contracted into a compression triangle / pennant. Price is attempting to break upward through the descending EMA dynamic resistance, while the 15m RSI approaches overbought territory — a factor likely to limit the immediate bounce extension without a consolidation phase first.
5. Strategic Outlook and Conclusion
The synergistic integration of macroeconomic variables, institutional flows, and technical structure reveals an extreme polarization in the Bitcoin market this May 2026:
- 📉 Structurally fragile short term: Toxic macro environment (inflation ~4%, rates locked, Nasdaq correlation 0.96), technical structure under pressure (bearish channel, potential bear flag, neckline retest), systemic threat of $11 billion in liquidations below $70,000.
- 📈 Resolutely bullish long term: Historic CLARITY Act, relentless BlackRock and MicroStrategy accumulation, imminent US Strategic Reserve, Iranian sovereign utility — the network’s fundamentals continue to strengthen independently of price volatility.
The gravitational mechanics of financial markets dictate that liquidity attracts price. The $68,000–$70,000 zone represents the true market magnet: the final purge of $11 billion in speculative positions, a wealth transfer from overleveraged retail traders to institutional strong hands (BlackRock, MicroStrategy, sovereign entities), and the construction of a healthy, organic support base for the next expansion cycle. Navigating this turbulent zone demands asymmetric, defensive risk management — while recognizing that this painful volatility is an integral part of Bitcoin’s final integration into the apex of the global financial architecture.
⚠️ Disclaimer: This article is written for educational and informational purposes only. It does not constitute investment advice, a recommendation to buy or sell any financial asset, or personalized financial counsel. All cryptocurrency investments carry significant risks, including the potential for total loss of capital. Please consult a qualified financial advisor before making any investment decisions.