
As of April 19, 2026, Bitcoin (BTC) stands at a rare strategic crossroads. The asset is trading around $75,451–$75,697, consolidating in a narrow range following aggressive rejections at higher levels. The total cryptocurrency market capitalization stands at a staggering $2.64 trillion, with daily trading volumes exceeding $95 billion — and yet, the Fear & Greed Index lingers at 27, signaling persistent Extreme Fear for more than 46 consecutive days.
This cognitive dissonance between prices near historically significant levels and deeply pessimistic market sentiment reveals a profound structural mutation: the market is no longer driven by retail euphoria, but by the methodical, cold, and calculated accumulation of institutional entities. This report provides a complete dissection of Bitcoin’s price action through multi-timeframe chart analysis, order book liquidity mapping, and an in-depth macroeconomic assessment.
Macroeconomic and Geopolitical Context
The Geopolitical Shock: The « Islamabad Resistance »
The recent collapse of U.S.–Iran peace talks held in Islamabad triggered what quantitative analysts call a « geopolitical flush. » Financial markets immediately repriced the risk premium (Peace Premium), sending shockwaves across risk assets and cryptocurrencies. Technically, this event materialized as an extremely aggressive rejection in the supply zone between $73,100 and $74,000 — now dubbed the « Islamabad Resistance » by market operators.
This bearish move acted as a liquidity sweep mechanism, ruthlessly clearing highly leveraged long positions that had anticipated a peace deal, forcing the price to plunge toward the critical support at $71,724 before recovering. While Bitcoin is often touted as a decorrelated safe-haven, this reaction demonstrates that during an acute liquidity shock, correlation with risk assets tends toward 1 — before the asset’s intrinsic scarcity properties reassert themselves.
Federal Reserve Monetary Policy and Structural Tailwind
The Federal Reserve currently holds rates in the 3.50%–3.75% range, adopting a strategic wait-and-see posture amid persistent inflationary signals. All institutional eyes are on the next FOMC meeting scheduled for April 29, 2026. Major investment banks including UBS are projecting cumulative rate cuts of 50 basis points by year-end 2026, a monetary pivot that represents a massive fundamental tailwind for Bitcoin.
Leading economic voices — including former Fed Chair Janet Yellen — have publicly raised the specter of dollar hyperinflation, a feared consequence of abyssal fiscal deficits and sovereign debt accumulation. These statements institutionalize Bitcoin’s narrative as the ultimate insurance policy against fiat currency debasement, reinforcing its long-term value proposition.
Regulatory Asymmetry: Europe vs. the United States
The regulatory landscape reveals a sharp divide between jurisdictions. In Europe, the scandal surrounding Zondacrypto — a major Polish exchange accused by the Prime Minister of directly interfering with legislative processes — is fueling investor distrust and raising fears of drastic regulatory retaliation at the EU level. In contrast, the U.S. appears to be progressing toward structural legislative clarity. The SEC’s roundtable on the « CLARITY Act » (April 16, 2026) is seen as a potential watershed moment — a favorable resolution could unlock trillions of dollars in dormant institutional capital from pension funds and university endowments waiting for an unimpeachable legal framework.
Post-Halving Institutional Absorption
Bitcoin’s 2026 price action is fundamentally disconnected from previous cycles due to the impact of spot ETFs. The supply shock initiated by the fourth halving (April 19, 2024, reducing issuance to 3.125 BTC per block) is now felt with maximum acuity. Annual network inflation is firmly below 1%, with only ~1.32 million BTC remaining to be mined. Against this inelastic supply, institutional demand is enormous: spot Bitcoin ETFs recorded net inflows of $18.7 billion in Q1 2026. BlackRock’s IBIT fund holds over 773,000 BTC, absorbing $284 million in a single day in mid-April. Miners produce roughly $40 million in BTC per day — ETFs routinely absorb multiples of that amount, creating a structural imbalance that mechanically forces long-term price appreciation.
Multi-Timeframe Chart Analysis
📅 Daily Timeframe: Macroscopic Resilience and Mixed Signals
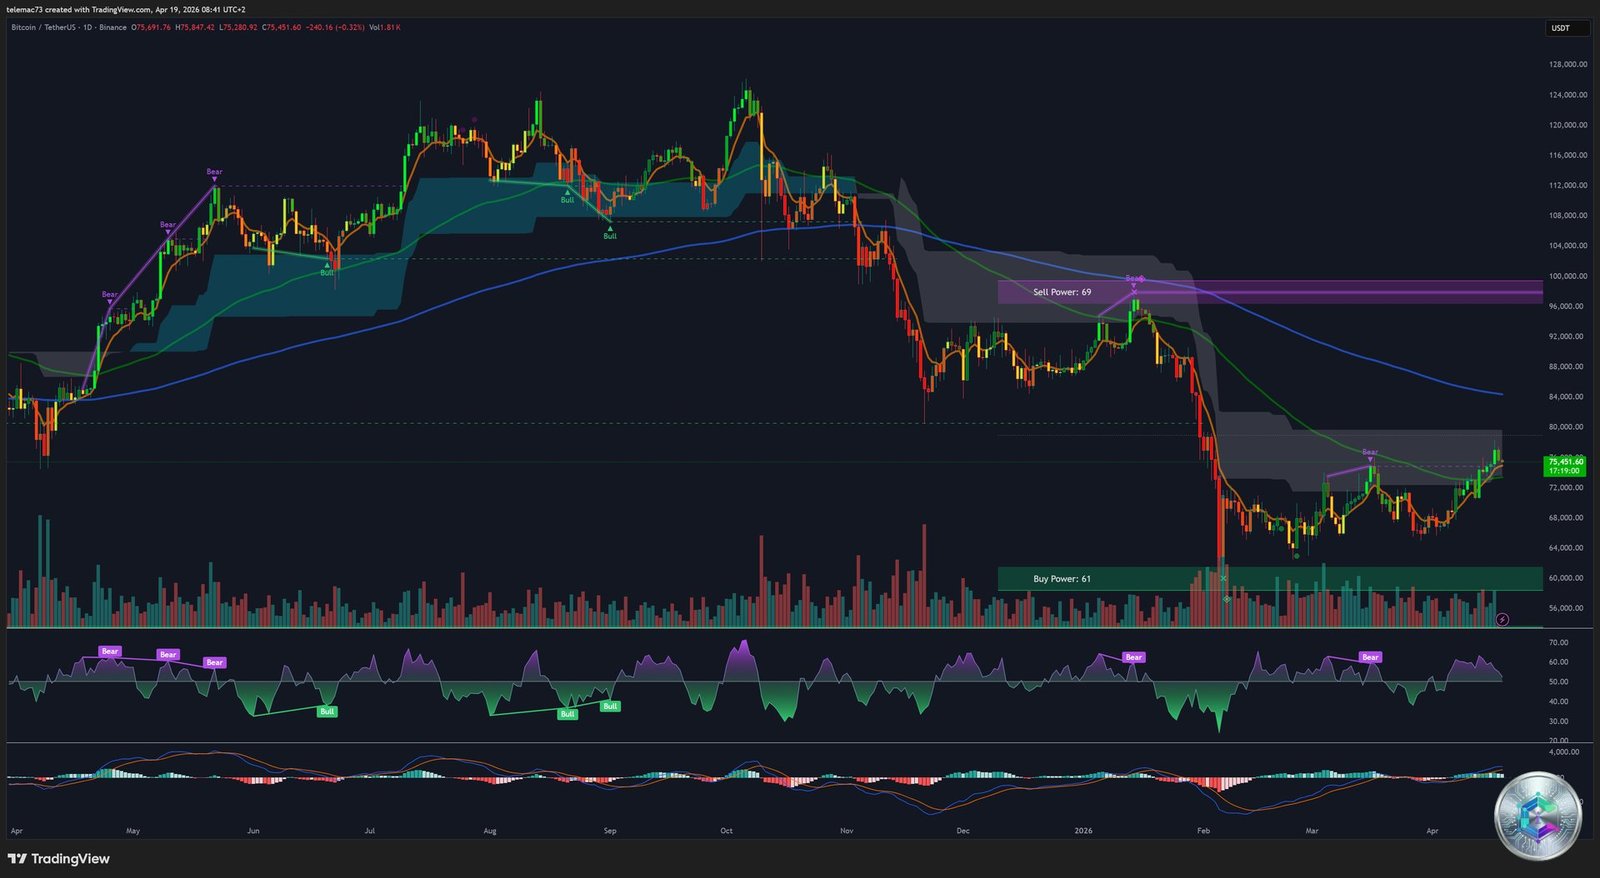
The daily chart provides the essential macroscopic context. After a spectacular decline from peaks above $100,000, Bitcoin found an absolute support floor in the $60,000–$64,000 zone. The subsequent recovery takes the form of a U-shape recovery, characteristic of methodical institutional accumulation rather than a speculative V-shaped bounce. The « Buy Power » (61) vs. « Sell Power » (69), while slightly unfavorable, sees selling pressure absorbed by massive passive buy orders.
The daily MACD displays a golden cross — one of the most reliable trend reversal signals in classical technical analysis — with expanding green histograms confirming macroscopic bullish momentum. Simultaneously, the RSI hovers around 50–55, showing no overbought condition, leaving considerable upside potential. However, a bearish triple-top divergence is beginning to form on the RSI, creating a conflict with the MACD’s golden cross that defines the complexity of the current consolidation regime.
⏱️ 4-Hour Timeframe: Compression and Contradictory Signals
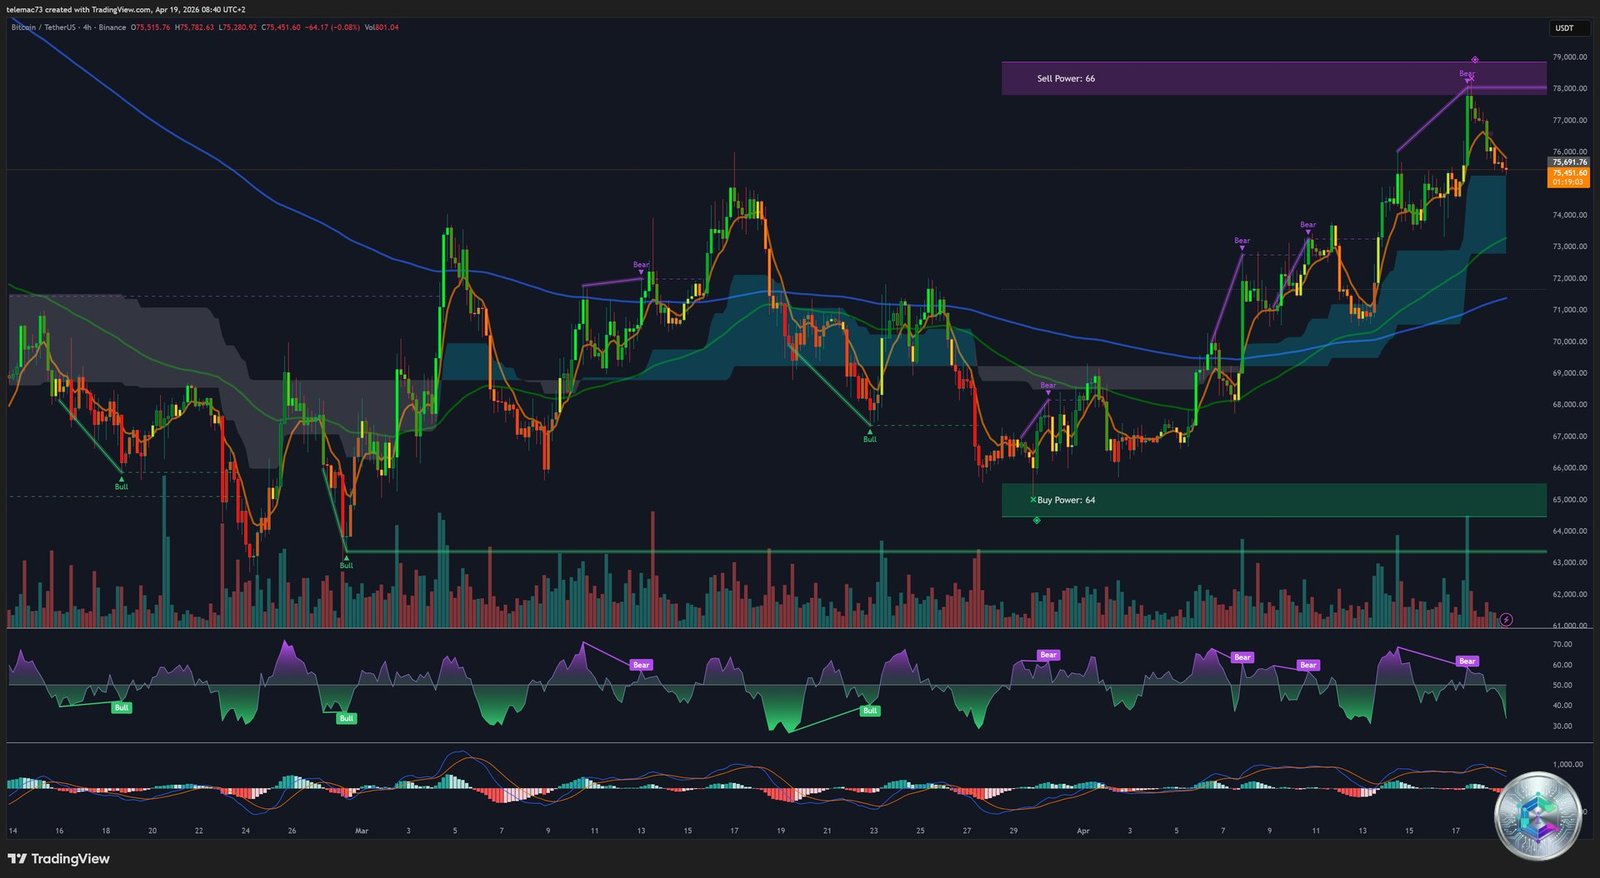
Zooming into the 4H chart, the temporal resolution highlights the fierce battle unfolding around the $75,451 pivot. Price action is locked within a hybrid pattern: an ascending channel exhausting itself into an asymmetric compression triangle. After an aggressive push toward $78,000, the price suffered a sharp rejection validated by a purple bearish signal printed exactly at the local top — directly corroborating the macro impact of the geopolitical flush. Sell Power (66) vs. Buy Power (64) reflects a precarious balance and palpable directional hesitation.
The 4H MACD shows a death cross — the inverted mirror of the daily chart — with bright red histograms confirming that bearish momentum controls the short-term microstructure. However, the contraction of the last red bars toward the zero line signals exhaustion of selling pressure against a wall of buyers. The RSI, having brushed oversold territory (30), attempts to bounce from the 40–45 zone after successive bear flags purged excess bullish leverage. An impulsive resolution of this compression is becoming increasingly likely — the abnormally low daily amplitude of 0.55% is the telltale sign.
⚡ 15-Minute Timeframe: Micro-Liquidity and Inflection Points
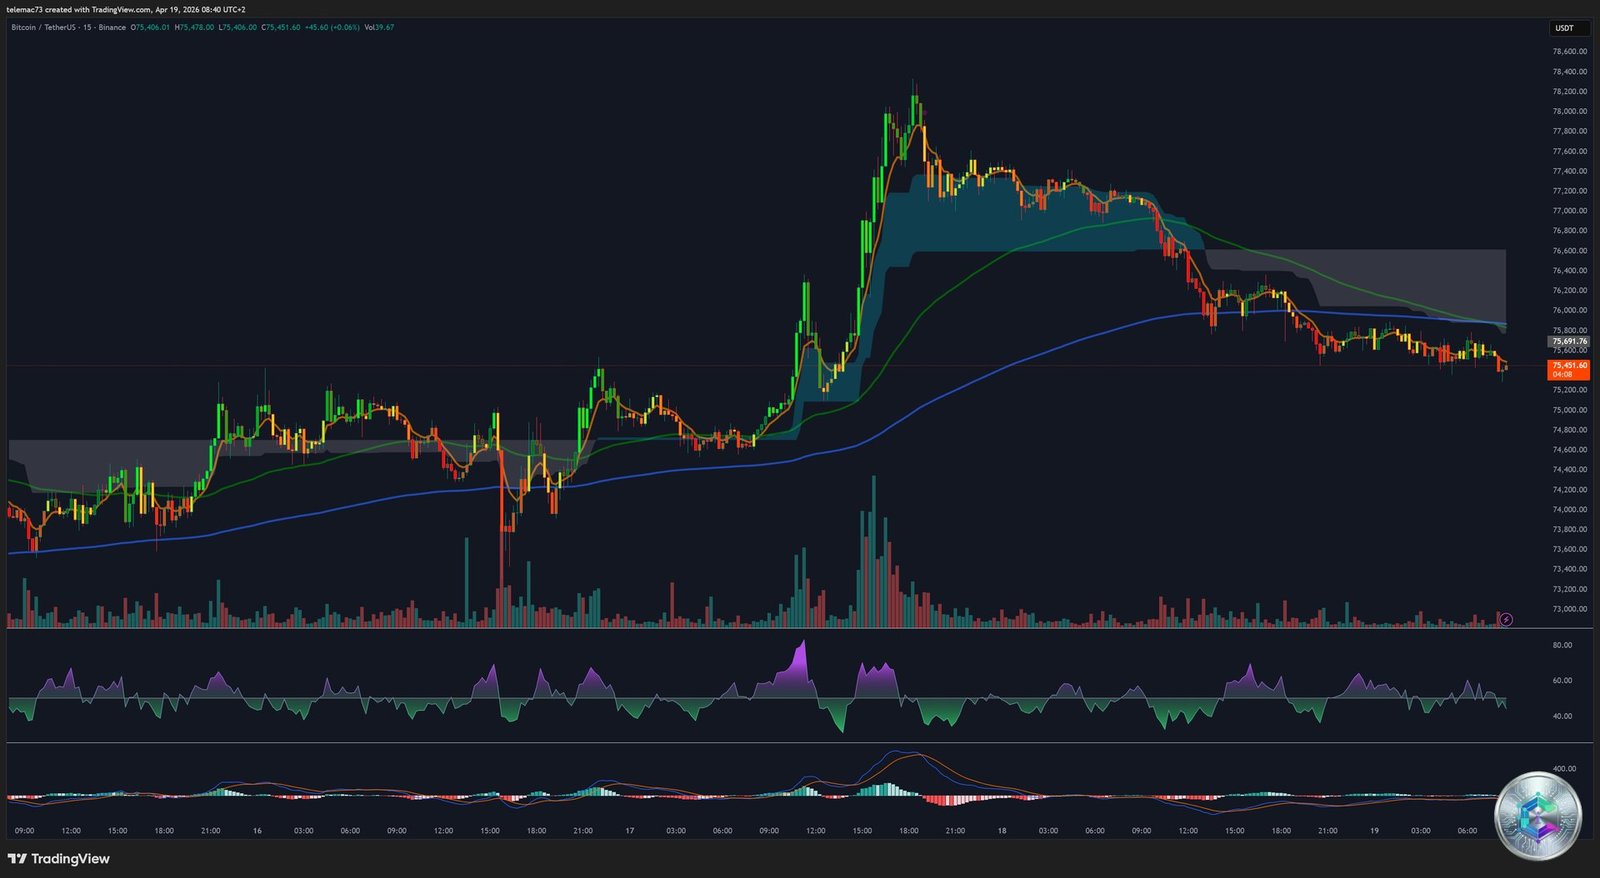
The 15-minute chart reveals high-frequency algorithmic behavior. Current price action follows a rapid bearish cascade from the $77,000 region, leaving long dominant red candles characteristic of cascading long liquidations (long squeeze). The initial drop phase was accompanied by massive volume spikes, signaling temporary algorithmic capitulation. Price then stabilized in a narrow rectangular formation — either an intraday bear flag or an accumulation zone — with volume drying up sharply, confirming an exhaustion of immediate directional interest.
Momentum signals on this ultra-short timeframe are particularly compelling: the 15M MACD has just validated a golden cross, with emerging green histograms signaling a very short-term momentum reversal in favor of buyers. The RSI, after plunging below 30 (extreme oversold zone), has re-entered the 50 level. This conjunction of a bouncing oversold RSI and a bullish MACD crossover on the 15M — contrasting with the bearish 4H MACD — creates complex fractality: the market is likely structuring a technical relief rally within the broader 4H consolidation.
Liquidity Heatmap: X-Ray of the Order Book
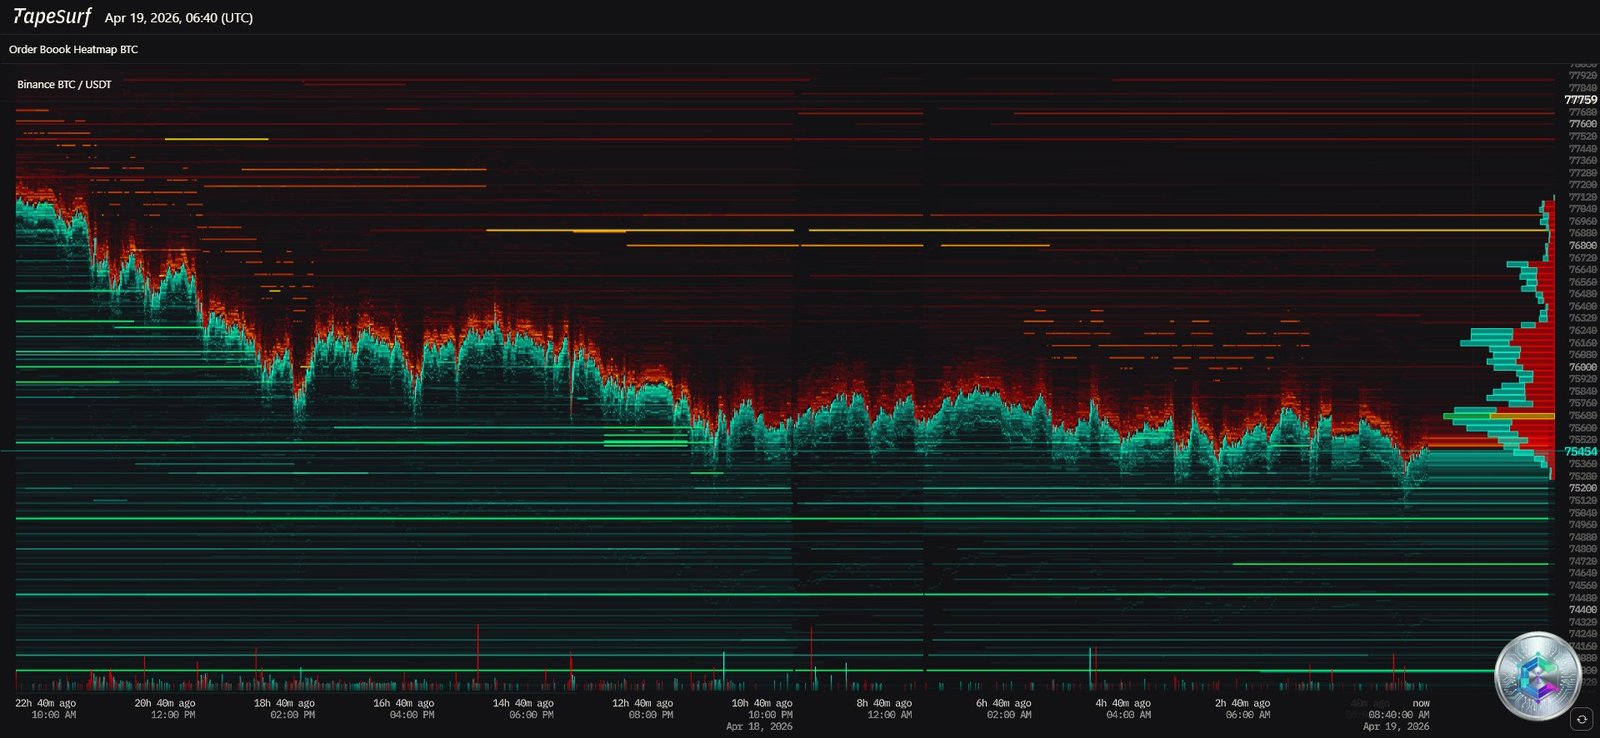
The TapeSurf heatmap provides a spatio-temporal X-ray of Binance’s BTC/USDT order book. The interpretation is unambiguous: intense red bands between $76,000 and $77,900 represent a colossal institutional sell wall — this is precisely why successive rejections appear on the 4H chart, as market buy momentum systematically crashes into this illiquid supply. Conversely, bright green bands below the current price — at $74,500, $74,000, extending down to the psychological $70,000 level — confirm the presence of massive passive buy orders and active institutional accumulation (buy the dip).
Historical heatmap analysis also reveals spoofing phenomena (order book manipulation), but the dense zones around $76,000 (resistance) and $74,000 (support) are persistent, defining the true boundaries of the current battlefield. The price compression between these two liquidity masses (coiling) justifies the low daily amplitude. Once either wall is consumed, the adjacent liquidity void will trigger a violent directional expansion.
Advanced Metrics and Key Signals
- Golden Cross Daily / Death Cross 4H: The temporal divergence between the structural daily MACD golden cross (above EMA 50d at ~$69,725 and EMA 200d at ~$71,500) and the 4H death cross perfectly encapsulates the tug-of-war between the bullish macro trend and short-term selling pressure.
- Intraday RSI & MFI-14: The 15M RSI touched extreme oversold floors (20–30), fueling the current bounce. On the macroscopic level, the Money Flow Index (MFI-14) prints an extraordinary reading of 79.00, flirting with the overbought threshold (80). If price breaks resistance while MFI crosses 80, a bullish algorithmic feedback loop (momentum chasing) could be triggered.
- Negative Funding Rate: The perpetual contract funding rate is slightly negative (-0.0008%), a telling anomaly in a bullish market: short-term consensus is overly bearish, creating the perfect architecture for a forced short seller liquidation (short squeeze).
Key Price Level Matrices
🔴 Resistances and Upside Targets
| Level | Price (USD) | Justification |
|---|---|---|
| Macroscopic Resistance | $80,000 – $80,600 | Major confluence zone, institutional breakout psychological threshold, long-term channel target |
| Breakout Target | $77,500 – $77,600 | Immediate post-breakout target, volume profile acceleration zone |
| Heatmap Sell Wall | $76,000 – $76,950 | Extremely dense red band on TapeSurf, primary mechanical barrier capping current rallies |
| Critical Bullish Trigger | $76,016 | A strict daily close above this price invalidates the 4H corrective structure and reactivates the macro bull cycle |
| Immediate Ceiling / R1 | $75,000 – $75,396 | Former support turned dynamic resistance, aligned with classic R1 pivot ($74,501) |
🟢 Supports and Demand Zones
| Level | Price (USD) | Justification |
|---|---|---|
| Heatmap Support | $74,000 – $74,500 | Intense green bands on TapeSurf, active presence of passive buyers underpinning current consolidation |
| Inflection Point | $73,100 – $73,492 | Recent floor, former « Islamabad Resistance, » now converted into a polarized support by price action |
| Fibonacci 38.2% Zone | $71,745 – $71,780 | Retracement level of the recovery move, capitulation point of geopolitical flush liquidations |
| Central Pivot Point (PP) | $69,758 | Mathematical market equilibrium: (High + Low + Close) / 3 |
| Vital Structural Support | $69,000 – $70,500 | Massive confluence: EMA 50 days + absolute institutional defense psychological threshold |
| Macroscopic Floor | $62,872 | 52-week low — a close below this level would be a catastrophic invalidation of any bullish thesis |
Strategic Scenarios – April/May 2026
🟢 Bull Case — Short Squeeze and Volatility Expansion
This scenario hinges on an upside resolution of the 4H compression triangle. The fuel is microstructural: the negative funding rate and BlackRock’s daily ETF absorption (+$284M) create a supply deficit. A positive exogenous catalyst — a constructive CLARITY Act outcome or a dovish Fed tone on April 29 — would force short sellers to cover their positions in a cascade (short squeeze). Breaking the $76,016 trigger would propel price toward the $77,600 breakout target, and then the $80,000 macroscopic ceiling within 10–14 days. In this dynamic, Bitcoin would be mathematically positioned to enter the global Top 10 assets by market capitalization.
🟡 Base Case — Exhausting Sideways Consolidation
The most likely short-term hypothesis is the continuation of the war of attrition between institutional accumulation and retail macroeconomic apprehension. Price would remain confined between $74,000 (heatmap support) and $76,000 (heatmap resistance), with the daily RSI divergence dissipating through time correction rather than price correction. Macroeconomic data releases (U.S. CPI, FOMC decision) would act as the ultimate trend arbiter.
🔴 Bear Case — Deep Correction and Invalidation
This asymmetric risk scenario rests on deteriorating geopolitical dynamics or inflationary data forcing the Fed to maintain a « higher-for-longer » stance with no hope of 2026 rate cuts. Technically, a definitive rejection below the 4H dynamic moving average and an inability to hold above the $73,100 support would validate the bearish flag structures, triggering a stop-loss cascade to the $71,780 high-volatility Fibonacci zone. The ultimate threat: a daily close below $70,000, breaking the EMA 50 days and opening the path toward an extended retest of the $60,000 zone.
Final Synthesis
Bitcoin in April 2026 embodies the perfect tension between absolute post-halving mathematical scarcity and unprecedented institutional absorption on one side, and persistent geopolitical and macroeconomic anxiety on the other. The monumental resistance and support forces act like tectonic plates — the next rupture of either will determine the trajectory for the weeks ahead.
For market operators, execution discipline is paramount: preserving the support structure above $70,500 guarantees the validity of the secular bullish narrative. The anticipated breakout above $76,016 will be the definitive confirmation that the market has digested the turbulence and is poised to begin the final expansion phase toward six-figure territory, reshaping the global financial hierarchy of the decade.
⚠️ Important Disclaimer: This article is written strictly for educational and informational purposes. It does not constitute financial, investment, or purchasing advice of any kind. Cryptocurrency markets are extremely volatile and carry significant risk of capital loss. Any investment decision should be made in consultation with a qualified financial advisor and in accordance with your personal risk profile. Cryptoinfo.ch assumes no responsibility for decisions made on the basis of this article.