
On May 1st, 2026, Bitcoin (BTC) is trading in a range between $75,621 and $77,173, navigating an ecosystem at the confluence of contradictory macroeconomic forces, record institutional financialization, and a technically charged structure under extreme pressure. The crypto market’s benchmark asset recently tested the psychological threshold of $80,000 before pulling back under the weight of institutional profit-taking and a global reassessment of risk appetite. The total crypto market capitalization stands at approximately $2.57 trillion, demonstrating structural resilience despite significant headwinds. This analysis peels back every layer of this decisive market phase.
Macroeconomic Landscape: The Forces Governing Bitcoin
The Fed’s « Higher for Longer » Regime: A Structural Glass Ceiling
The defining event of the past week was the Federal Open Market Committee (FOMC) decision to hold its target rate in the 3.50%–3.75% range — the third consecutive meeting at this level. Yet the committee’s internal dynamics reveal emerging fractures: the vote concluded 11 to 1, with Governor Stephen Miran formally dissenting in favor of an immediate 25 basis point cut. Several regional Fed presidents resisted any language suggesting a dovish tilt, marking the highest level of FOMC dissent since 1992.
Jerome Powell justified the stance at his press conference by emphasizing persistently elevated inflation, partly exacerbated by the recent resurgence in global energy prices. For Bitcoin, this higher-for-longer rate regime acts as a structural brake: elevated capital costs mechanically compress the valuation of long-duration assets with no intrinsic cash flows. Until the Fed clearly signals a pivot toward balance sheet expansion or aggressive rate cuts, global liquidity will remain selective, constraining the conditions for parabolic Bitcoin rallies.
The « Fed Chair Curse »: An Underestimated Idiosyncratic Risk
Jerome Powell’s term expires on May 15, 2026. Markets are increasingly pricing in the probability of a Kevin Warsh nomination to succeed him. Paradoxically, despite Warsh having publicly praised Bitcoin as an « important asset, » this leadership transition is being interpreted as a near-term bearish event. The empirical track record is damning:
- 2014 (Yellen inauguration): Severe bear market, BTC collapsed 86%.
- 2018 (Powell takes office): ICO bubble burst, BTC fell 74%.
- 2022 (Powell second term): Systemic collapse, BTC dropped 60%.
With rates held at 3.50% and only one modest cut anticipated for the rest of 2026, the macroeconomic environment the next Fed chair will inherit is exceptionally precarious. Structural headwinds risk neutralizing any personal sympathy the incoming president might hold toward crypto innovation.
Geopolitical Escalation and Energy Shock
Escalating tensions in the Middle East, particularly the specter of disruptions to maritime traffic through the Strait of Hormuz, are injecting a significant risk premium into crude oil prices, feeding inflation and retroactively validating the Fed’s caution. In this context, Bitcoin is behaving less like « digital gold » than like a high-beta tech asset: when global stability deteriorates rapidly, institutional portfolio managers liquidate their most volatile holdings first.
| Macroeconomic Vector | Current State (May 2026) | BTC Impact |
|---|---|---|
| Fed Rate Policy (FOMC) | Held at 3.50%–3.75% | 🔴 Negative — high opportunity cost |
| Fed Leadership Transition | Powell tenure ending imminently | 🔴 Negative — uncertainty, « historical curse » |
| Geopolitical Tensions | Escalating (Middle East, Hormuz) | 🔴 Negative — global risk aversion |
| Energy Prices | Upward trending | 🔴 Negative — reinforces « higher-for-longer » |
Institutional Dynamics: The ETF Flow Dichotomy of April
April’s Hyper-Accumulation: An Asymmetric Demand Shock
Over the full month of April 2026, U.S. spot Bitcoin ETFs recorded net inflows of $2.44 billion — the strongest monthly performance of the year, nearly double March’s $1.32 billion. These flows pushed cumulative AUM to an all-time high of approximately $102 billion, with total inflows since inception surpassing $58.5 billion.
The architecture of this accumulation is heavily concentrated. BlackRock’s iShares Bitcoin Trust (IBIT) captured over 70% of April’s total inflows, bringing its inventory to between 809,000 and 812,000 BTC (roughly $62 billion). Fidelity’s Wise Origin Bitcoin Fund (FBTC) strung together nine consecutive days of positive inflows, totaling over $2.1 billion. The mathematical implication is profound: daily institutional demand substantially exceeded the inelastic supply of newly mined BTC, creating a scarcity shock that drove Bitcoin up nearly 16% in April to challenge the $80,000 resistance.
The Tactical Reversal: End-of-Month Deleveraging
The apparent resilience of these flows was violently tested in the final days of the month. Directly correlated with anxiety surrounding the FOMC decision, Bitcoin ETFs suffered three consecutive days of capital hemorrhage, totaling $490 million in net outflows in less than 72 hours.
- Monday, April 27: Net outflow of $263.2M — the heaviest single-day withdrawal of the week.
- Tuesday, April 28: An additional $89.7M withdrawn.
- Wednesday, April 29 (FOMC day): A further $137.6M fled the market.
This dynamic must be interpreted not as a structural abandonment of the asset class, but as irrefutable proof of Bitcoin’s financialization: portfolio managers and hedge funds now use Bitcoin ETFs as liquid instruments to adjust their global risk profile in near real-time in response to fluctuations in the U.S. rate curve.
| Spot Bitcoin ETF | April Net Inflows | Outflows (Apr 27–29) | AUM (End of April) |
|---|---|---|---|
| BlackRock (IBIT) | > $2.1B | – $166.9M | ~$62B |
| Fidelity (FBTC) | > $2.1B | – $191.5M | Strong #2 position |
| Ark Invest (ARKB) | Positive for month | – $73.3M | Consolidated data |
| Grayscale (GBTC) | Ongoing outflows | – (Part of $960M YTD) | Contracting |
| TOTAL MARKET | + $2.44B | – $490.5M | ~$102B |
Microstructure & Liquidity: Reading the Order Book Heatmap
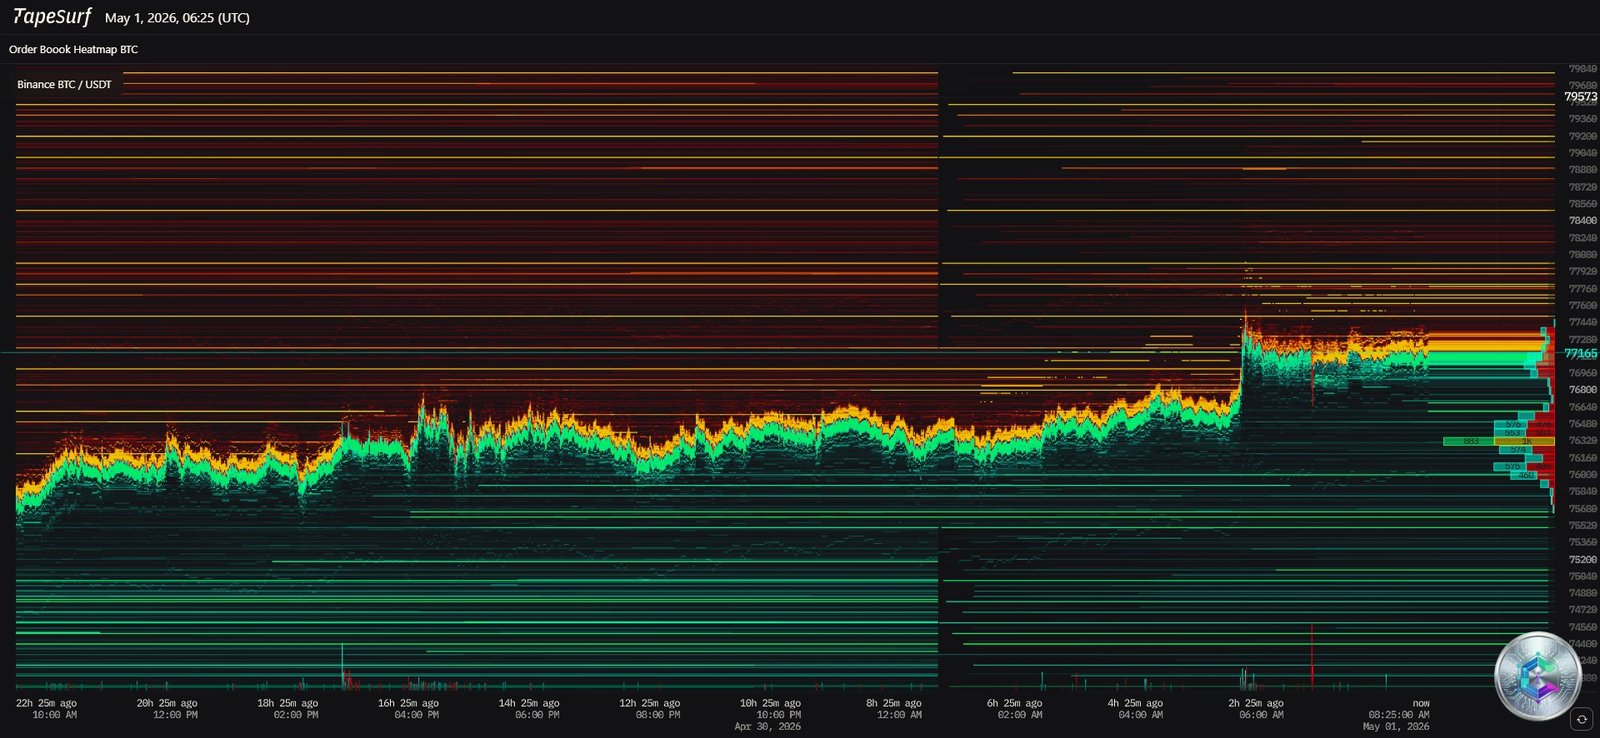
The TapeSurf heatmap provides a real-time X-ray of limit order distribution within Binance’s BTC/USDT order book. The color coding indicates liquidity intensity: red/orange for extreme concentrations, green/teal for significant concentrations, and dark zones for low liquidity.
The Upper Resistance Wall ($78,000–$80,000)
Above the current price, the $78,000–$80,000 zone is saturated with intense scarlet and orange horizontal strata, reflecting the colossal presence of sell walls. Every bullish incursion is systematically absorbed by the execution of these limit orders. However, there is a crucial flip side: heavily leveraged short positions have placed their stop-losses beyond this wall. A decisive breakout above $80,000 would trigger a catastrophic short squeeze, forcing the liquidation of these positions in a self-reinforcing spiral of forced buying.
The Lower Demand Buffer ($74,000–$76,000)
Below the current price, the heatmap reveals multiple continuous horizontal green and teal bands, ranging from $76,000 down to a massive block anchored around $74,000. The robustness of these buy walls reflects strong conviction from market makers and whales in the value of these levels. The $74,000 zone is particularly critical: it represents the invalidation floor of the current bullish narrative.
This topography was stress-tested during the recent liquidation event: approximately $492 million in over-leveraged positions were wiped out within 24–48 hours, with BTC alone accounting for over $140 million. The green demand zones absorbed the shock and held.
Daily Chart (1D) Analysis: The Geometry of Compression
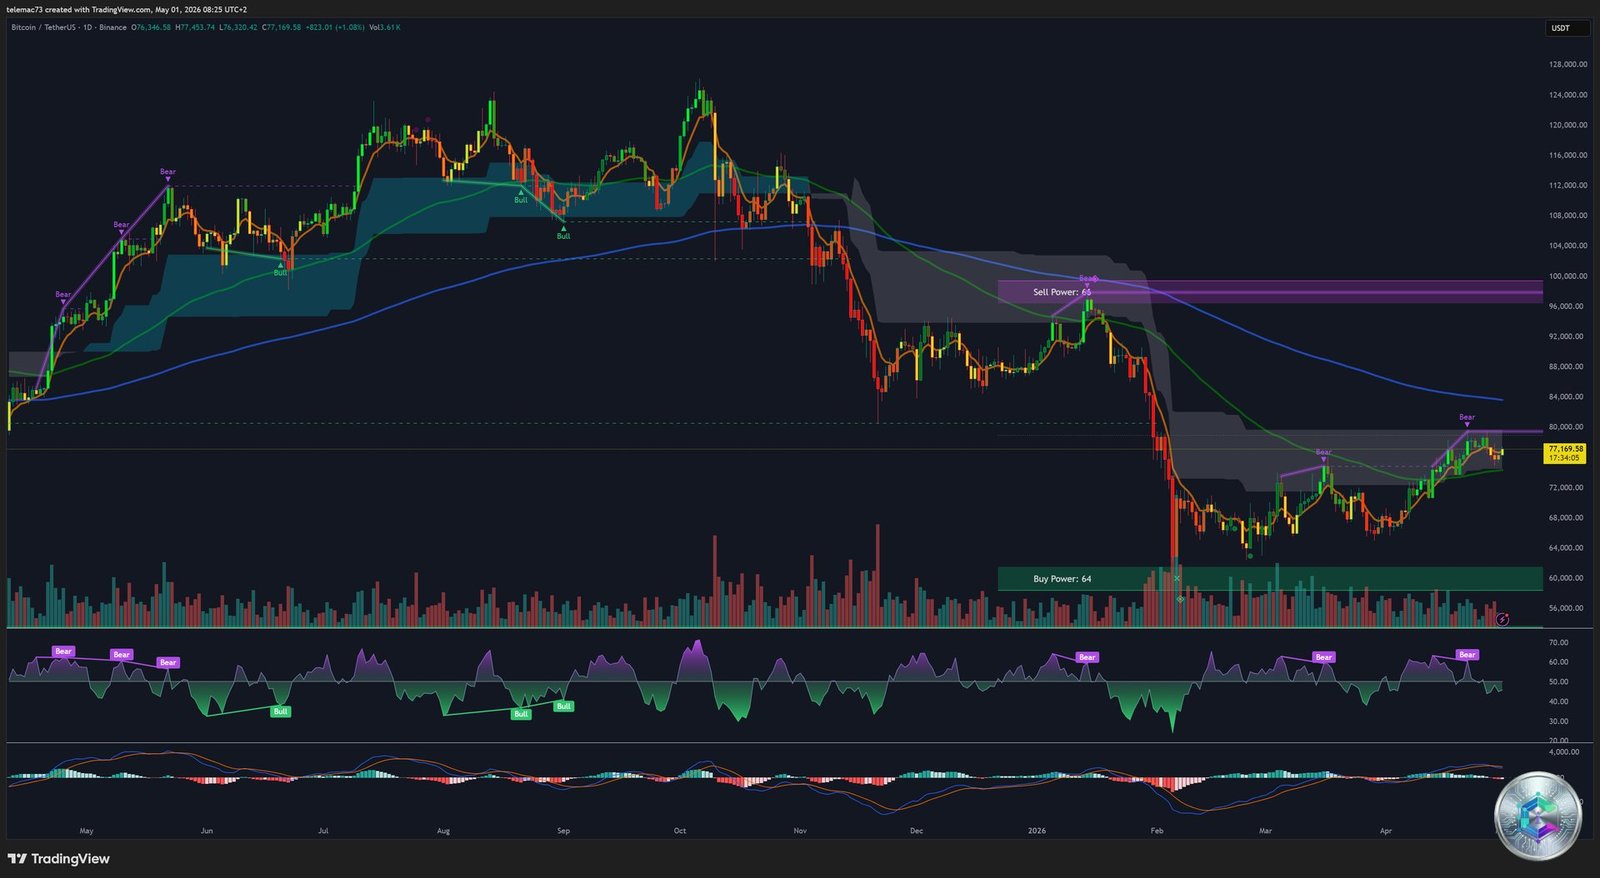
The daily timeframe filters out intraday noise to reveal the primary architecture of crowd psychology and institutional capital positioning. Following a parabolic ascent toward $80,000, the market has entered a consolidation phase whose geometry is highly instructive.
Power Zones and Key Levels
- Upper Resistance (~$79,500–$80,000): Institutional « Sell Power » zone. Repeated failures to post a decisive daily close above this level confirm latent supply ready to distribute into any rally.
- Central Pivot ($74,000): A former resistance level that has undergone a classic support/resistance flip. Its preservation is imperative for the integrity of the current bullish trend — the absolute technical line of demarcation.
- Deep Strategic Support ($60,000–$64,000): Foundational « Buy Power » zone and the ultimate capitulation point in the event of a macroeconomic meltdown.
Two Competing Chart Patterns, One Common Signal
1. The Bull Flag: The massive impulse wave toward $80,000 forms the flagpole. The slow, choppy, slightly descending correction that follows forms the flag itself. This configuration carries an estimated bullish resolution rate of approximately 68% according to empirical studies. A breakout of the upper oblique resistance with strong volume expansion would theoretically project the price toward new price discovery highs.
2. The Symmetrical/Ascending Compression Triangle: A descending trendline drawn from the major tops converges with a series of successively higher lows. The amplitude of oscillations is inexorably narrowing, compressing the market’s kinetic energy. Historically, such compression precedes a move of extreme violence — the direction depending on which side exhausts its liquidity first.
Daily Oscillators: A Warning Signal
The derived indicators temper structural optimism. The daily RSI is navigating neutral territory (50–60) but reveals a classic bearish divergence: while price recorded new local highs, the oscillator failed to confirm them — a mathematical anomaly that perfectly foreshadowed the current stagnation. The daily MACD is similarly flat, with its histogram oscillating around zero, signaling deep directional indecision among long-term investors.
| Indicator (1D) | Observed Configuration | Interpretation |
|---|---|---|
| Price Action | Triangle / Bull Flag | Indecision preceding strong expansion |
| RSI (14) | Neutral, post-bearish divergence | Overbought purge completed |
| MACD | Flat histogram, entangled lines | No dominant directional momentum |
| Key Levels | Support: $74K / Resistance: $80K | Institutional accumulation/distribution range |
4-Hour Chart (H4) Analysis: Intermediate-Term Mechanics
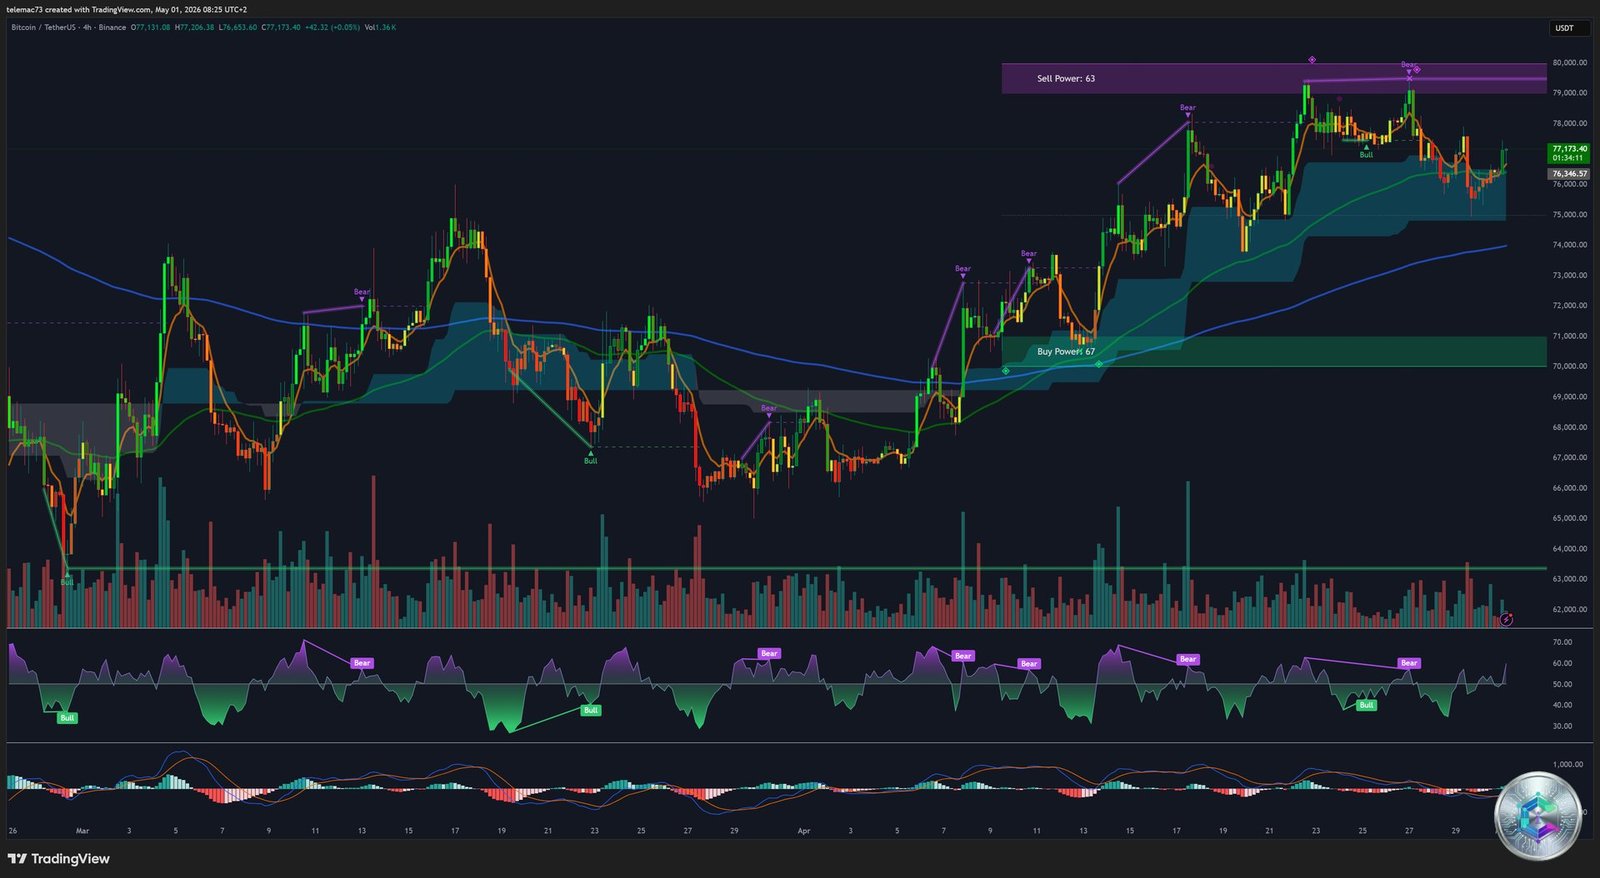
Zooming into the 4-hour chart reveals the oscillatory mechanics favored by arbitrage funds and swing traders for calibrating tactical exposures. Bitcoin, quoting at $77,173, is trading within a broad but choppy ascending channel.
H4 Liquidity Architecture
- Overhead Resistance ($79,000–$80,000): A thick band has systematically capped each bullish impulse. « Bear » labels applied to price peaks underline each breakout failure.
- Structural Floor (~$70,000): A green support zone representing the foundation of the current uptrend. Untested recently, it serves as a reminder of the deep liquidity cushion underpinning the asset.
- Moving Averages: Despite surface volatility, the intermediate trend structure remains bullish — the slow long-term moving average acts as a dynamic ascending support from below.
H4 Oscillator Warning Signals
MACD Death Cross: The MACD line has just crossed down through its signal line, while the histogram turns red and expands. This signal indicates an immediate deceleration in price momentum — sellers are momentarily taking control of market tempo.
RSI Cycle and Divergences: The oscillator is rolling over from an overbought peak (fast RSI reading at 78.3, stochastics topping out above 90). « Bear » labels appear with troubling regularity at oscillator peaks, having accurately preceded recent local corrections. This dynamic suggests that further decompression is mathematically probable before a sustainable new assault on the highs is viable.
15-Minute Chart (M15) Analysis: Intraday Microstructure
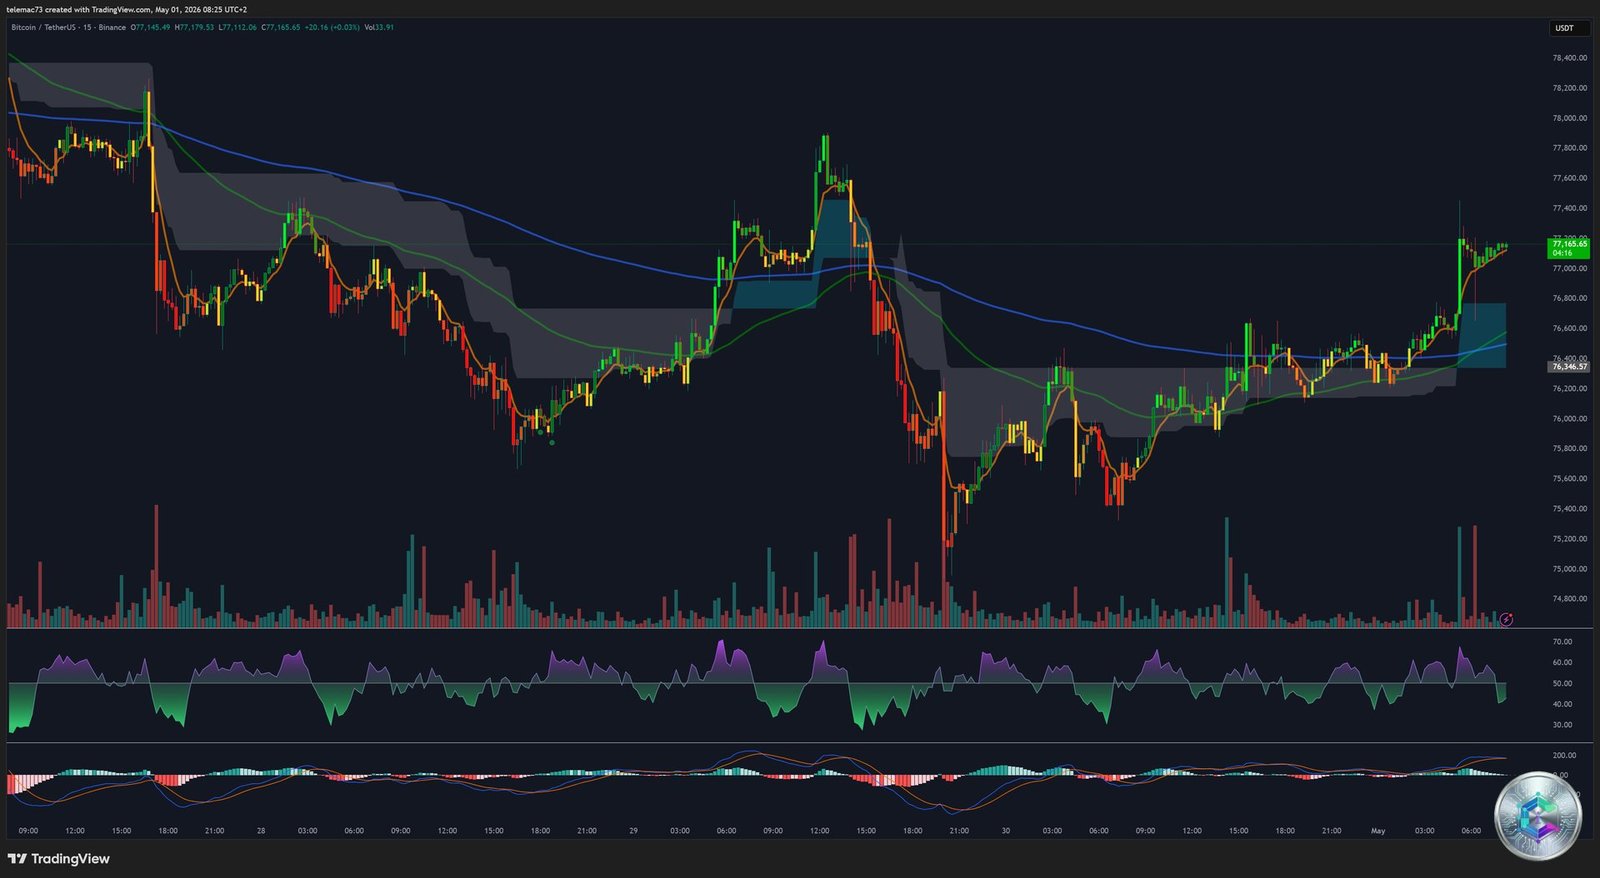
The 15-minute chart is the arena of high-frequency algorithms, liquidity hunts, and instantaneous reactions to news flow. The displayed price of $77,165 reflects the close of a tumultuous session.
The V-Shape Recovery: Proof of Buyer Resilience
Price action on M15 documents a sudden vertical collapse with a spectacular volume expansion (large red and green histogram bars), immediately followed by a classic V-shape recovery. Aggressive sellers were instantly neutralized by a wave of massive buy orders, demonstrating buyer interest that is ready to step in at the first sign of a discount.
Intraday Technical Confirmations
- M15 Golden Cross: Following the rebound, the fast EMA (green line) has crossed above the slightly slower moving average — a miniature Golden Cross confirming that intraday momentum has definitively shifted back in favor of buyers.
- Bullish MACD M15: A deep bullish crossover below the zero line, with a rapidly expanding green histogram — a powerful positive divergence signaling a high probability of continued near-term recovery.
- Intraday RSI: Surging from extreme oversold territory toward the overbought threshold (>70), confirming directional strength while flagging the risk of a brief bull flag consolidation before continuation.
Critical Intraday Pivots
| M15 Horizon | Technical Observation | Tactical Implication |
|---|---|---|
| Price Profile | Drop then V-shape recovery | Rapid absorption, dip buyers present |
| Key Support | $75,888 (MA-50) | Line between recovery and capitulation |
| Target Resistance | $77,480 | Breakout = structural bullish validation |
| MACD | Bullish crossover, green histogram | Strong kinetic energy supporting recovery |
As long as 15-minute candles close above $75,888 (MA-50), the bullish structure remains intact. A bearish break of this pivot would open the trapdoor toward a test of the $75,000 psychological level. Conversely, a decisive breakout above the local resistance at $77,480 with volume expansion would validate a bullish resolution of the higher timeframe structures.
Probabilistic Synthesis: Three Strategic Scenarios
🟡 Base Scenario: Prolonged Congestion
The most robust hypothesis is an extended lateral consolidation. The FOMC shock and fears surrounding the Powell-to-Warsh transition impose a structural glass ceiling on risk assets, while the energy geopolitical crisis exacerbates risk aversion. Meanwhile, the institutional demand floor ($2.44B in net April inflows) remains colossal. This confrontation finds its geometric expression in the daily compression triangle: price will continue to oscillate erratically between $74,000 and $80,000 until one side exhausts its liquidity. The H4 oscillator fatigue demands precisely this lateralization period to purge the mathematical overheating from the prior ascent.
🔴 Bearish Scenario: Macro Capitulation
Should inflationary anxiety drive U.S. bond yields to new highs, the opportunity cost of holding BTC will intensify. Technically, this scenario activates with a failure to hold the $75,888 intraday pivot, leading to a breach below $75,000. The fatal trigger would be a confirmed daily close below $74,000, violating the bullish trend’s structural integrity and triggering a cascade of stop-losses on a scale far exceeding the recent $492M purge. The next demand zones sit at $67,000–$68,000, and in a systemic dislocation scenario, at the historical support of $60,000–$64,000.
🟢 Bullish Scenario: Liquidity Explosion and the Short Squeeze
The current compression structure contains the kinetic energy of a volatility time bomb. If an unexpected confluence of positive catalysts (diplomatic resolution calming oil prices, a frantic resumption of BlackRock and Fidelity ETF inflows) pushed price beyond the oblique compression ceiling with a volume expansion of 200–300%, the effect on sellers would be catastrophic. Breaking through $80,000 would trigger an apocalyptic short squeeze: a self-feeding spiral of forced buying, propelling Bitcoin beyond the gravitational pull of traditional valuation models and into new price discovery territory, with institutional maturation of the asset acting as an irresistible pro-cyclical accelerator.
Conclusion
Bitcoin on May 1, 2026, is an asset in a state of precarious equilibrium, caught between powerful macroeconomic headwinds — an intransigent Fed, an uncertain governance transition, persistent geopolitical tensions — and structurally robust institutional demand materialized by ETFs with record assets under management. The technical structure, a compression triangle against a backdrop of a bull flag, concentrates the energy of a market searching for its direction. Intermediate oscillators argue for additional digestion, while intraday microstructure confirms the presence of determined buyers on every dip. The resolution — in either direction — promises to be explosive.
⚠️ Disclaimer: This article is written exclusively for educational and informational purposes. It does not constitute investment advice, a recommendation to buy or sell digital assets, or any form of inducement to conduct financial transactions. Cryptocurrency markets are highly volatile and carry a risk of total loss of capital. Any investment decision should be made after consulting a qualified financial advisor and in consideration of your personal financial situation.