
On May 21, 2026, Bitcoin (BTC/USD) stands at a historic crossroads. After a vigorous rally that propelled prices to a local high of $82,847, the asset is now consolidating within an extreme compression zone between $76,000 and $78,000, with the spot price hovering around $77,928. This seemingly bearish phase conceals a fascinating dichotomy: on one side, clear short-term technical deterioration; on the other, an institutional accumulation of a stealth intensity rarely observed on modern financial markets.
Macro-Economic Environment: Rate Policy and Tech Correlation
Bitcoin’s valuation cannot be analyzed in isolation from the global macro-economic context. The Federal Reserve maintains a restrictive « higher for longer » stance, underpinned by a remarkably resilient labor market. Weekly jobless claims expected around 210,000 reflect a « low-hire, low-fire » dynamic — with the four-week moving average at 203,750, a historically low level that gives the Fed ample room to keep rates elevated. This macro pressure mechanically weighs on all risk assets, including cryptocurrencies.
| Macro Indicator (May 21, 2026) | Forecast | Potential Impact on BTC |
|---|---|---|
| Initial Jobless Claims | 210,000 | Tight labor market → hawkish Fed → downward pressure on BTC |
| Philadelphia Fed Manufacturing Index | 17.6 | Contraction → economic slowdown → potentially bullish if Fed considers rate cuts |
| Flash US Services PMI | 51.1 | Above 50 → service sector expansion → supports USD over BTC |
| Flash US Manufacturing PMI | 53.8 | Slight decline anticipated → possible economic « soft landing » |
A fundamental observation of May 2026 is the tight, statistically significant correlation between Bitcoin and the Nasdaq Composite. This behavioral evolution challenges BTC’s value proposition as a decorrelated safe-haven asset. Simultaneously, a massive sector rotation is underway: institutional capital is leaving Bitcoin to redeploy into artificial intelligence and semiconductor stocks, which are delivering exceptional returns. This crowding-out effect is a major explanatory factor behind BTC’s persistent weakness below $80,000.
The Regulatory Landscape: The Historic CLARITY Act Catalyst
May 2026 is shaping up as a potentially historic turning point for digital asset regulation in the United States. On May 14, 2026, the Senate Banking Committee voted in a bipartisan manner (15 to 9) to advance the Digital Asset Market Clarity Act (CLARITY Act). This vote constitutes the strongest and most constructive political signal ever sent by American lawmakers regarding the digital asset industry.
The cornerstone of the CLARITY Act lies in its resolution of the long-standing jurisdictional conflict between the SEC and the CFTC. Bitcoin, owing to its absolute decentralization, would be classified as a « digital commodity » under CFTC supervision — a fundamental distinction that opens the door to massive institutional adoption. Galaxy Digital now estimates the probability of passage at 75% for 2026, a dramatic upward revision. Section 401 of the bill would explicitly authorize national banks, bank holding companies, and credit unions to use blockchain for asset custody, payments, and OTC trading — potentially unlocking trillions of dollars from pension funds and corporate treasuries.
At the state level, South Carolina enacted law S.163 on May 19, 2026 (adopted 110-1), formally banning federal CBDCs, protecting Bitcoin mining, and establishing strict fiscal neutrality for crypto payments. Meanwhile, speculation intensifies around a federal Strategic Bitcoin Reserve: the U.S. government holds approximately 328,000 BTC (~$25 billion) from historical seizures, and a White House advisor announced « a major policy update in the coming weeks » regarding management of these sovereign assets.
On-Chain Dynamics: The Great Divergence
On-chain analysis reveals a striking dichotomy between apparent market sentiment and the actual behavior of major players. On one side, U.S. spot Bitcoin ETFs recorded $982 million in net outflows the previous week — BlackRock’s IBIT absorbing $448.3M in redemptions, followed by ARK & 21Shares ($109.6M). The third-largest weekly exodus of 2026. On the other side, institutional whales are silently accumulating at record levels, paying exorbitant premiums to prioritize large transactions outside public markets.
| On-Chain Metric (May 2026) | Value | Strategic Interpretation |
|---|---|---|
| Token Turnover Rate | 2.83% | ~97% of total supply is dormant. HODLers refuse to sell — ideal conditions for a supply shock. |
| Net Unrealized Profit/Loss (NUPL) | 0.29 | Early momentum-building phase, similar to late 2023 — no global capitulation. |
| 24h Liquidations (May 19) | $657M (89% longs) | Healthy purge of over-leveraged long positions — necessary to establish a solid local floor. |
| ETF Net Outflows (weekly) | -$982M | Institutional rotation toward tech/AI. 3rd largest weekly exodus of 2026. |
The Token Turnover Rate frozen at 2.83% is irrefutable proof of long-term holder conviction. Despite a 12% year-to-date decline and a ~38% pullback from the October 2025 all-time high, experienced HODLers refuse to capitulate. This structural illiquidity creates perfect conditions for a supply shock: at the slightest positive demand spark — such as CLARITY Act passage — the absence of sellers at current levels will propel prices exponentially upward, as thin ask-side liquidity cannot absorb sudden buying pressure.
Multi-Timeframe Technical Analysis
Order Book Heatmap: Liquidity Cartography
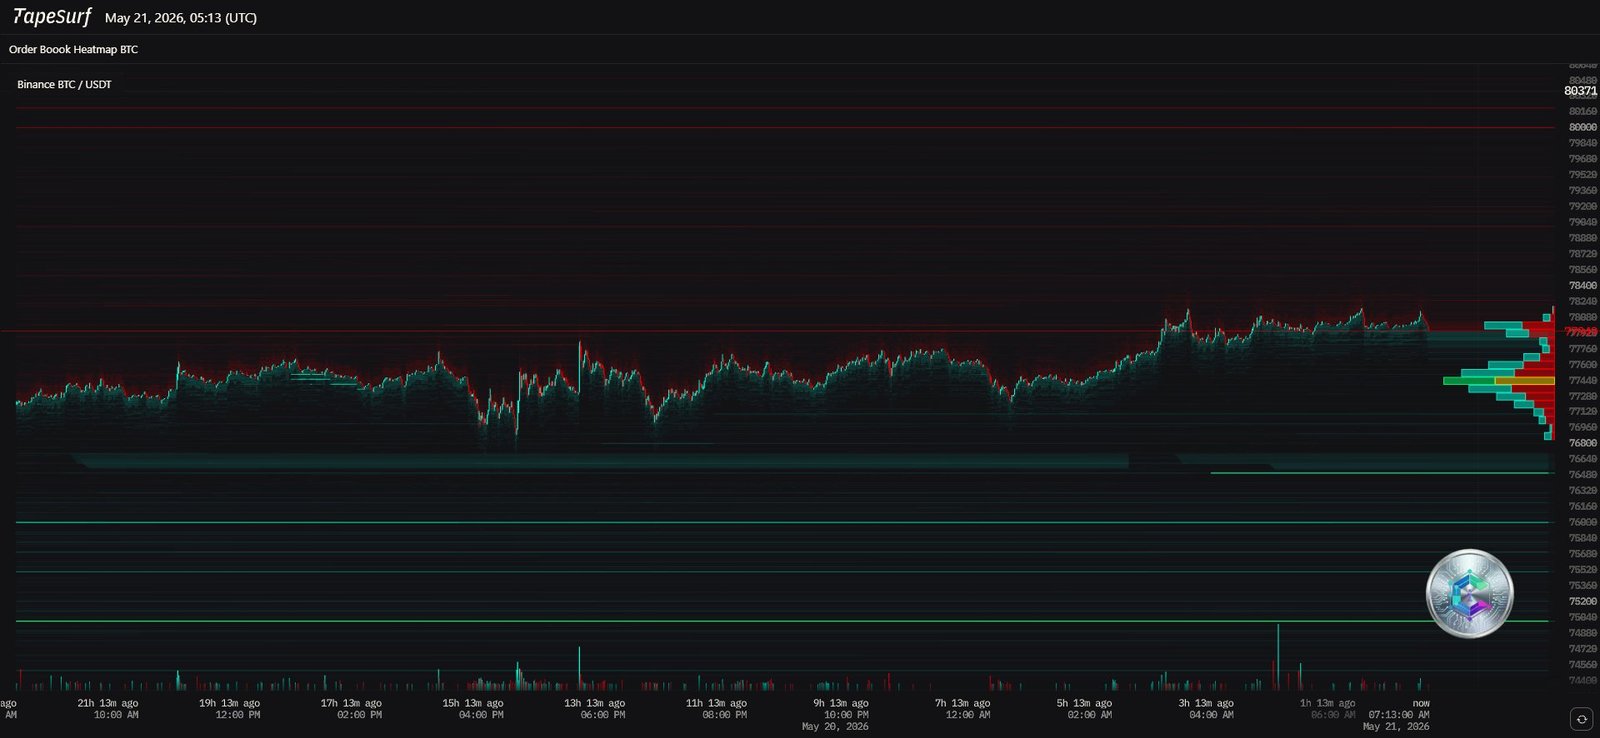
The liquidity heatmap reveals a critical asymmetry in the order book structure. A massive sell wall spanning $80,000 to $80,371 absorbs every rally attempt, acting as an impenetrable « glass ceiling. » Each approach triggers selling algorithms that generate the long upper wicks visible on daily candlesticks.
Below current price, institutional buyers have positioned their defensive clusters: a first line at $76,488 (recent low), then the true fortresses at $75,000 and $74,000, with an ultimate safety net at $70,000. A decisive daily close above $80,000 would force absorption of this sell wall, triggering a short squeeze propelling the asset toward $84,000–$85,500.
Daily Chart (1D): Rising Wedge and Macroscopic Warning Signals
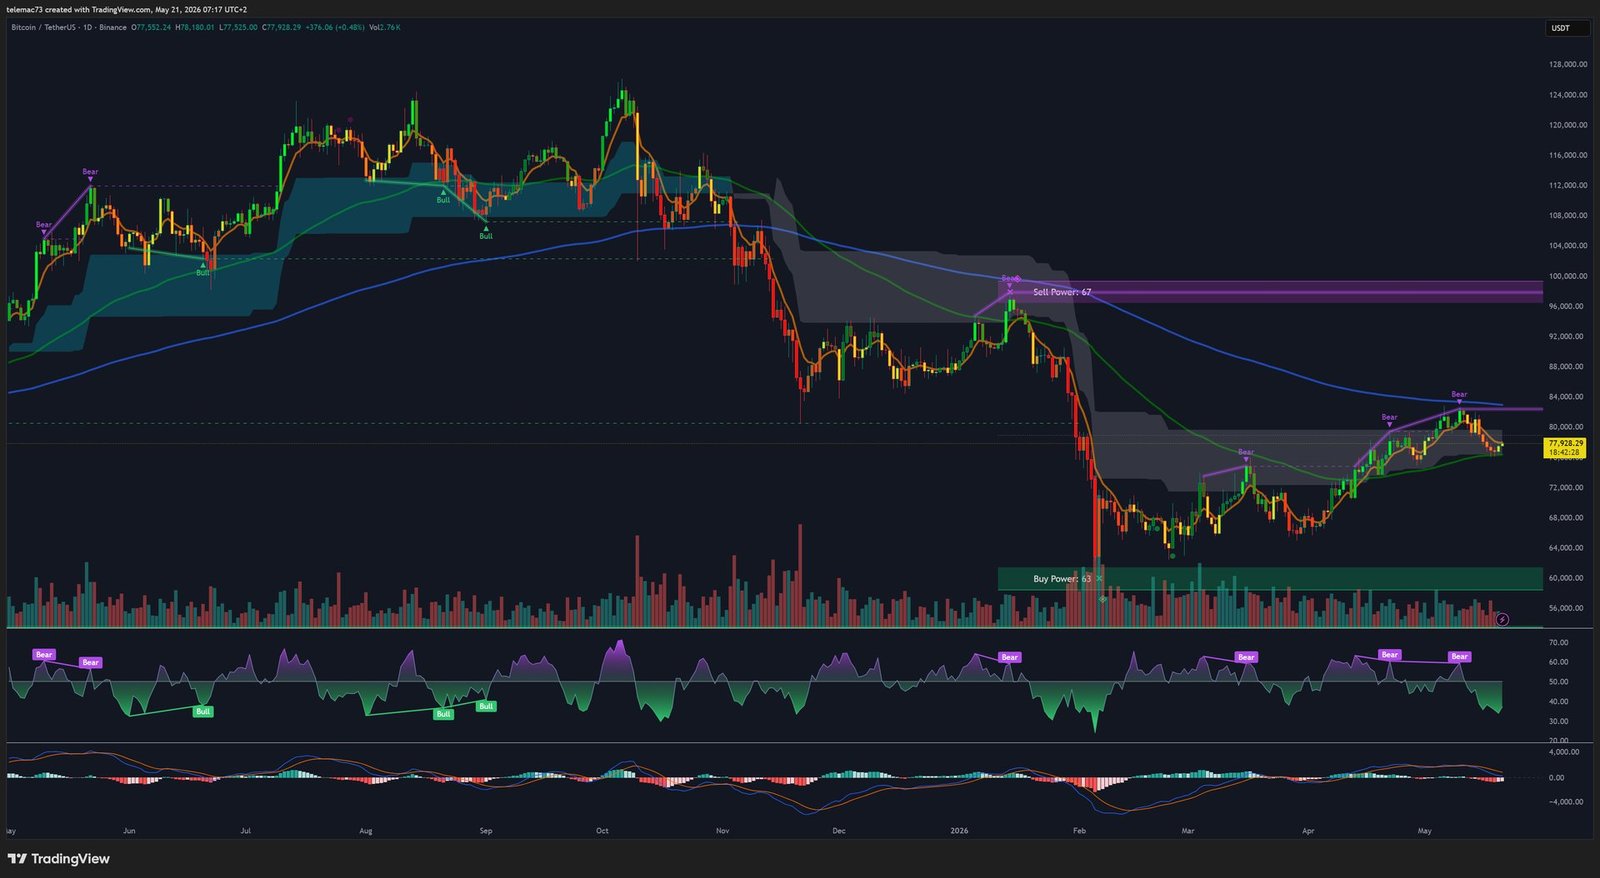
On the daily timeframe, the macroscopic price structure traces a broad Rising Wedge — a classic bearish reversal/continuation pattern in technical analysis, signaling progressive exhaustion of buying power. At $77,928, price struggles to maintain the 50 and 100-day EMAs. Warning signals are accumulating:
- Daily MACD: on the verge of validating a bearish Death Cross below the zero line, with histograms unable to generate sustained bullish momentum.
- Daily RSI: oscillating dangerously around the neutrality level of 50, printing descending highs (hidden bearish divergence) with recurring « Bear » tags at resistances.
- 200-day EMA at $72,035: the ultimate survival line of the secular bull market. As long as BTC trades above this level, Dow Theory maintains the long-term trend as bullish.
4-Hour Chart (4H): Distribution and Progressive Compression
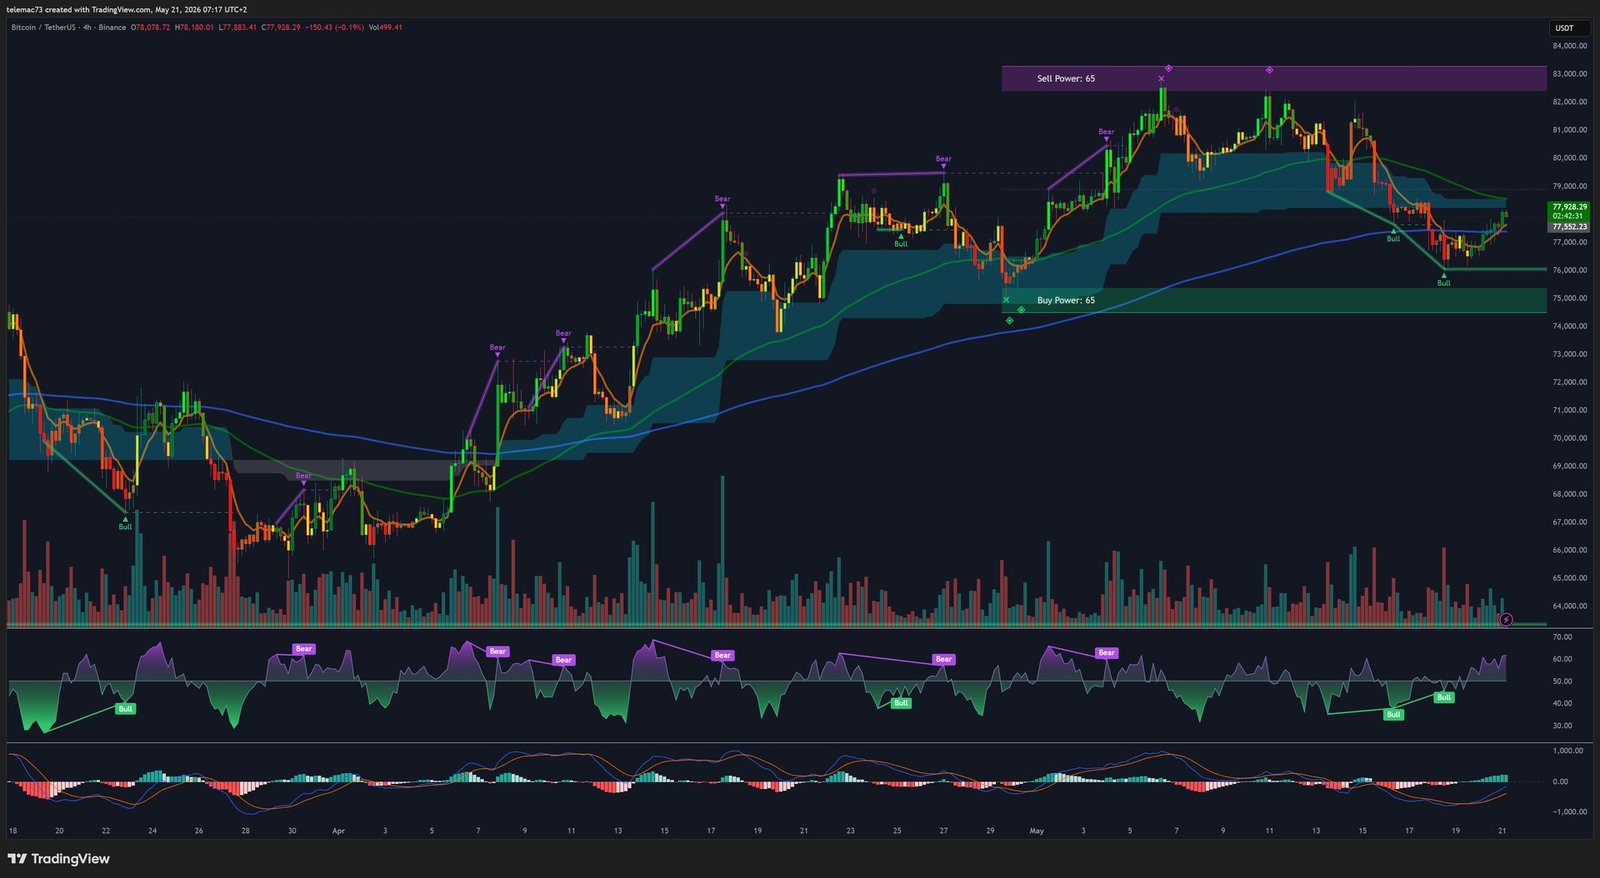
On the 4H timeframe — used by professional portfolio managers to calibrate execution timing — price is trapped between two major algorithmic zones: « Sell Power: 65 » above $82,000 and « Buy Power: 65 » around $74,000–$75,000. Price action is forming successive Bear Flags with anemic buying volume and descending highs (lower highs), classic distribution behavior.
The 4H MACD displays an already-expanding Death Cross, with red histograms elongating downward — a signal of accelerating selling pressure at medium-term horizon. A Fair Value Gap (FVG) identified just below $80,000 serves as the algorithmic priority target in case of a technical bounce, acting as a magnet for Smart Money algorithms per institutional theory.
15-Minute Chart (15m): Capitulation and Micro-Structural Rebound
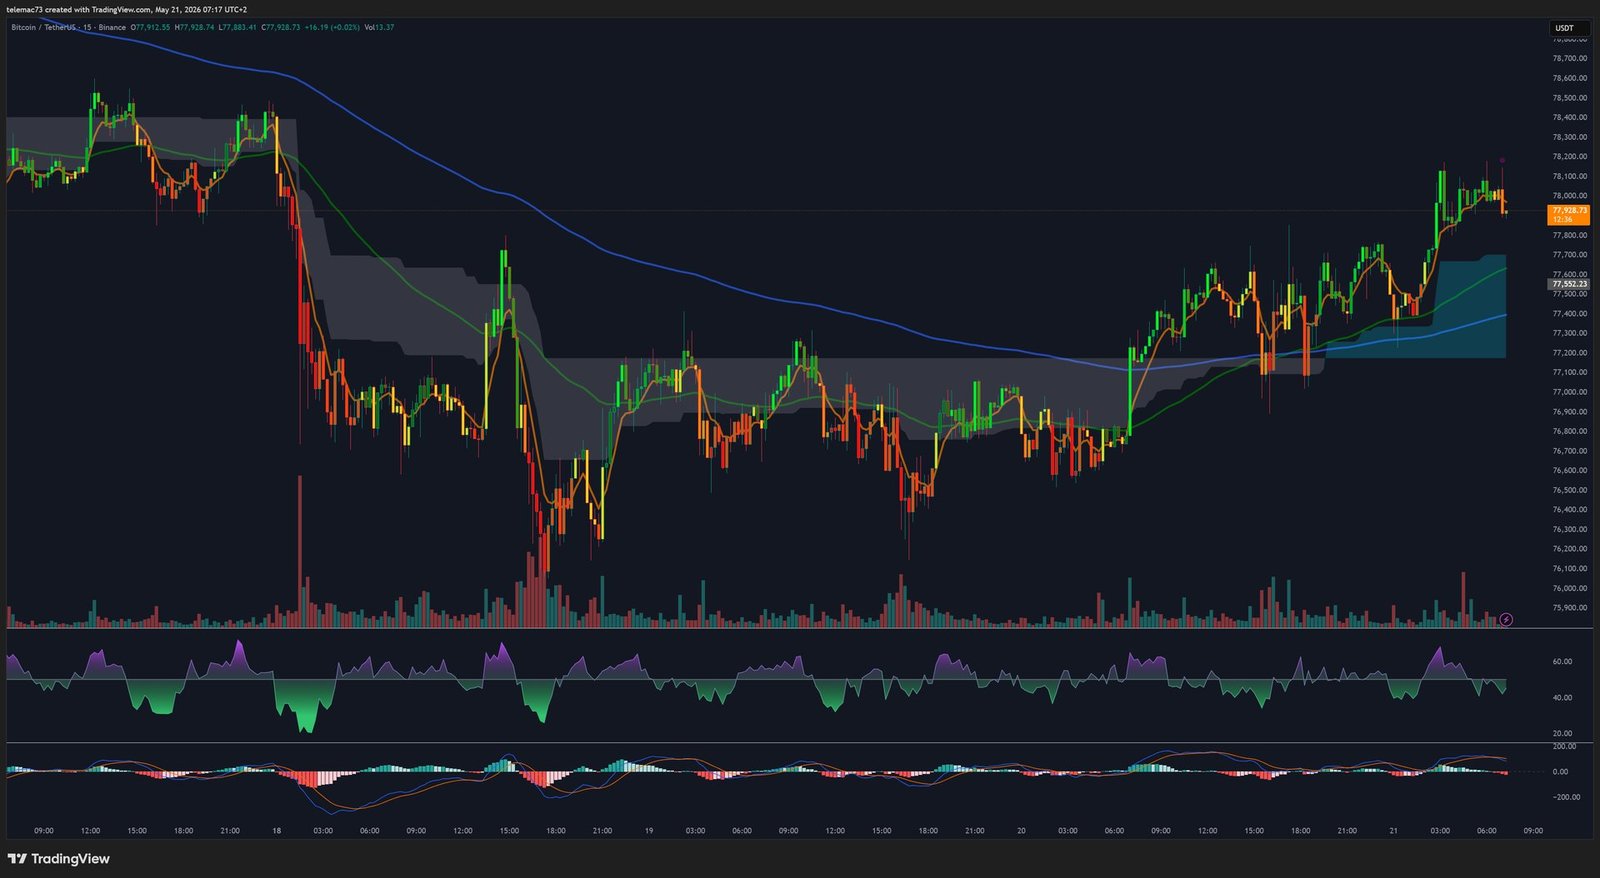
The 15-minute chart precisely captures the violence of the recent capitulation in the $76,000–$76,500 zone. A red candle accompanied by the session’s highest volume spike — the classic signature of a stop-loss hunting event — allowed institutional players to absorb retail trader liquidity forced to liquidate longs in panic.
Since that local low, an asymmetric « V-shaped » recovery has emerged, supported by encouraging micro-structural signals:
- 15m RSI: bounced from extreme oversold territory (<30) with an aggressive bullish divergence, reclaiming neutral-to-positive levels.
- 15m MACD: completed a Golden Cross with expanding green histograms — short-term buying momentum developing.
- SMA 100 (1H) at $77,200–$78,000: dynamic resistance that must be cleared to confirm an intraday Bull Flag structure.
Key Price Levels and Strategic Matrix
| Price Level (USD) | Type | Strategic Significance |
|---|---|---|
| $88,000 – $95,000 | 🎯 AI Target | Grok AI model post-breakout objective. Condition: sustained close above $82,000. |
| $83,132 – $83,522 | 🔴 Major Resistance | Elliott 138.2% extension + Fibonacci 0.618 (golden ratio) confluence. Ultimate ceiling before Price Discovery. |
| $80,000 – $82,847 | 🔴 Sell Wall / FVG | Glass ceiling. Heatmap sell wall. Critical invalidation pivot for bearish bias. |
| $79,025 | ⚡ Fib 0.5 Pivot | Fibonacci 50% retracement level. Last defense before summit assault. |
| $77,928 | 📍 CURRENT PRICE | Maximum compression zone. Peak indecision between institutional bulls and bears. |
| $76,000 – $76,800 | 🟢 Local Support | Recent capitulation low. Ascending channel floor. |
| $74,000 – $75,000 | 🟢 Institutional Support | Dense bid clusters on Heatmap. Buy Power: 65 on 4H chart. |
| $72,035 | 🟢 200-day EMA | Secular bull market survival line. 2026 trend-defining level. |
| $70,000 | 🚨 Last Resort Support | Ultimate algorithmic heatmap floor. |
Predictive Models and Wave Theory
Advanced AI models (Grok AI) analyzing the multifactorial convergence of macro data, ETF flows, and regulatory signals project a measured target between $88,000 and $95,000 by end of May 2026 — conditional on a sustained daily close above $82,000. Over a longer horizon, institutional convergence and the post-halving supply shock open pathways toward $200,000 by end of 2026.
Elliott Wave analysis suggests the global BTC structure is tracing a large corrective zigzag (A)-(B)-(C), with sub-wave (B) now complete. The terminal impulsive Wave C under construction projects a target of $83,132 (138.2% extension). This Elliott target converges remarkably with the golden ratio of Fibonacci (0.618) positioned at $83,522 — an extraordinary confluence between two independent methodologies, confirming this as the priority objective in the event of confirmed trend resumption.
Conclusion: The Coiled Spring
Bitcoin’s comprehensive ecosystem analysis in May 2026 reveals a formidable signal asymmetry. On the bearish side: a daily Rising Wedge, multi-timeframe MACD Death Crosses, rejection below the 50/100-day EMAs, and massive spot ETF outflows. On the bullish side: whale stealth accumulation, a Token Turnover Rate of 2.83% (97% of supply dormant), decisive CLARITY Act Senate progress, and pro-Bitcoin state legislation.
The market is acting as a coiled spring under extreme compression between $75,000 and $80,000. The institutional Bear Trap hypothesis is statistically credible. The direction of the volume impulse that breaks price free from this range will define the directional trend for the remainder of the quarter.
🟢 Bullish scenario: Decisive daily close above $80,000 → Short Squeeze → Elliott/Fibonacci confluence at $83,000–$83,500 → Price Discovery at $88,000–$95,000.
🔴 Bearish scenario: Prolonged failure below $80,000 + deteriorating macro → breakdown of $75,000 support → convergence toward the 200-day EMA at $72,000 (the 2026 bull market’s ultimate stress test).
⚠️ Important Disclaimer: This article is written for exclusively educational and informational purposes. It does not constitute investment advice, a recommendation to buy or sell, or an inducement to conduct any financial market operations. Cryptocurrencies are extremely volatile assets that carry a risk of total capital loss. Consult a licensed financial advisor before making any investment decision.