
May 19, 2026 — Bitcoin (BTC/USDT) is navigating one of the most complex technical and macroeconomic configurations in its recent history, trading around $76,833, down 1.98% on the session. This level, the lowest since late April 2026, reflects a year-to-date correction of 12.24% and a 39.15% decline from the all-time high of $126,272 set on October 6, 2025. Behind the raw numbers, an underground war between restrictive macro forces and accelerating sovereign adoption is reshaping the market landscape.
The Bond Market Collapse: The Macroeconomic Catalyst
The current price compression cannot be analyzed without understanding the central role of the U.S. bond market. The 10-year Treasury yield violently breached resistance at 4.63%, reaching its highest level since February 2025 — a 70 basis point surge since the escalation of the Iran conflict. This dynamic triggered a massive wave of liquidations estimated at over $670 million across the crypto market over just a few trading sessions.
The implications are mathematically devastating for non-yielding assets. In a standard discounted cash flow (DCF) model, a risk-free rate approaching 5% mechanically compresses the valuation multiples of growth assets. Institutional capital performs algorithmic arbitrage in favor of Treasuries, sacrificing crypto positions to lock in government-guaranteed yields. With only a 2% probability of a rate cut before year-end 2026 priced into futures markets, the macroeconomic environment remains structurally hostile. U.S. mortgage rates are dangerously approaching 7%, suffocating credit demand and compressing monetary velocity.
The Geopolitics of Bitcoin: Strategic Reserve and Sanctions Evasion Tool
Behind the market brutality, a silent geopolitical revolution is unfolding. The White House is on the verge of formalizing the creation of a U.S. Strategic Bitcoin Reserve. According to Patrick Witt, a decisive legal hurdle has been cleared, paving the way for unprecedented institutional integration. Senator Cynthia Lummis is pressing Congress to vote on the BITCOIN Act before the summer recess — the last legislative window before the midterm campaign monopolizes congressional time. If adopted, the U.S. Treasury would make its first open-market BTC purchase in Q4 2026, making the United States the first sovereign superpower to officially accumulate Bitcoin as a monetary reserve asset.
At the other end of the geopolitical spectrum, Iran has launched a Bitcoin-backed maritime insurance service designed to circumvent sanctions related to the Strait of Hormuz blockade — a program targeting $10 billion in revenues. Simultaneously, corporate actors like Capital B are pursuing aggressive accumulation, growing their treasury to 3,135 BTC, while Bitcoin Depot, the world’s largest crypto ATM operator, collapses 80% following its Chapter 11 bankruptcy filing. This ecosystem cleanse eliminates actors whose business model could only survive under zero-interest-rate policy (ZIRP), paradoxically strengthening long-term industry resilience.
The ETF War: Institutional Dichotomy
The first half of May 2026 exposed a deep institutional fracture. After an initial inflow of $700 million into Spot Bitcoin ETFs (with BlackRock alone capturing $251M in a single exceptional session), the tide violently reversed as rates resumed their climb. May 13 will be remembered in the annals: $630.4 million in net outflows in a single trading session — a record hemorrhage.
| ETF Issuer (Ticker) | Net Outflows May 13, 2026 | Market Impact |
|---|---|---|
| BlackRock (IBIT) | $284.7M | Severe — major institutional capital withdrawal signal |
| ARK Invest (ARKB) | $177.1M | Strong — tech-focused investor base capitulation |
| Fidelity (FBTC) | $133.2M | Strong — wealth management risk reduction |
| Bitwise (BITB) | $35.4M | Moderate — portfolio rebalancing |
| Total (May 13) | $630.4M | Extreme — catalyst for short-term support breakdown |
The true revelation comes from Goldman Sachs’ Q1 2026 13F filings: the bank completely liquidated its $154M XRP and Solana ETF positions, while slashing its Ethereum exposure by 70%. By sharp contrast, it maintained $700 million in Bitcoin ETFs, making only marginal tactical adjustments. The message sent to institutional desks is unambiguous: BTC is now the sole institutionally viable digital asset, classified as a systemic reserve alongside traditional assets.
Market Microstructure: Order Book Anatomy
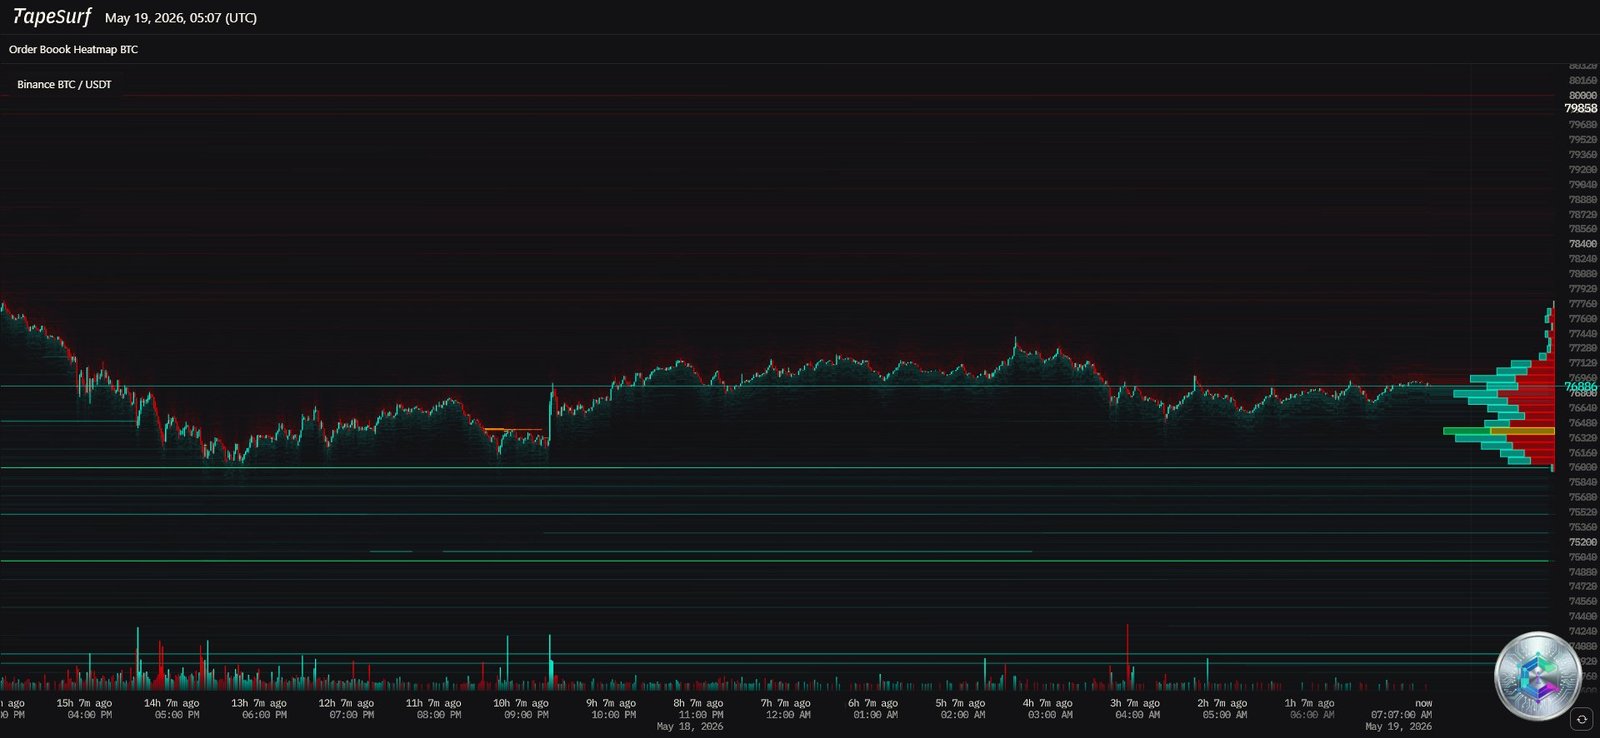
The order book heatmap reveals a particularly constraining liquidity architecture. The current price is literally caught between two opposing liquidity zones:
- Overhead resistance ($79,650 – $80,000): A dense red band of massive sell orders acts as a repulsive magnet. Market-making algorithms and institutional entities deploy enormous sell blocks at this psychological level. Every bullish attempt collides with this wall, generating immediate rejections and upper wicks on charts.
- Defensive supports ($76,000 / $74,800 / $73,700): Cyan and green bands form algorithmic safety nets that absorb brutal selling. These zones explain why Bitcoin doesn’t collapse in a straight line despite a deleterious macro environment.
A decisive break outside the $75,000 – $80,000 compression channel will determine the directional trend for late May. A breakout above $80,000 would trigger a cascading Short Squeeze targeting $84,000 – $85,500. A breakdown below $75,000 would direct price toward the next structural support at $72,800 – $73,000.
Technical Analysis — 15-Minute Chart: Post-Capitulation & Bear Flag
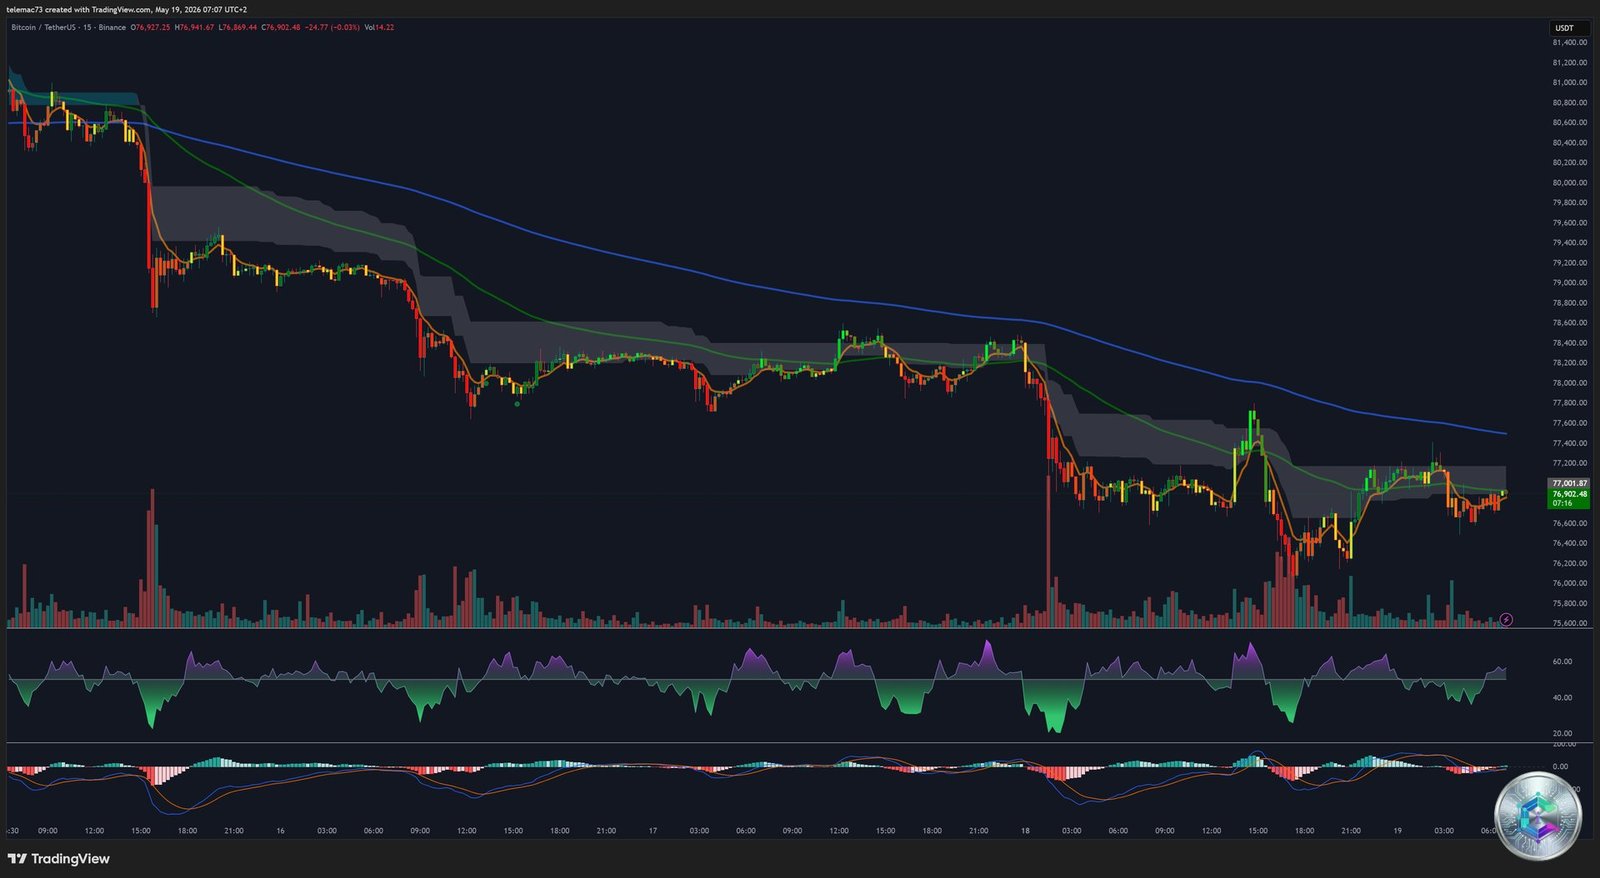
The intraday granularity exposes a characteristic post-capitulation structure. A massive bearish candle accompanied by an exceptional volume spike shattered local supports, plunging the price from around $78,500 to $76,000 in a matter of hours. The RSI plunged to extreme values below 20 — a signal of irrational short-term panic selling, historically associated with mean reversion bounces.
The subsequent consolidation phase resembles a slowly developing Bear Flag, with a slight bearish bias and a choppy structure. The MACD displays a tentative Golden Cross attempt in negative territory, suggesting that immediate selling pressure has been exhausted. Nevertheless, prices remain stuck below the cloud’s dynamic resistance, confirming firm bearish control at the very short-term horizon.
Technical Analysis — 4-Hour Chart: Buy Power vs Sell Power
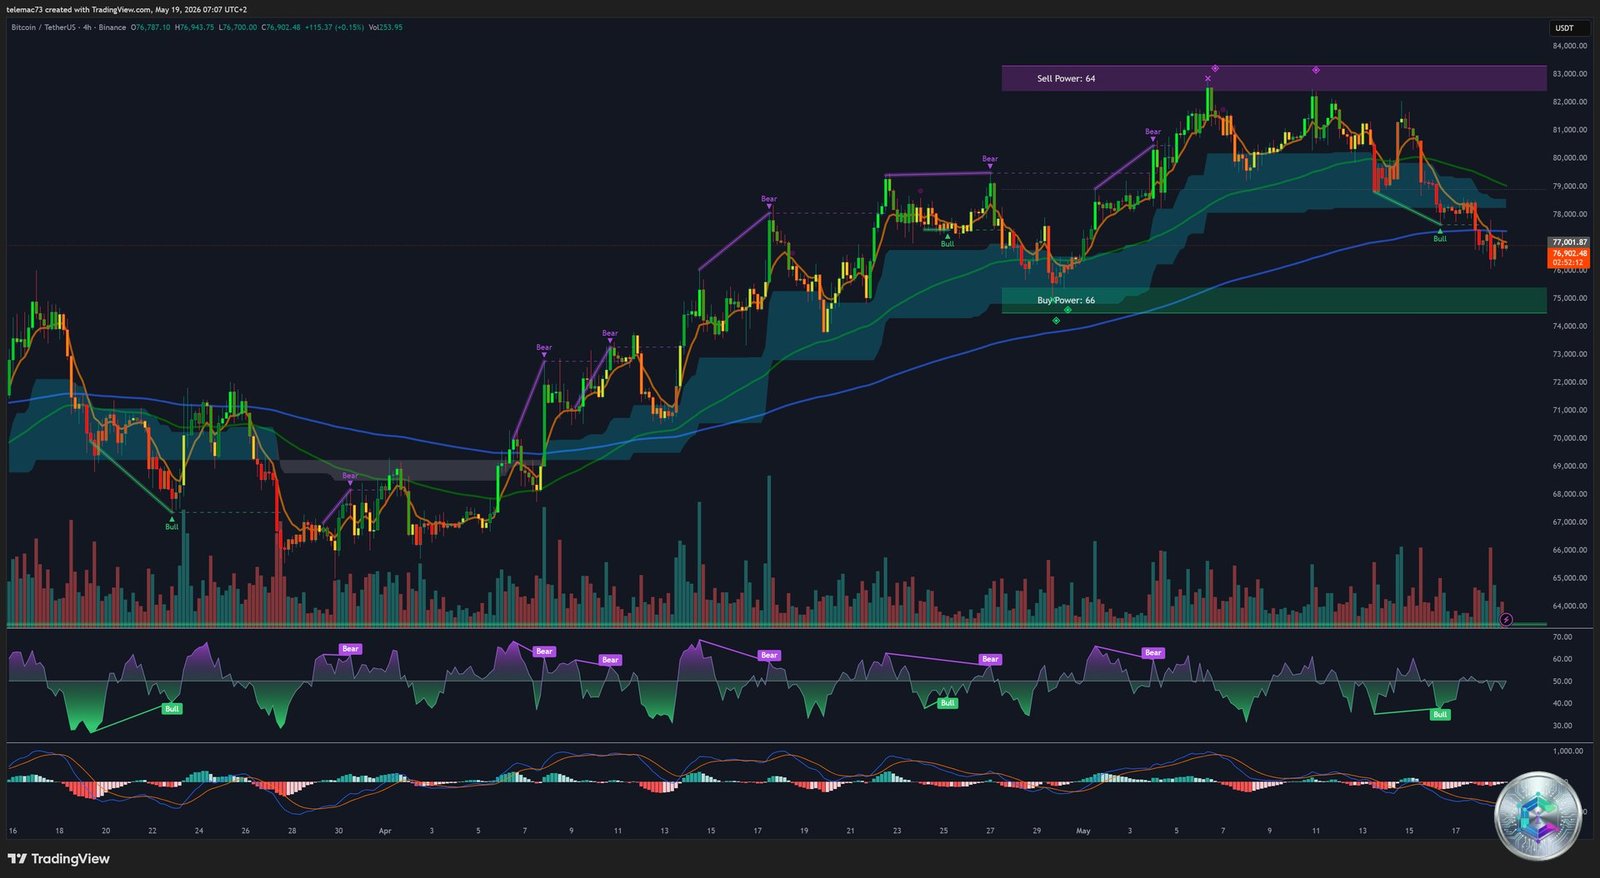
The H4 chart delivers a precise algorithmic reading of the medium-term dynamic. The rejection from the Sell Power zone ($82,000 – $83,000), materialized by algorithmic bearish signals (purple arrows), triggered a classic cascade: bearish impulses → Bear Flags → further breakdowns. Price is currently attempting a rebound from the Buy Power zone ($73,000 – $75,000), hovering around $77,001, below the moving average cloud that acts as a heavily bearish dynamic glass ceiling.
The most promising development comes from the H4 MACD: the histogram is transitioning from dark red bars to a faded red, signaling a clear deceleration in bearish momentum. A bullish MACD crossover (Golden Cross) in negative territory appears imminent — a precursor signal for a potential re-accumulation phase or a corrective bounce toward $80,000 resistance. The H4 RSI, after flirting with oversold levels, is attempting to break its own downtrend line, though still below the neutral 50 mark.
Technical Analysis — Daily Chart: The Contrarian « Death Cross » Phenomenon
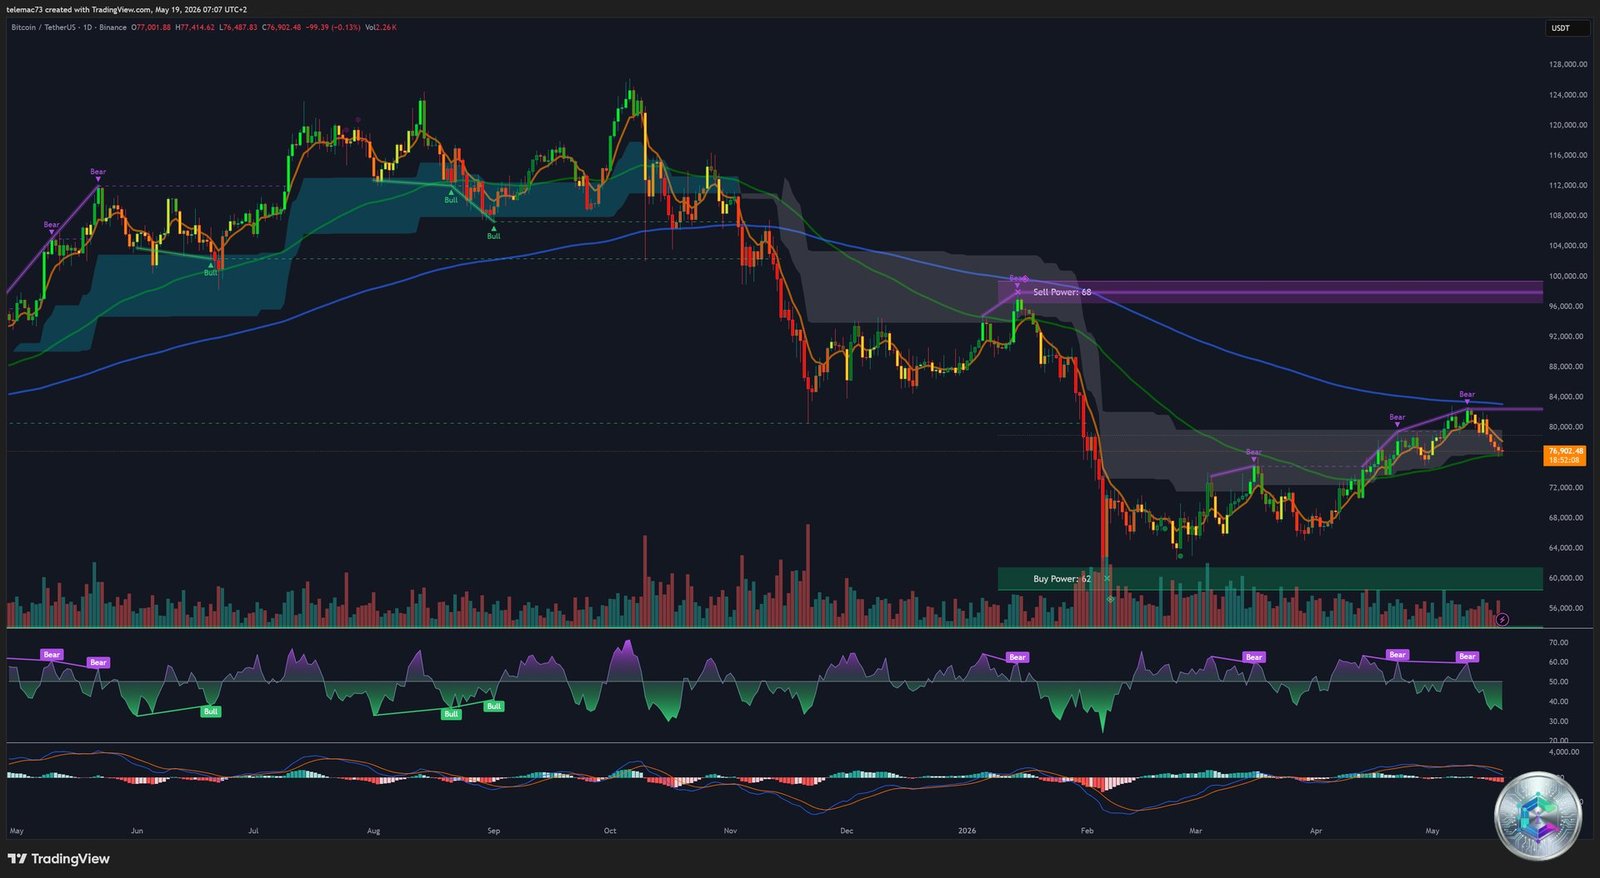
The daily chart is the arena for the phenomenon capturing all analytical attention: the imminent formation (or recent confirmation) of a Death Cross. This signal occurs when the 50-day SMA crosses below the 200-day SMA, traditionally interpreted as the official seal of a deep bear market. The daily RSI navigates in its lower third, without bullish divergence, confirming seller control over the pace of the decline.
However, Bitcoin’s empirical history demands a radical reinterpretation. This crossover would be the fourth Death Cross of the current cycle. The analysis of past occurrences is illuminating:
- September 2023 (~$25,000): Death Cross → absolute floor before a meteoric rally to new heights.
- August 2024 ($49,000 – $55,000): Death Cross amid a global market crash → stabilization, directional reversal, explosion above $100,000 in December 2024.
- April 2025 (~$75,000): Death Cross linked to U.S. tariff uncertainty → cycle trough before structural recovery.
The pattern repeats with disturbing regularity: in the crypto universe, the Death Cross often acts as the ultimate Bear Trap of the cycle, marking the total exhaustion of panicked sellers before an asymmetric institutional reversal. The central question for May 2026: will history repeat itself a fourth time?
Key Price Level Map: Support & Resistance
| Level (USDT) | Technical Category | Significance & Breakdown Consequence |
|---|---|---|
| $96,000 – $100,000 | Macro Resistance | Historical glass ceiling. Long-term bear market invalidation target. |
| $84,000 – $85,500 | Major Resistance | Institutional supply + SMA 50 confluence. Short Squeeze above this level. |
| $80,000 | Psychological Resistance | Current Maginot Line. Colossal overhead supply. Systematic rally failure zone. |
| $76,833 | Current Price / Pivot | Complete indecision zone. No fundamental catalyst present. |
| $75,000 – $76,000 | Critical Support | Primordial invalidation zone. Breakdown = leveraged position liquidation cascade. |
| $72,800 – $73,000 | Strong Support | H4 Buy Power confluence. Second institutional defensive line. |
| $70,000 – $60,000 | Macro Structural Support | Ultimate cycle bulwark. A drop here confirms entry into a deep crypto winter. |
Price Projections: Three Scenarios for Late May – June 2026
| Time Horizon | Price Target | Realization Conditions |
|---|---|---|
| Short Term (Late May 2026) | $76,000 – $77,200 | Dominant sideways movement (+4.5% to +5%). Unwavering hold above $75,000 required. ETF outflow stabilization needed. |
| Medium Term (June 2026) | $80,500 – $82,500 | Bullish breakout (+7% to +8%). Conditional on $80,000 cluster absorption and Strategic Bitcoin Reserve narrative acceleration. |
| Base Scenario (Mid-June) | $77,437 | Binance algorithmic projection. Market stuck in the mud, failing to sustainably breach dynamic resistance without exogenous catalyst. |
Conclusion: The $75,000 Front Line
Bitcoin on May 19, 2026 embodies a rare confluence of opposites: the mathematical brutality of bond yields against the gestation of sovereign utility unprecedented in asset history. Macroeconomics is currently dictating the law, vampirizing liquidity through 4.60%+ Treasury yields. Yet Goldman Sachs maintains $700M in BTC, the U.S. Treasury is preparing to buy Bitcoin, and Iran is making it a last-resort financial infrastructure.
The zone between $75,000 and the current price of $76,800 represents the decisive front line. If bond yields manage to stabilize, the underground accumulation by states and institutions will eventually drain circulating supply. A confirmed reconquest of $80,000 will unlock price discovery that finally integrates the colossal geopolitical premium the market is currently pretending to ignore. The current volatility compression cannot last forever.
⚠️ Disclaimer: This article is written for educational and informational purposes only. It does not constitute investment advice, nor a recommendation to buy or sell digital assets. Cryptocurrency markets are highly volatile and carry significant risk of capital loss. Please consult a licensed financial advisor before making any investment decisions.